Chapter 1. General assessment of the macroeconomic situation
Introduction
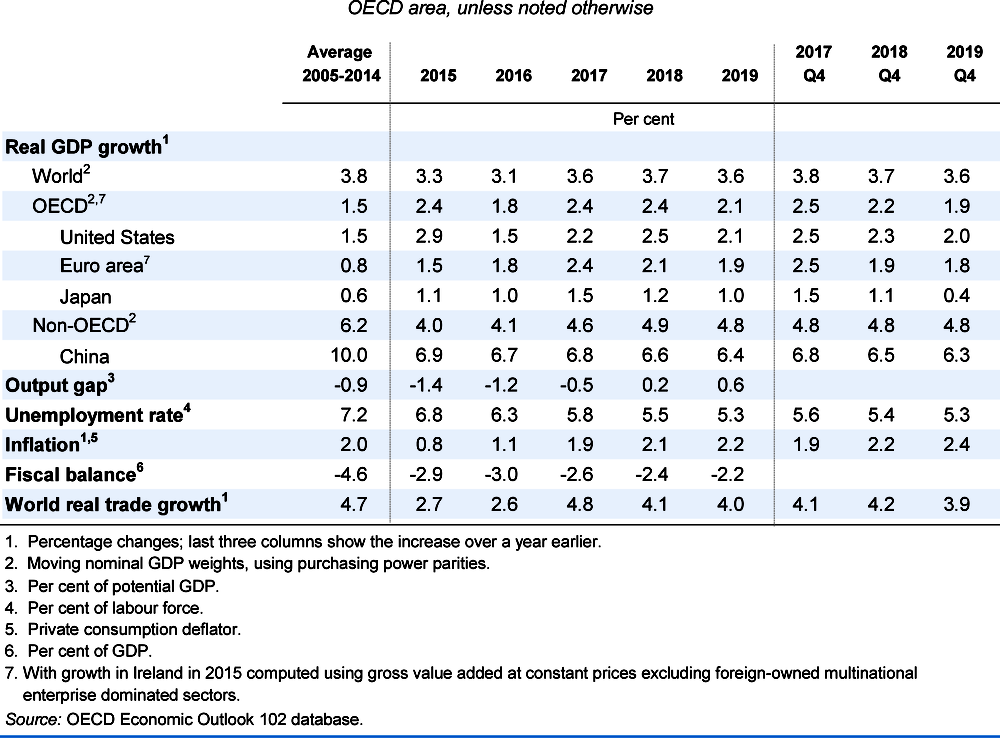
The global economy is now growing at its fastest pace since 2010, with the upturn becoming increasingly synchronised across countries. This long awaited lift to global growth, supported by policy stimulus, is being accompanied by solid employment gains, a moderate upturn in investment and a pick-up in trade growth. Global GDP growth is projected to be just over 3½ per cent this year, strengthening further to 3¾ per cent in 2018 before easing slightly in 2019 (Figure 1.1; Table 1.1). On a per capita basis, growth is set to improve but fall short of pre-crisis norms in the majority of OECD and non-OECD economies. Inflation is currently subdued in the major economies and is set to remain moderate, although edging up gradually as resource pressures build.
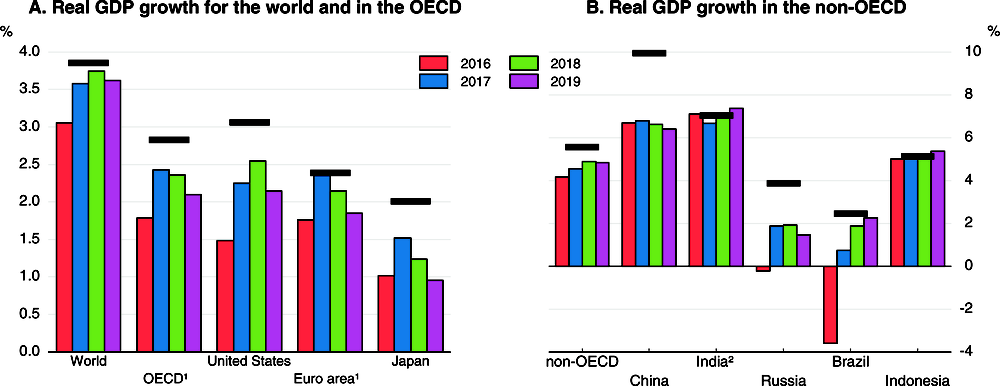
Note: Horizontal lines show the average annual growth rate of GDP in the period 1987-2007. Data for Russia are for the average annual growth rate in the period 1994-2007.
1. With growth in Ireland in 2015 computed using gross value added at constant prices excluding foreign-owned multinational enterprise dominated sectors.
2. Fiscal years.
Source: OECD Economic Outlook 102 database; IMF World Economic database; and OECD calculations.
Whilst the near-term cyclical improvement is welcome, it remains modest compared with the standards of past recoveries. Moreover, the prospects for continuing the global growth up-tick through 2019 and securing the foundations for higher potential output and more resilient and inclusive growth do not yet appear to be in place. The lingering effects of prolonged sub-par growth after the financial crisis are still present in investment, trade, productivity and wage developments. Some improvement is projected in 2018 and 2019, with firms making new investments to upgrade their capital stock, but this will not suffice to fully offset past shortfalls, and thus productivity gains will remain limited. Growth also remains softer than in the past in the emerging market economies (EMEs), dimming both prospects for their catch-up and for faster global growth (given their steadily rising role in the global economy). EME growth is hampered by slowing reform efforts and financial vulnerabilities from high debt burdens, particularly in China. Financial risks are also rising in advanced economies, with the extended period of low interest rates encouraging greater risk-taking and further increases in asset valuations, including in housing markets (Chapter 2). Productive investments that would generate the wherewithal to repay the associated financial obligations (as well as make good on other commitments to citizens) appear insufficient.
Improved short-term momentum and the fiscal room created by the current accommodative monetary policy environment provide an opportune moment for further rebalancing policy to address the structural impediments to stronger and more inclusive medium-term growth, and to increase resilience against possible risks. Monetary policy will be differentiated according to the need to support growth but with greater attention to financial stability and the potential for cross-border turbulence from rising differences in policy settings across countries. The fiscal easing underway in many economies should be delivered as planned in 2018, alongside redoubled efforts to focus tax and spending policies and structural policy efforts on the country-specific measures required to support inclusive and sustainable growth. Active and timely deployment of prudential and supervisory policies in both advanced and emerging market economies would help to address financial vulnerabilities (Chapter 2). Better integrated policy packages that address domestic and international weaknesses are necessary to ensure that the gains from technological change and cross-border trade and investment are more widely shared by workers, households and regions.
Prospects for the medium term depend on the responses of market actors to policy settings, including the monetary policy stance, the effective deployment of fiscal space and associated changes in the quality of the public finances. Further structural policy reforms focusing on measures to promote greater business dynamism, trade and investment, encourage increased labour force participation, and improve the functioning of financial institutions would strengthen growth potential and complement the productivity gains that could be achieved through corporate spending on knowledge-based capital. The upside potential for productivity and wages to support inclusive growth – the avenue by which countries can meet the expectations of citizens – depends on the packages of policies appropriate for each country. Given high debt, financial turbulence from unexpected macroeconomic policies, or a materialisation of downside risks in key economies or financial markets, would result in weaker growth outcomes, larger shortfalls from past performance, and a further diminishing of trust in the capabilities of policymakers.
Global growth momentum will stay strong, but only for a while
Global GDP growth is set to be just over 3½ per cent this year, the fastest for seven years, with improved outcomes in both advanced economies and the EMEs. Confidence measures and levels of new orders for businesses remain strong (Figure 1.2, Panel A), pointing to improved short-term growth prospects, although they have run ahead of activity data in some countries and sectors (Figure 1.2, Panel B). Industrial production and retail sales growth have also both strengthened this year (Figure 1.2, Panels C and D). Amongst the advanced economies, policy easing (both fiscal and monetary) is helping growth to remain stronger than anticipated in the euro area, and also in many other small open economies strongly connected to the euro area via value-chain linkages. Strong infrastructure investment in China in 2016 and 2017 is a key driver of the upturn in the EMEs, boosting external demand elsewhere, especially in Asia, and contributing to the recovery now underway in many commodity-exporting economies. By some measures, financial conditions remain supportive in the major economies (see below), although further increases in asset prices and the compression of risk spreads are adding to potential financial vulnerabilities. Commodity prices have risen, partly reflecting strong industrial demand as well as geopolitical risks and supply constraints from the agreement amongst OPEC and select non-OPEC members to restrict oil production through to March 2018. Nonetheless, prices remain below the peaks seen in 2010-11, suggesting that the impact on growth prospects may be modest, although they will push up headline inflation.
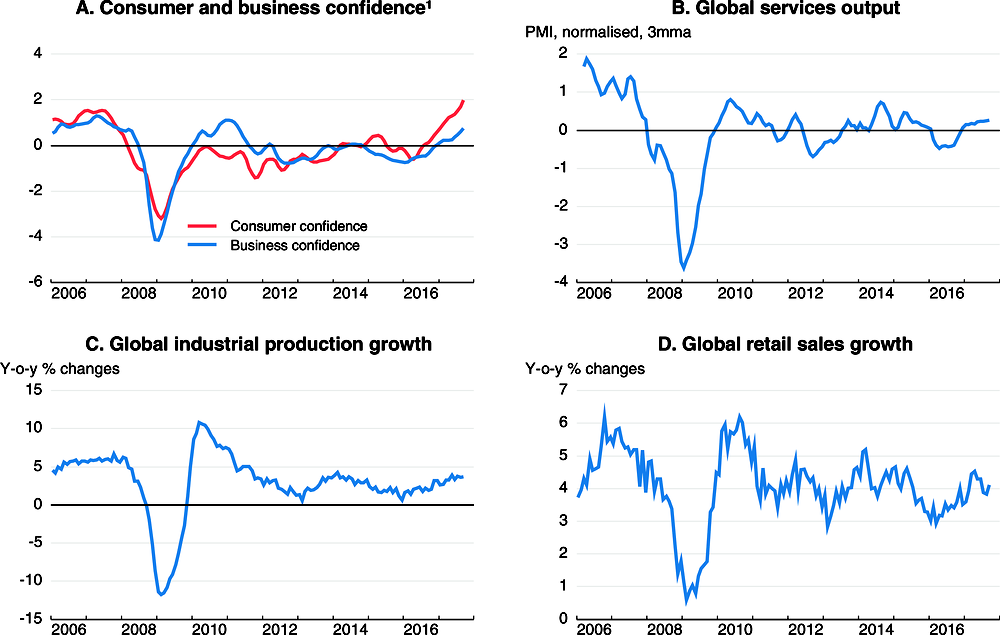
Note: 3mma stands for 3-month moving average.
1. Based on OECD member countries, Brazil, China, India, Indonesia, Russia and South Africa.
Source: OECD Main Economic Indicators database; Markit; Thomson Reuters; and OECD calculations.
The broad-based cyclical upturn (Figure 1.3, Panel A) is set to persist into 2018, with global GDP growth projected to strengthen to 3.7%.1 Over 2017-19 as a whole, global growth is projected to average 3.6% per annum, which is comparatively modest for a cyclical upswing. In the advanced economies, supportive macroeconomic policies, steady labour market improvements and accommodative financial conditions should help to underpin demand, with GDP growth averaging close to 2¼ per cent over the projection period. On a per capita basis, GDP growth is also projected to improve over 2017-19 in the advanced economies, but not at a pace sufficient to offset the decade of sub-par growth after 2007 (Figure 1.3, Panel B). Monetary policy is set to remain accommodative in the major economies in 2018-19 and fiscal policy easing will offer more support to activity than in the three years prior to 2017. In the median OECD economy, a fiscal easing of around 0.6% of GDP is projected to occur over 2017-19, with the main boost in 2017 and 2018, after consolidation of around 0.4% of GDP over 2015-16. By 2019, GDP growth is projected to ease mildly in the majority of major economies as capacity constraints begin to emerge, in part because the upturn in productive investment is projected to remain weaker than is necessary to strengthen potential output growth.
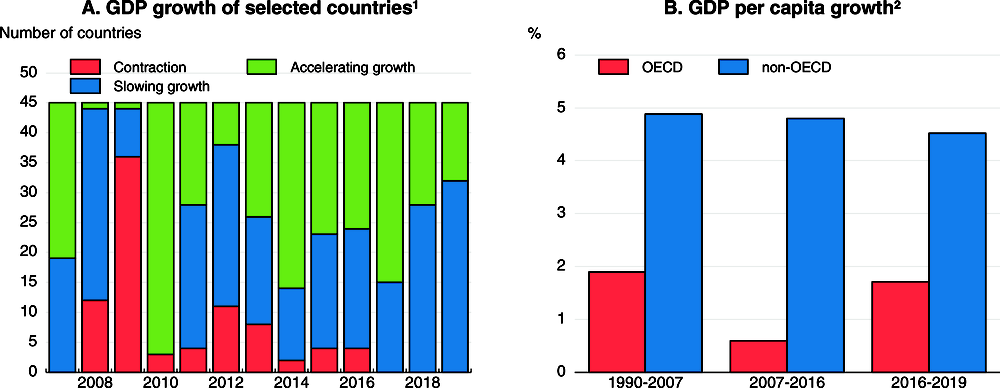
1. Accelerating/slowing growth refers to a comparison with the previous year at annual frequency.
2. The OECD and non-OECD aggregates are calculated with moving nominal GDP per capita weights using purchasing power parities. The non-OECD aggregate is based on data for Argentina, Brazil, China, Colombia, Costa Rica, India, Indonesia, Lithuania, Russia, Saudi Arabia, South Africa and the Dynamic Asian Economies (Chinese Taipei, Hong Kong - China, Malaysia, the Philippines, Singapore, Thailand and Vietnam).
Source: OECD Economic Outlook 102 database; UN database; and OECD calculations.
In the EMEs, an upturn in investment is projected to support growth in India and the Dynamic Asian Economies in 2018-19, and a continued recovery is projected in Brazil and Russia, helped by the higher level of commodity prices and more accommodative monetary policy. However, a projected gradual slowdown in domestic demand growth in China, as stimulus measures in 2016-17 ease and necessary efforts continue to stabilise corporate debt and reduce excess capacity, will check the overall pace of trade and output growth in key trading partners in 2018-19. On a per capita basis, GDP growth in the non-OECD economies as a whole is set to ease over 2017-19 (Figure 1.3, Panel B).
Global trade growth has rebounded since the first half of 2016 and become increasingly broad-based across economies. Key factors underlying this include the recovery in Europe (a relatively trade intensive part of the world economy), the strong pick-up in electronics trade in Asia, and a shift in the composition of demand towards investment, which is more import intensive (Figure 1.4, Panel A). Nonetheless, trade intensity is set to remain mild by pre-crisis standards (Figure 1.4, Panel B). In part, this reflects structural factors, including a slowdown (OECD-WTO, 2017), or possibly even a reversal (Haugh et al., 2016), in the deepening of global value chains. The number of new trade restrictions in the major economies has also built up over the past decade, though the rate of increase is now easing (WTO, 2017). The cyclical upturn in investment intensity is also projected to be weaker than seen in the past at the global level (Figure 1.5).2
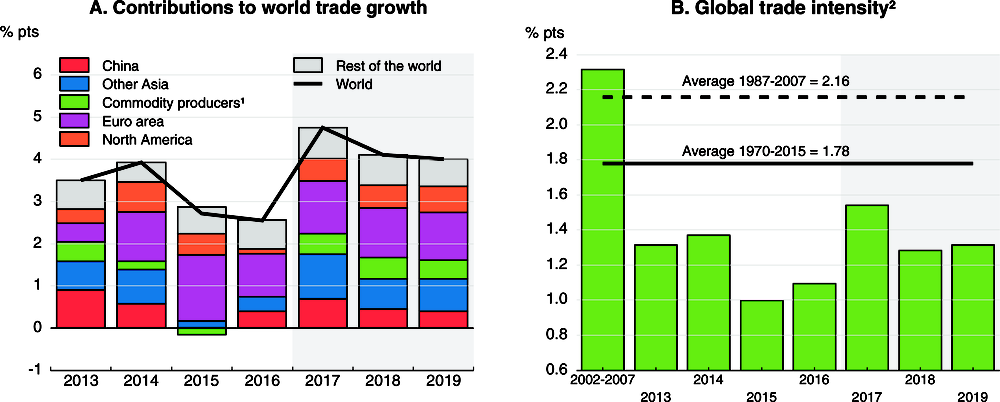
1. Commodity producers includes Argentina, Australia, Brazil, Chile, Colombia, Indonesia, Norway, New Zealand, Russia, Saudi Arabia, South Africa and other oil producing countries.
2. World trade volumes for goods plus services; global GDP at constant prices and market exchange rates. Period averages are the ratio of average annual world trade growth to average annual GDP growth in the period shown.
Source: OECD Economic Outlook 102 database; and OECD calculations.
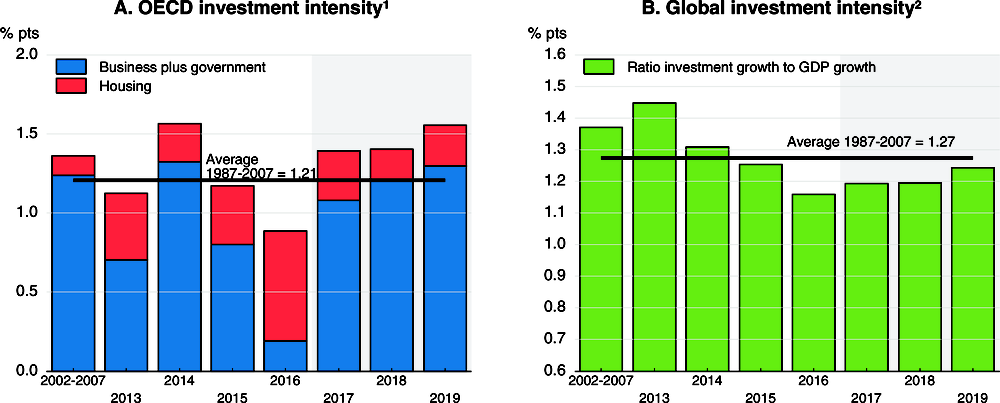
Note: Period averages are the ratio of average annual gross investment growth to average annual GDP growth in the period shown.
1. Ratio of OECD investment growth to OECD GDP growth in period shown.
2. Fixed capital investment and GDP growth in the OECD, Brazil, China, Chinese Taipei, Hong Kong - China, India, Indonesia, Malaysia, the Philippines, Russia, Singapore, South Africa, Thailand and Vietnam, at constant prices.
Source: OECD Economic Outlook 102 database; IMF World Economic Outlook database; Consensus Economics; and OECD calculations.
Strong and sustained medium-term growth is not yet secured
A more robust investment upturn is required for a sustained recovery in the advanced economies
Investment is now rising in most advanced economies, but the upturn remains weaker than the average of past recoveries, implying slow growth of productive capital and limiting prospects for productivity growth and potential output. Since the financial crisis, weak global demand growth and heightened policy and regulatory uncertainty have driven the persistent weakness of investment (OECD, 2015; Égert and Gal, 2017). Financial constraints arising from impaired banking sectors in some economies, resources trapped in unproductive “zombie” firms (Adalet McGowan et al., 2017) and the slowdown in reform efforts to tackle regulations that impede product market competition (OECD, 2017b) have also helped to weaken incentives to invest.
Some of these constraints have begun to ease, with signals about prospects for investment generally improving over the past year. After stagnating in 2016, business investment has risen by just under 3¾ per cent in the advanced economies this year, and capital goods production has strengthened through 2017. Corporate surveys also point to improving investment intentions in the euro area and the United States and emerging capacity shortages in Japan. The current broad-based improvement in near-term growth prospects should also help to stimulate investment, given empirical and survey indications that global demand matters as a distinct driver beyond domestic demand for many investment decisions (OECD, 2015). However, questions remain about how strong and long-lasting the investment rebound will be. Potential obstacles to a sustained recovery include a step-down since the financial crisis in expectations over the longer-term for global GDP growth;3 a decline in business dynamism in several countries (Figure 1.6; Carey et al., 2016; Millar and Sutherland, 2016),4, 5 with potentially adverse effects on competitive innovation, investment and productivity diffusion; and still high global policy uncertainty, including about trade policy developments. These all suggest that policy choices will have an important bearing on medium-term investment prospects.
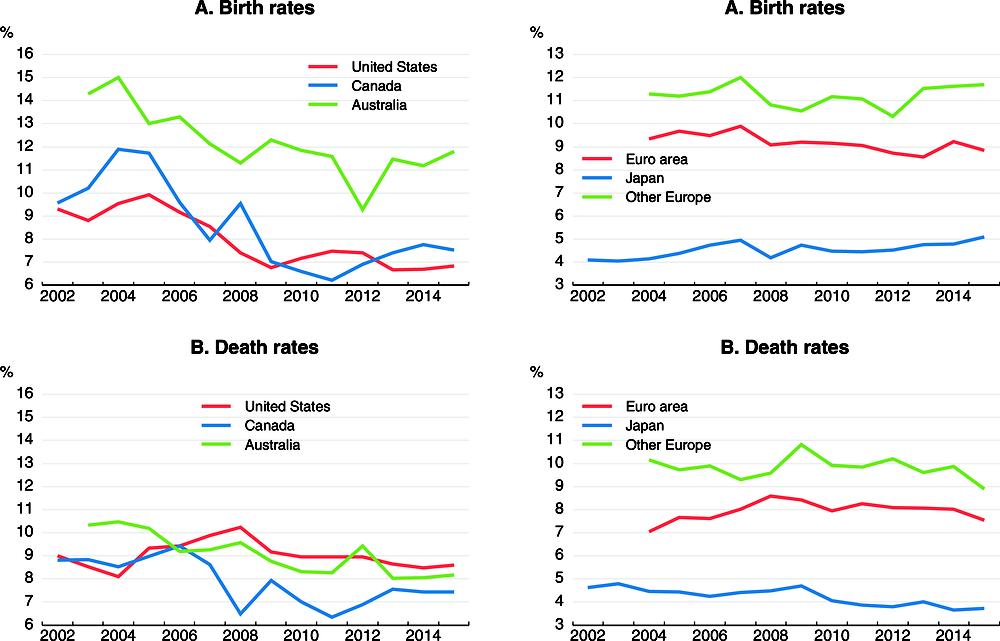
Note: Number of enterprise births and deaths in year t over number of active enterprises in year t. Data for the United States and Canada are estimated in 2013-15 and 2014-15 respectively, using separate data from the US Census Bureau and Statistics Canada. The euro area estimates are an unweighted average of birth and death rates in member states. The estimates for “other Europe“ are unweighted averages of birth and death rates in the Czech Republic, Denmark, Hungary, Norway, Poland, Sweden and the United Kingdom.
Source: OECD Structural and Demographic Business Statistics Database; Japanese Ministry of Health, Labour, and Welfare; and OECD calculations.
The pace of business investment growth in the advanced economies is projected to average around 3½ per cent per annum over 2018-19, suggesting that longer-term structural impediments outweigh more favourable cyclical conditions and leaving growth of the productive capital stock (which includes government as well as business investment) well below pre-crisis norms in most countries. In the median OECD economy, investment spending in 2018-19 is projected to be around 15% below the level required to ensure the productive net capital stock rises at the same average annual pace as over 1990-2007 (Figure 1.7).6 With depreciation rates having risen over time by over 1¼ percentage points in the median OECD economy between the 1997-07 average and 2016 (in part due to the shorter lifespans of technology investments), much stronger gross investment is now required to achieve the same net capital stock growth (Figure 1.8).
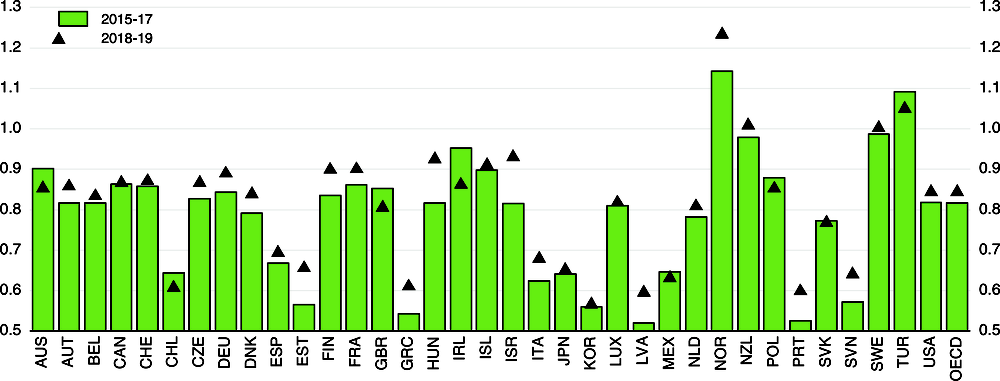
Note: Estimates for the OECD are for the median country. Investment comprises business and government gross fixed capital investment.
Source: OECD Economic Outlook 102 database; and OECD calculations.
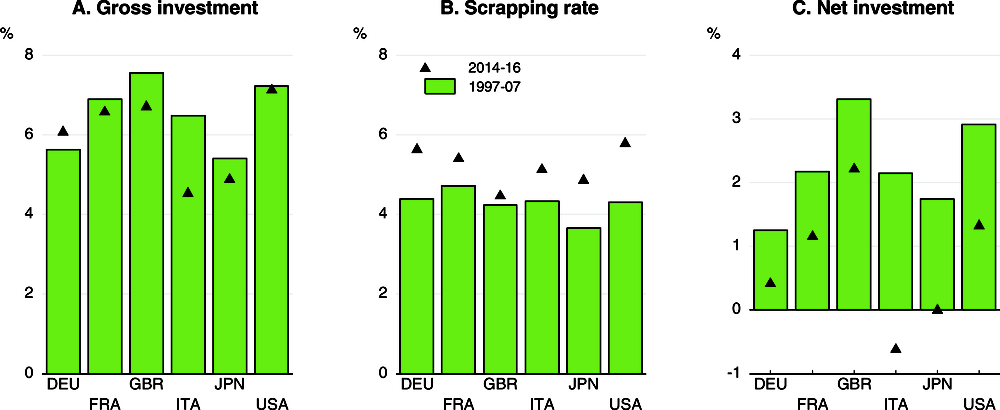
Note: Business plus government investment. The series are annual averages for the period shown.
Source: OECD Economic Outlook 102 database; and OECD calculations.
However, there could still be improvements to growth prospects even if companies seek only to upgrade their existing capital assets. The improving momentum in the global IT cycle, driven by production in the Asian economies (Figure 1.9), signals that a key part of any capital stock upgrade could be the replacement of old equipment and software with new enhanced digital technologies, with associated benefits for productivity growth.
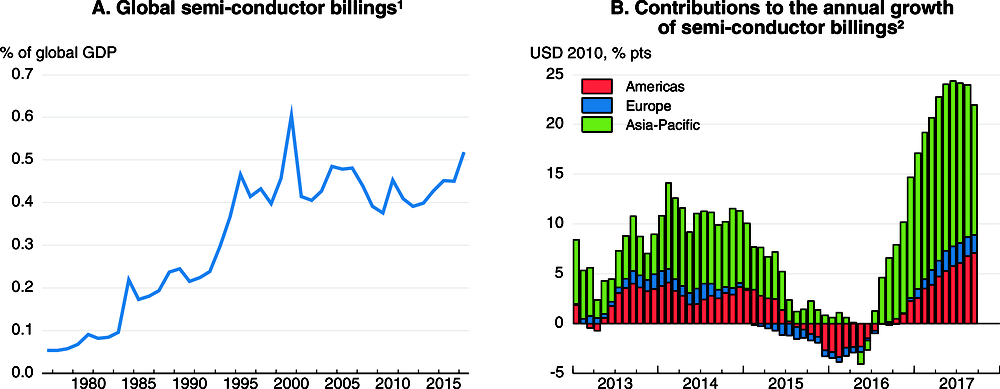
1. Estimate for total semi-conductor billings 2017 based on data up to September. Global GDP is expressed in USD at market exchange rates.
2. Nominal billings in Europe and Asia-Pacific deflated using US semi-conductor import prices. Nominal billings in the Americas deflated by US semiconductor export prices.
Source: World Semi-Conductor Statistics; Bureau of Labor Statistics; and OECD calculations.
Broad structural policy packages, supported by supply-side fiscal measures, would support demand and, even more importantly, improve longer-term growth prospects, thereby helping to catalyse a stronger upturn in business investment (Box 1.1). In particular, a stronger pace of progress towards competition-friendly regulations would help to strengthen product market dynamism and competitive pressures and investment (Döttling et al., 2017). More competitive product markets would raise the prospective rate of return on new investments and provide a better environment to revive the stalled diffusion of innovation between frontier firms and the rest of the economy (Alesina et al., 2005; Gal and Hijzen, 2016; Égert and Gal, 2017). Moves towards more reallocation-friendly insolvency regimes would also reduce resources trapped in “zombie” firms and improve the ability of more productive firms to attract additional capital (Adalet McGowan et al., 2017; Chapter 2). Relatively favourable cyclical conditions provide a propitious opportunity to undertake such reforms, as any potential short-term costs from weaker firms exiting the market are likely to be lower and shorter-lived when demand and job creation are stronger. More could also be done to tackle regulatory divergences in network industries to encourage cross-border investment, especially in Europe (Fournier, 2015).
Renewed structural policy efforts, including further liberalisation of trade and regulation, especially in services, would help to improve the diffusion of new ideas and technologies between firms and across countries and boost total factor productivity (TFP) growth. In turn, this could push the anticipated internal rate of return on investment above current hurdle rates and encourage firms to upgrade their capital stock, and thereby help to sustain the momentum of the current recovery. Technological upgrading that improves capital quality would provide an additional boost to potential output.
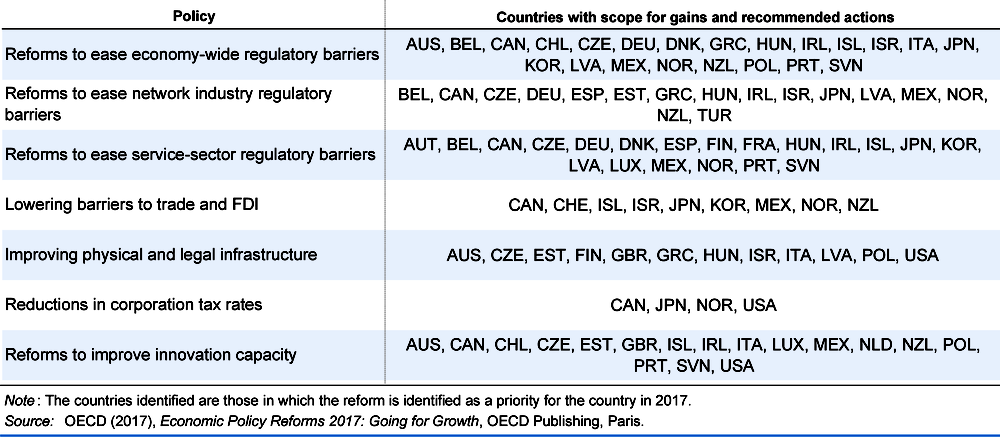
In the OECD as a whole, the annual average contribution of TFP to potential output growth in the decade from 2007 to 2017 was just over 0.2 percentage point weaker than in the pre-crisis decade. Undertaking policies to close this gap would boost output growth in the medium term. Additional easing of regulatory barriers in product markets, reductions of trade restrictions and more open economies, and stronger R&D spending are key policies in this respect (OECD, 2017b; Égert and Gal, 2017; Haugh et al., 2016). Identified policy priorities differ across countries (table below), but frequently include steps to: streamline permits and licenses; improve the transparency of regulation; reduce barriers to entry in network industries, professional services and retail sectors; lower barriers to trade and FDI; and strengthen collaboration between research institutes, universities and industry.
A stylised scenario using the NiGEM global macroeconomic model serves to illustrate the possible short and medium-term growth effects that might be achieved if the rate of technical progress were to be stronger. The scenario considers the effects of raising labour-augmenting technical progress by 0.2 percentage point per annum in all of the advanced economies for five years, beginning in the latter half of 2017, with the 1% higher level of technical progress being maintained permanently thereafter.
There are a number of ways in which an increase of 1% in the level of TFP over five years can be achieved, based on the analysis in Égert and Gal (2017), especially if a collection of reforms are undertaken simultaneously in a number of different policy areas. Alternatively, the increase could be separately obtained from a large reform that raised trade openness by 5 percentage points (which is around twice the increase projected in 2017-19 in the OECD economies compared with 2014-16), or a beneficial two-year reform to product market regulation of a size that is somewhat larger than has been typically observed in the past. A rise in the share of business R&D spending in GDP can also boost TFP, but the effects are comparatively small, with an increase of 0.1 percentage point (which is roughly the difference between spending per annum in the OECD economies in 2014-15 and that in the previous decade) raising TFP by 0.1% after five years.
The NiGEM model simulations are run in forward-looking mode, so that private actors and financial markets start to adjust their behaviour in anticipation of the higher level of output in the future. Monetary and fiscal policies are allowed to remain endogenous.
All told, the positive supply shock would raise OECD GDP growth by around ¼ percentage point per annum over 2018-19, and by a further 0.1 percentage point per annum on average over 2020-23, so that the level of GDP in the OECD economies is 0.9% higher than otherwise by 2023. The output gains are larger in the United States than in the euro area or Japan (figure below), reflecting a more dynamic investment response and a faster response of real wages to the improvement in labour efficiency. Business investment growth is between 1 and 2 percentage points stronger in 2018 in the advanced economies than in the baseline, and by 2023 the capital stock is around 1% higher than the baseline in the United States (and also the United Kingdom and Canada) and around 0.7% above the baseline in Japan and the euro area. Real wages also rise gradually over time, as they adjust towards the higher level of productivity, by 0.1-0.3% relative to baseline in the major advanced economies in 2019 and by 0.5% on average in these economies by 2023, with somewhat stronger effects in the United States than elsewhere. In turn, this helps to strengthen consumer spending. The collective boost to output in the advanced economies also has mild positive spillovers to the EMEs and to world trade. Overall, global GDP growth is boosted by around 0.1 percentage point per annum on average out to 2023, and world trade growth by around 0.2 percentage point per annum over the same period.
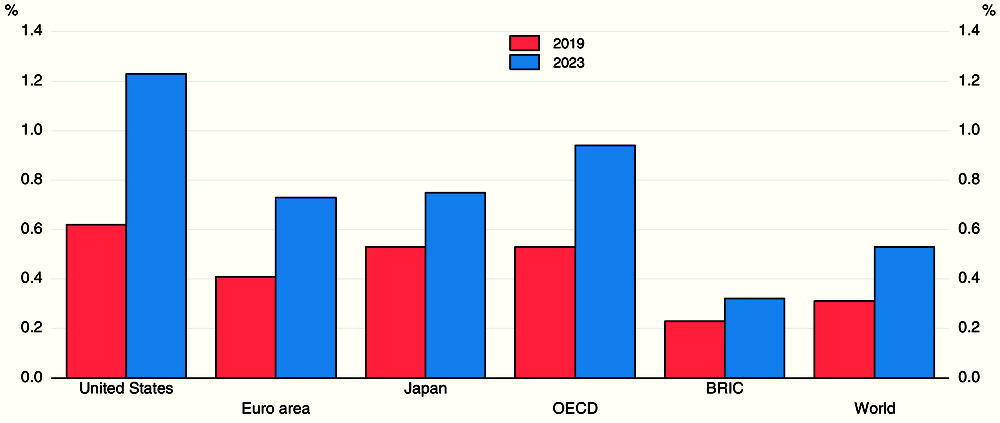
Source: OECD calculations.
The onset of monetary policy normalisation in the major advanced economies might have little direct effect on aggregate incentives to invest in productive assets. Corporate hurdle rates for investment remain well above the cost of capital (Figure 1.10) and the available survey evidence, though limited, suggests that hurdle rates have been high and relatively sticky over time despite underlying fluctuations in the cost of finance (Sharpe and Suarez, 2014; Deloitte, 2014; Norman, 2016).7 This is one reason why business investment has remained weak despite the decline in policy and market interest rates over the past decade. For the same reason, changes in tax rates (which affect the cost of capital) may yield less impetus for investment than theory or historical evidence might suggest. Changes in interest rates and taxes could still have a broader effect on corporate balance sheets by affecting decisions to issue debt and undertake financial transactions, adding to the growing disconnect between debt issuance and investment seen in recent years (Chapter 2).
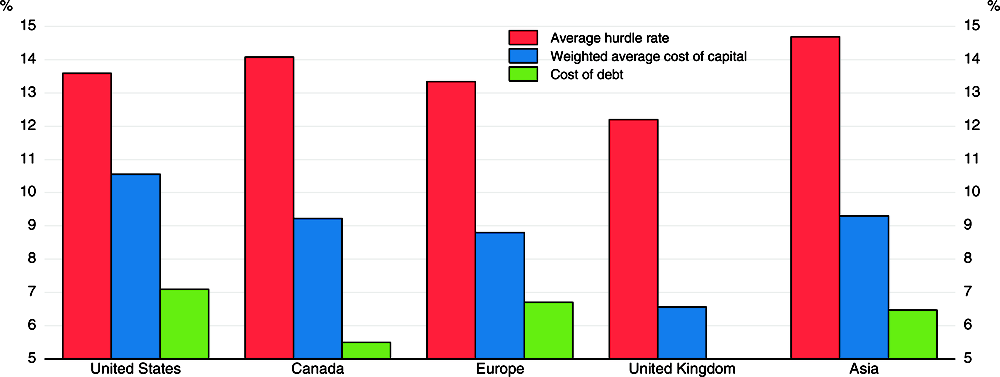
Source: Duke CFO Global Business Outlook Survey, June 2017; and Bank of England Finance and Investment Decisions Survey.
Reforms are needed to improve growth prospects in emerging market economies
A durable strengthening of growth in EMEs is central if global growth is to return to higher long-term norms, given their rising share of global output and trade. However, GDP growth has eased overall in these countries since the 2000s, progress in enacting structural policies has slowed and demographic headwinds are now appearing in some countries. Progress on catch-up in terms of GDP per capita has thus slowed in many EMEs.
In recent years, weaker growth outcomes in the major EMEs were largely accounted for by a gradual moderation of growth in China, and a more substantial slowdown in commodity exporting economies (Figure 1.11, Panel A). Domestic demand was especially weak in many of the latter economies (Figure 1.11, Panel B). Growth in the major EME commodity importers (excluding China) did also ease, but to a much smaller extent. Going forward, as discussed above, growth in the non-China EMEs is now improving, helped by a rebound in Brazil and Russia, two of the major commodity producers, and spillover effects from policy stimulus in China. However, this upturn is set to be moderate by pre-crisis standards, reflecting relatively modest external demand growth and the need for further reforms to strengthen domestic demand.
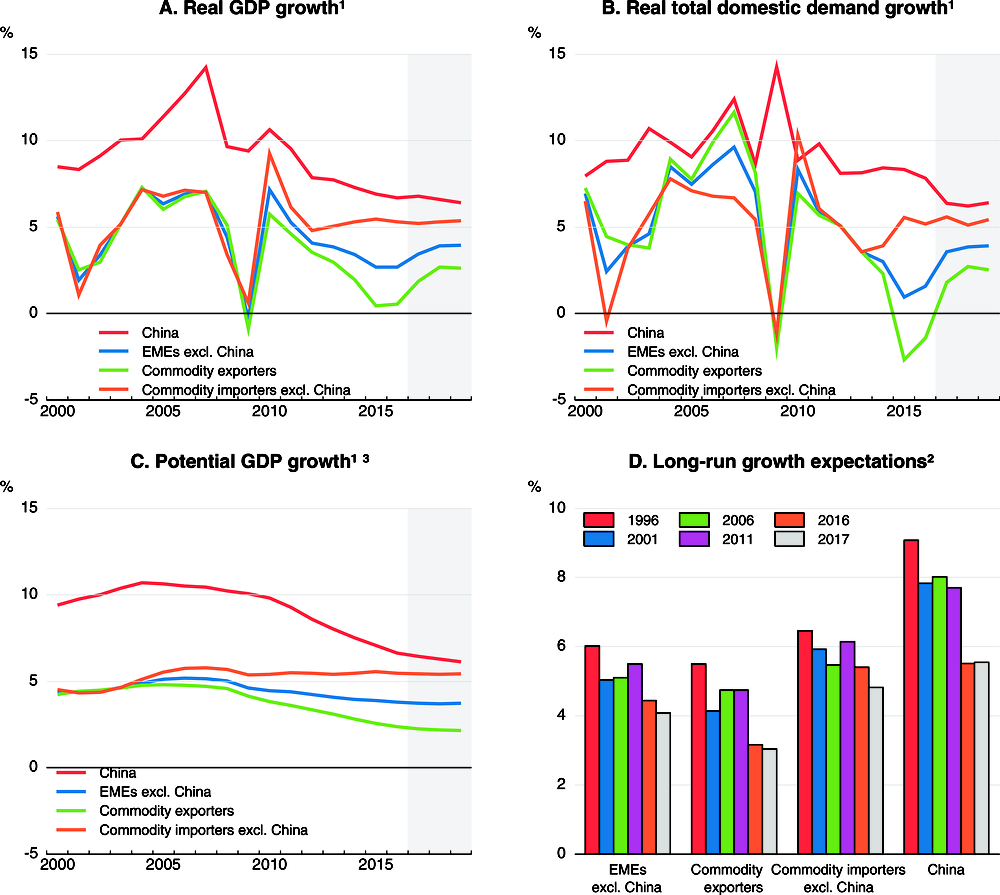
1. Commodity exporters include Argentina, Brazil, Chile, Colombia, Indonesia, Russia, Saudi Arabia, South Africa and other non-OECD oil producers. Commodity importers (ex. China) include India, Mexico, Turkey and the Dynamic Asian Economies (Chinese Taipei, Hong Kong - China, Malaysia, the Philippines, Singapore, Thailand and Vietnam). Emerging markets economies (ex. China) include the countries in the commodity exporters group and commodity importers group. Countries are aggregated based on PPP GDP weights.
2. Average annual GDP growth expected over the following ten years in long-term consensus forecasts from the years shown. Commodity exporters include Argentina, Brazil, Chile, Colombia, Indonesia, Peru, Russia, Ukraine and Venezuela. Commodity importers (ex. China) include Bulgaria, Chinese Taipei, Hong Kong – China, India, Malaysia, Mexico, Philippines, Romania, Singapore, Thailand and Turkey. Countries are aggregated based on PPP GDP weights.
3. Production function based estimates of potential output in Argentina, Brazil, Chile, China, Colombia, India, Indonesia, Mexico, Russia, Turkey and South Africa. HP-filter based estimates of potential output in Saudi Arabia, the Dynamic Asian Economies and other non-OECD oil producers.
Source: OECD Economic Outlook 102 database; Consensus Economics; and OECD calculations.
A risk is that the cyclical rebound in growth outcomes could disappoint if there were to be a sharper slowdown in China than currently projected, given the strong linkages of the smaller Asian economies and commodity exporters with China through global value chains (Figure 1.12). Financial vulnerabilities, such as high debt, currency mismatch between debts and revenues, and rising non-performing loans in some EMEs could also cloud the near-term growth outlook (Chapter 2). Capital flows may also become more volatile if steps to normalise monetary policy in some advanced economies gather pace.
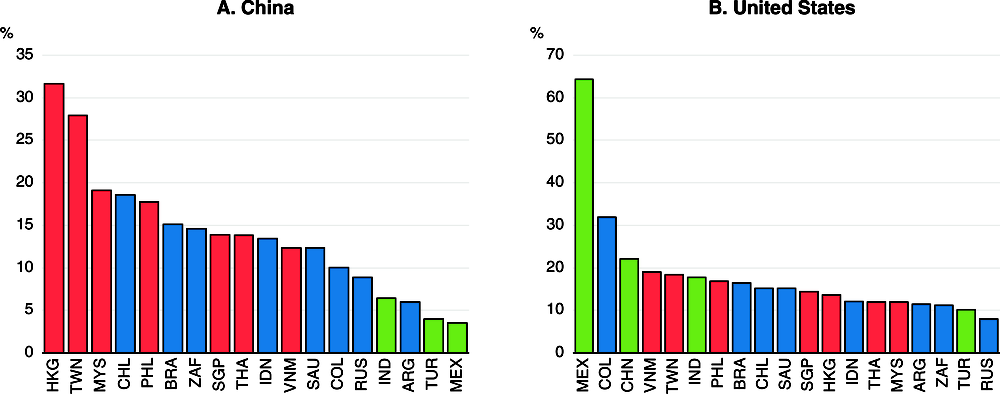
Note: OECD TiVA Nowcast Estimates. Red is for the Dynamic Asian Economies, blue is for the commodity exporters and green for the commodity importers.
Source: OECD calculations.
Further ahead, prospects for stronger output and per capita growth in EMEs will depend on the extent to which supply-side developments improve and, in particular, on whether investment and productivity growth can strengthen sufficiently to outweigh demographic headwinds in some countries and a further moderation of growth in China. In the EMEs as a whole, estimates of underlying growth potential have declined over the past decade, especially in China and many commodity exporters (Figure 1.11, Panel C). Excluding China, potential output growth for the commodity importing EMEs has remained broadly unchanged. An underlying slowdown is also reflected in the steady decline in long-term consensus expectations of average annual growth over the next decade in the EMEs (Figure 1.11, Panel D), likely damping incentives to invest.8 Key factors behind the slowdown in potential growth include:
-
The contribution from capital per worker in the commodity exporters has been particularly soft in recent years (Figure 1.13; World Bank, 2017). Despite their recent rises, most commodity prices remain well below their peaks in 2008 and 2011-14, holding back capital spending (Deutsche Bundesbank, 2015). In China, investment remains a key factor underpinning growth (OECD, 2017d), but its pace has moderated, partly reflecting necessary adjustments to reduce over-capacity in some sectors.
-
Total factor productivity (TFP) growth has also slowed, especially in the commodity exporters and China, partly due to weaker investment and trade growth since the crisis. However, TFP growth has held up relatively well in the other major commodity importers. In part this reflects a stronger pace of structural reforms in India since 2014 (OECD, 2017e), and major growth-enhancing reforms in Mexico (OECD, 2017f).
-
Demographic developments in some EMEs have become less favourable, especially in China and, to lesser extent, in many commodity exporters.
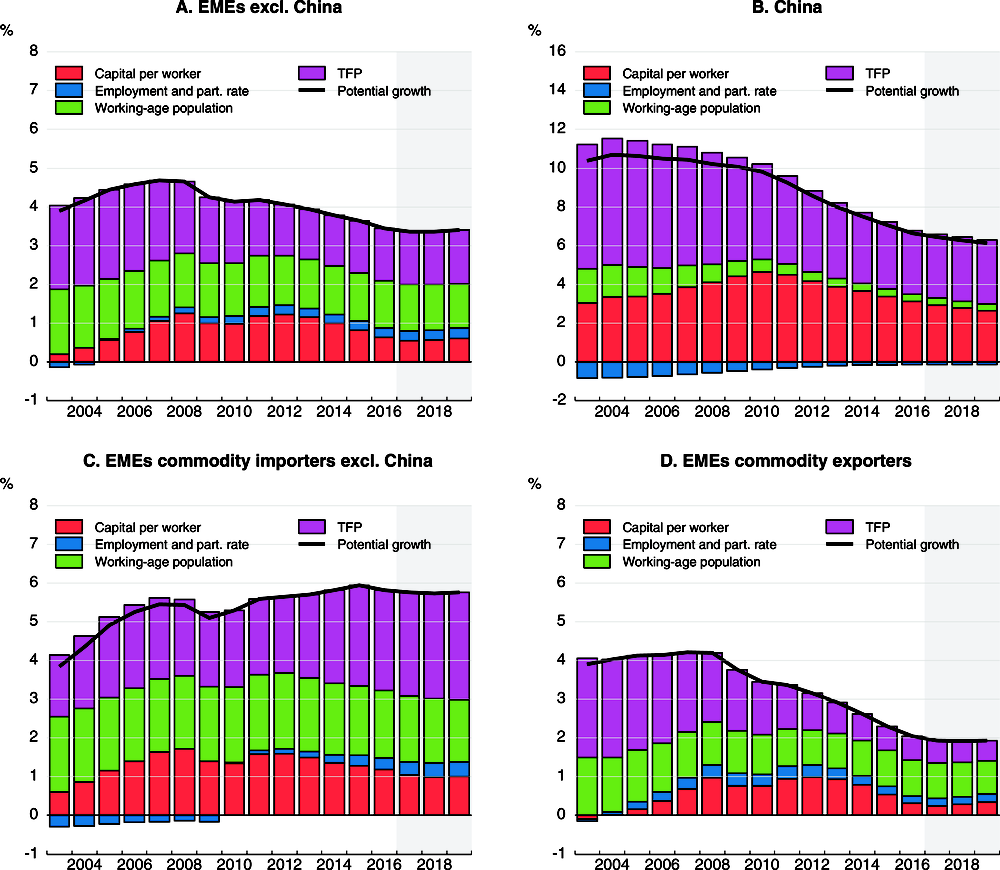
Note: Contributions to potential output growth are expressed in percentage points. Commodity exporters include Argentina, Brazil, Chile, Colombia, Indonesia, Russia and South Africa. Commodity importers (ex. China) include India, Mexico and Turkey. Countries are aggregated based on PPP GDP weights.
Source: OECD Economic Outlook 102 database; and OECD calculations.
Stepping up the pace of structural policies to boost productivity growth, including through more competition-friendly regulations and efforts to raise labour utilisation rates, is essential to improve medium-term growth prospects in the EMEs and to provide avenues to tackle challenges of inclusiveness. In recent years, progress in enacting structural reforms has slowed in many EMEs based on OECD indicators, especially for policies aimed at boosting labour productivity (OECD, 2017b; Figure 1.14). Other measures of regulatory performance, such as the World Bank Doing Business survey, suggest that regulatory quality relative to frontier countries has remained largely unchanged in most EMEs since 2014 (Figure 1.14, Panel B). Lowering barriers to foreign trade, investment and firm entry, and reducing the state control of businesses would improve the efficiency of capital allocation and boost job growth. Further, these kinds of regulations bear most heavily on SMEs which are a key source of job creation (OECD, 2017g). Measures to boost investment directly by tackling structural bottlenecks and expanding public investment in infrastructure and human capital, where fiscal space exists, would also support stronger underlying growth. Addressing potential financial vulnerabilities and improving risk-management practices could also strengthen resilience in many EMEs, providing a more stable environment to foster long-term investments (Chapter 2). Deeper capital markets would also improve the efficiency of capital allocation and support job growth.
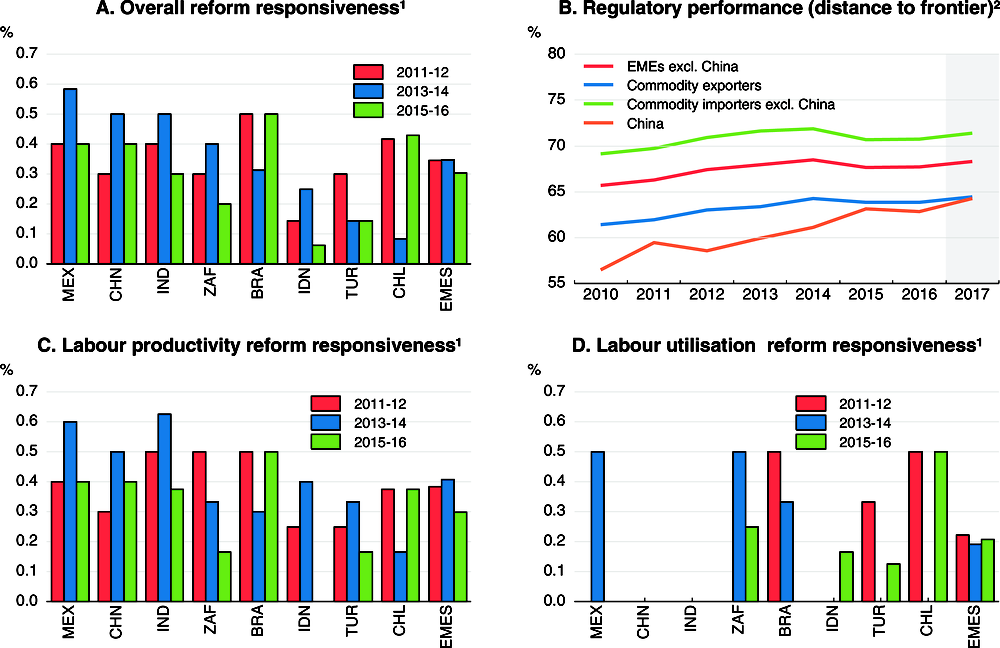
1. Responsiveness to OECD Going for Growth recommendations across EMEs. The EME aggregate is the simple average of EMEs shown in the chart.
2. Commodity exporters include Argentina, Brazil, Chile, Colombia, Indonesia, Russia, Saudi Arabia and South Africa. Commodity importers (ex. China) include Chinese Taipei, Hong Kong – China, India, Malaysia, Mexico, Philippines, Singapore, Thailand, Turkey and Vietnam. Aggregates are based on simple averages.
Source: OECD (2017), Economic Policy Reforms 2017, Going for Growth, OECD Publishing, Paris; World Bank Doing Business database; and OECD calculations.
Inflation pressures are projected to be moderate
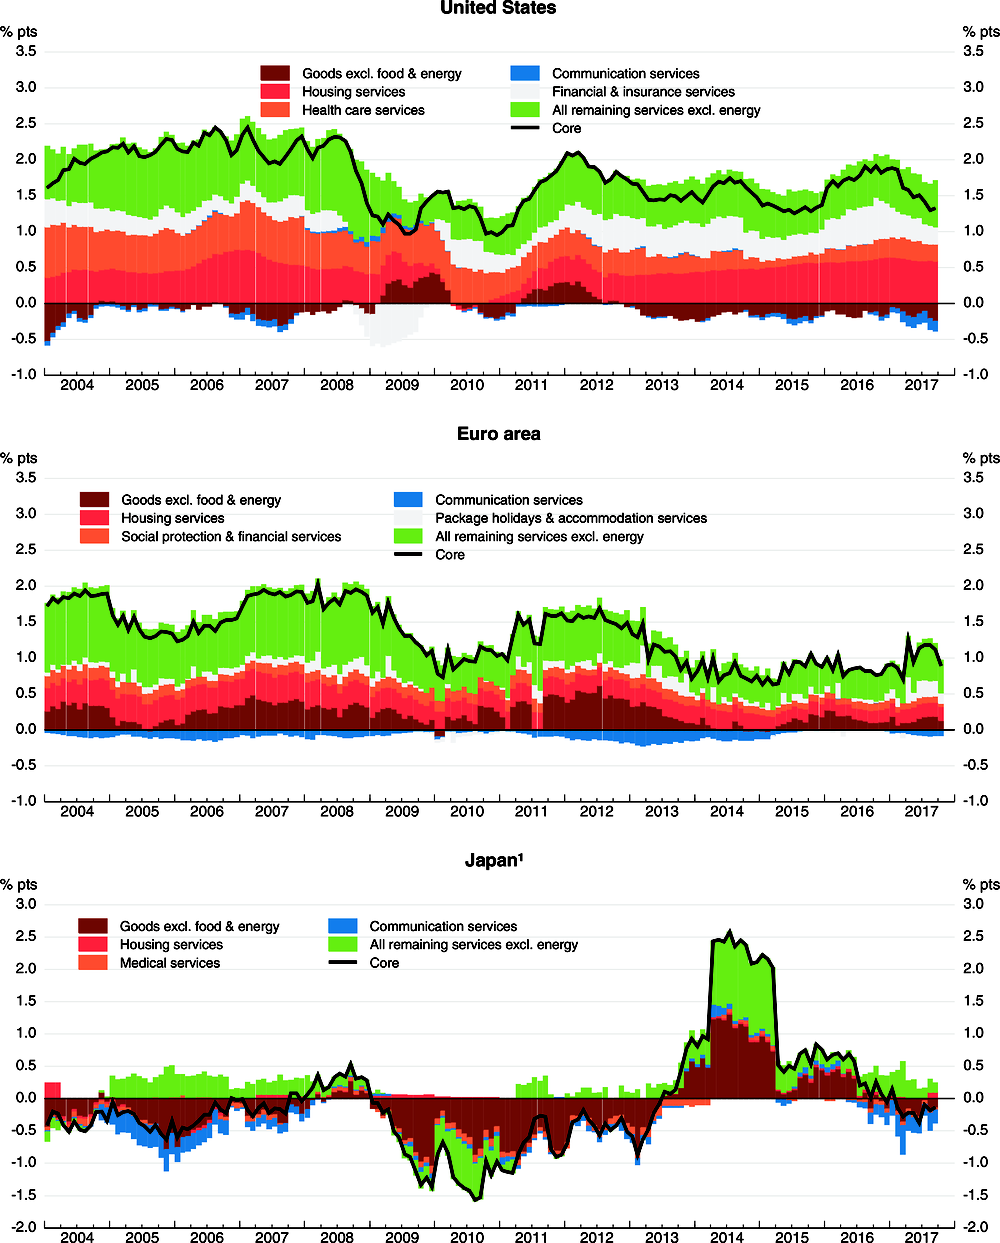
Headline consumer price inflation eased in mid-2017 in most major advanced and emerging market economies, helped by the moderation in energy prices (Figure 1.15). Meanwhile, underlying inflation across the advanced economies is currently subdued in aggregate despite the broad-based cyclical upturn and the continued absorption of slack. Apart from sluggish wage growth (discussed below), this leaves puzzles about the extent of spare capacity, and the possible extent to which global or particular domestic factors are helping to constrain inflationary pressures in the advanced economies (Figure 1.16):
-
International and domestic competition and technological progress are holding down prices of goods excluding energy and food, with falling price levels in the United States and Japan and very muted increases in the euro area, and some services (Auer and Fischer, 2010). These developments are also particularly notable in communication services, with the persistent negative contributions of communication prices having recently intensified in the main OECD areas.
-
Inflation expectations may have been weakened by the long period of low inflation in the past. In particular in Japan, continued core price inflation at around zero possibly reflects backward-looking inflation expectations of producers. Moreover, in several European economies, the mode of the distribution of price changes for disaggregated core inflation components has started to shift to the left since 2014-15 and become somewhat less dispersed compared to the pre-crisis period, possibly suggesting a convergence of price setting behaviour around a low level of inflation (Figure 1.17).9
-
Country-specific factors are also pushing down inflation in the main advanced economies. The particularly striking recent moderation of inflation in the United States has been driven by the declining contribution of prices of financial services and low price increases in healthcare services, with the latter reflecting longer-term changes in regulation (Lorenzoni et al., 2017). In the euro area, although services price inflation has strengthened recently (largely due to one-off changes in prices related to tourism), it remains below pre-crisis levels, reflecting weaker dynamics of prices of services related to housing and a number of diverse categories of services.
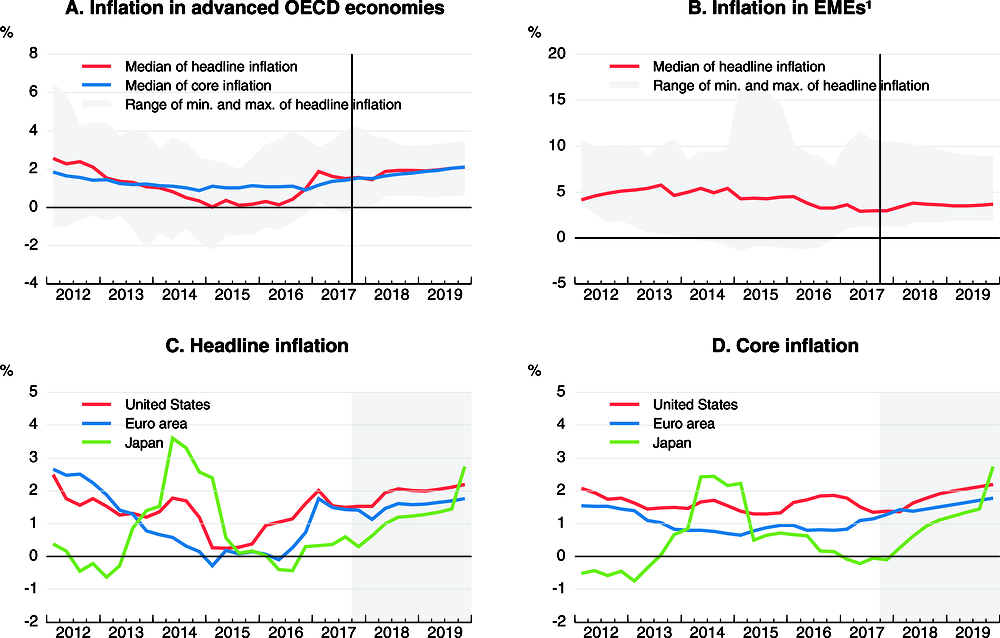
Note: Inflation is based on the harmonised consumer price index for the euro area countries and the United Kingdom, on the national headline consumer price series for Canada and Japan and the EMEs, and on the personal consumption deflator for the United States. Inflation rates in Japan in 2014 and 2019Q4 are affected by the realised and expected increase in the consumption tax rate. Core inflation excludes prices of food and energy.
1. EMEs include Brazil, China, Costa Rica, Hungary, India, Indonesia, Mexico, Poland, Russia, South Africa and Turkey.
Source: OECD Economic Outlook 102 database; and OECD calculations.
1. Core inflation differs from the domestic definition and it excludes prices of energy and food. The spike in core inflation in Japan in 2014 is due the increase in the consumption tax rate.
Source: Ministry of Internal Affairs and Communications, Japan; Bureau of Economic Analysis; Eurostat; and OECD calculations.
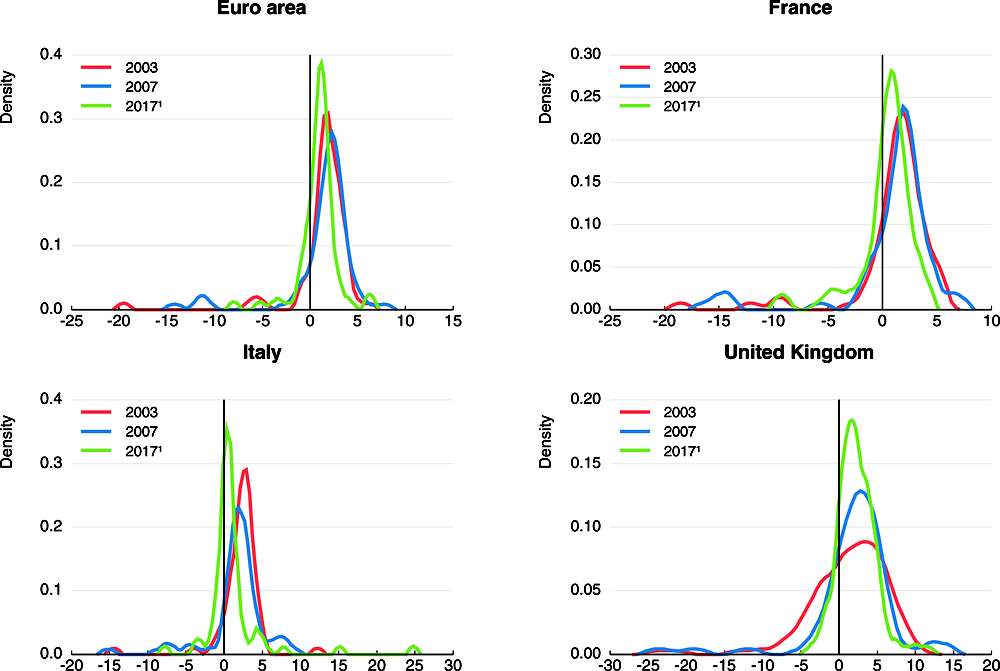
Note: Estimated distributions for price changes of core inflation components, i.e. excluding prices of food and energy, at 4-digit level of disaggregation at annual frequency.
1. 2017 figures are computed as the average changes from January to October 2017.
Source: Eurostat; and OECD calculations.
In the large EMEs, inflation has generally eased this year, particularly in Brazil and Russia helped by past currency appreciation. In India, headline CPI inflation has also dipped below target, reflecting in part transitory factors including demonetisation, a good monsoon, large rebates before the rollout of the Goods and Services Tax and a strong rupee.
Median inflation in the advanced economies is projected to rise slightly to just below 2% by end-2019, increasing above the inflation objective in the United States but still remaining below target in the euro area and Japan (Figure 1.15).10 Headline inflation will be driven by the recent increase in oil prices in the short term and then by somewhat stronger wage cost pressures stemming from improvements in the labour markets, although such wage pressure has been mostly modest so far. The rise in price inflation is consistent with the recent strengthening of corporate expectations about selling prices in the main OECD areas (Figure 1.18). However, inflation projections are subject to a high degree of uncertainty, given the tenuous relationship between prices and measures of economic slack, and the over-predictions of inflation in the past two years.11 In most EMEs, assuming unchanged exchange rates, inflation is expected to stabilise at low levels, reflecting the dissipation of recent price shocks and better-anchored inflation expectations. However, if monetary policy in advanced countries is normalised faster than projected, the ensuing depreciation of EMEs' currencies, unless there is complementary domestic policy tightening, could add to inflationary pressures.
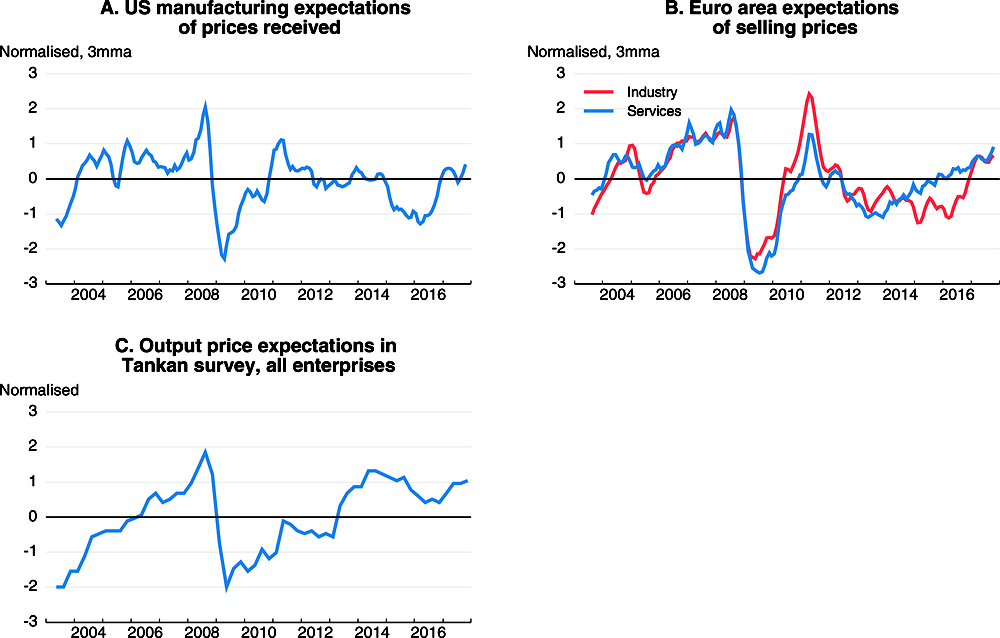
Note: 3mma stands for 3-month moving average.
Source: US Federal Reserve; European Commission; Bank of Japan; and OECD calculations.
Labour market outcomes remain uneven
Labour market performance continues to improve in the advanced economies but remains uneven. Employment and labour force participation rates in many countries are now above the levels prior to the crisis (Figure 1.19), helped by reforms that have raised activation, reduced pathways to early retirement, enhanced job creation and lowered barriers to female labour force participation. Outcomes in the United States are a notable exception amongst the major advanced economies, possibly associated in part with an increased incidence of poor health and disability, including rising opioid prescriptions (Krueger, 2017). In the OECD economies as a whole, the employment rates of older workers (aged 55 and above) have risen sharply, but prime-age and youth employment rates are only at, or still below, their immediate pre-crisis levels.12
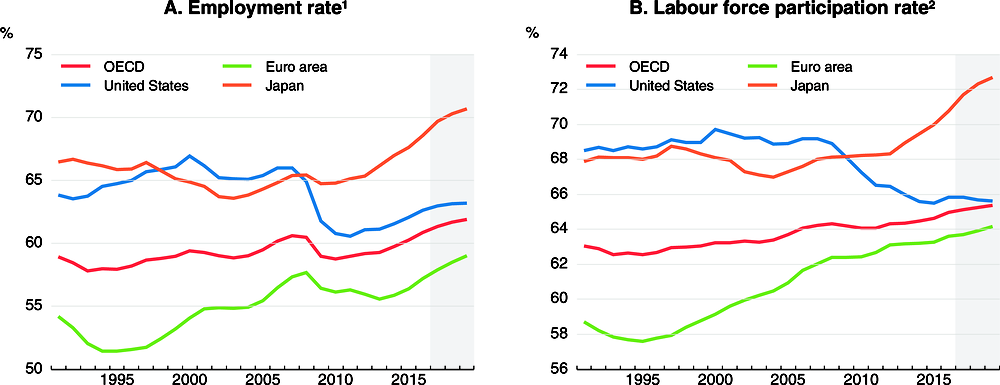
1. Employment as a percentage of the population aged 15-74.
2. Labour force as a percentage of the population aged 15-74.
Source: OECD Economic Outlook 102 database; and OECD calculations.
Wage growth also remains modest in most major economies, despite higher employment rates and lower unemployment (Figure 1.20, Panel A). In the OECD economies overall, real wage growth is projected to remain moderate over 2017-19, at just over 0.6% per annum on average, up from 0.4% per annum on average in 2014-16 (Figure 1.20, Panel B).13 This has contributed to popular dissatisfaction with economic performance, with many households having seen little growth in disposable incomes over the past decade, particularly at the lower end of the income distribution. In part, weak nominal wage growth can be accounted for by soft productivity growth and low inflation. Conventional headline measures of unemployment may also understate the extent of remaining cyclical slack in OECD labour markets (Cœuré, 2017; OECD, 2017c). Many countries still have a high rate of involuntary part-time work compared with the pre-crisis decade, implying that there is some scope to increase hours worked as demand strengthens.14 In the OECD as a whole, the involuntary part-time rate in 2016 remained over 1 percentage point higher than in the pre-crisis decade, with a significantly larger gap in a number of European countries. There are also a comparatively high number of people only marginally attached to the labour market, but who might also return to the labour force if growth and job creation were to strengthen further.
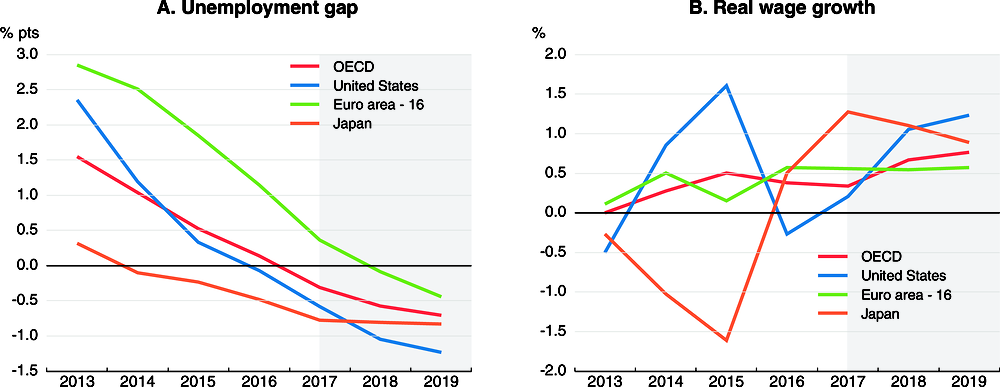
Note: The unemployment gap is the difference between the unemployment rate (national definition) and the estimated structural unemployment rate. Nominal wages are measured as labour compensation per employee. Real wages are measured as nominal wages adjusted for the GDP deflator.
Source: OECD Economic Outlook 102 database.
Compositional effects from factors such as the increasing share of part-time jobs, rising female labour force participation and growing employment in low-wage service sectors may also have affected economy-wide wage growth in recent years (Broadbent, 2015; Daly and Hobijn, 2017). Across the OECD economies, the share of part-time employment in total employment rose by 2¾ percentage points over the period from 2000 to 2016.15 In the same period, the share of women in total employment rose by 2 percentage points, with around two-thirds of the increase accounted for by female part-time employment.
An illustrative estimate of the impact of such compositional changes on economy-wide average pay growth over an extended period (averaging across all types of workers) can be obtained by breaking down changes in pay into the separate impacts from pay changes for each type of employment (full-time and part-time for men and women) and changes in the incidence of each type of employment at group-specific pay levels. The difference between the observed overall change in aggregate earnings and the sum of the pay changes for each category of employment provides an estimate of the net direct impact of compositional changes in employment (Figure 1.21).
-
There are substantial absolute shifts in some European countries from compositional changes, especially from a lower incidence of full-time male employment.16
-
However, the aggregate net direct impact of compositional changes on average pay of all workers over time appears to be relatively moderate, despite differences in the hourly pay rates of workers by gender and employment status.17 The net estimates imply that compositional effects reduced the growth of average hourly (or weekly) pay in the aggregate euro area and the United States by around 0.1% per annum on average over the period shown.18 The effects in a number of individual euro area countries were larger, at around 0.2% per annum on average, reflecting larger declines in the share of male workers in full-time employment.
-
Related estimates for Japan, where compositional changes in the structure of employment have been relatively large and aggregate pay growth has been relatively weak, suggest that the rise in the number of part-time employees may have held down the growth of scheduled cash earnings by around ¼ percentage point per annum over 2015-16, and by between ½ and ¾ percentage point per annum over 2012-14 (Bank of Japan, 2017).
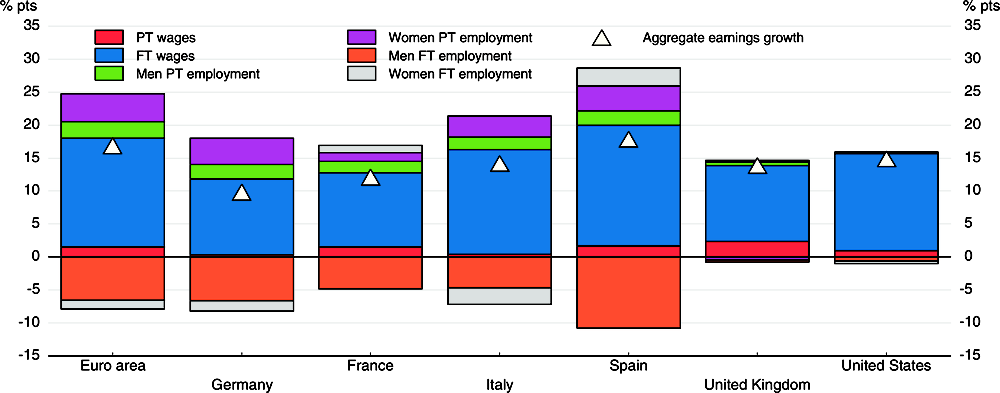
Note: FT and PT refer to full-time and part-time respectively. The reference wage measure is average hourly pay in all EU economies and median weekly earnings in the United States. The EU data exclude public administration and enterprises with less than ten employees.
Source: Eurostat, Structure of Earnings Survey; Bureau of Labor Statistics, Current Population Survey; and OECD calculations.
Financial conditions remain accommodative but risks of sudden tightening persist
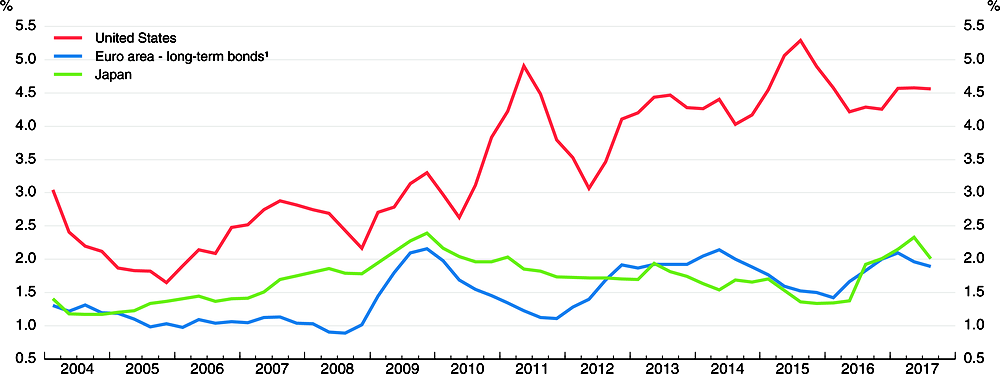
In many advanced economies, long-term government bond yields have remained low since early May (when the assumptions for the last OECD Economic Outlook were set) (Figure 1.22). In several European economies and Japan, between half and three-quarters of government bonds still trade at negative yields. Continued low bond yields seem to reflect investors’ expectations that policy interest rates will remain very low and that term premia for government bonds will continue to be compressed in coming years. But this could change as the normalisation of monetary policy advances, prompting investors to adjust their expectations.19 Moreover, as central banks become net sellers of government bonds, sovereign premia could also increase. In the euro area, long-term interest rates currently better reflect differences in government indebtedness than did spreads prior to the crisis, but sovereign premia could increase further in countries with high debt once the ECB stops government bond purchases (Figure 1.23).
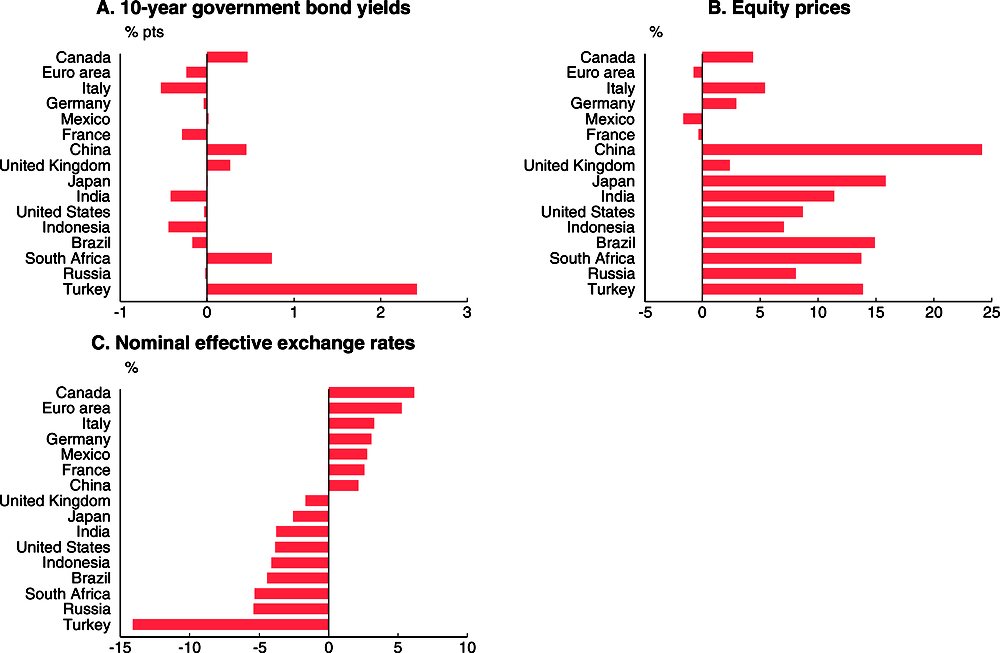
Note: Changes between 4 May and 23 November 2017. An increase in the nominal effective exchange rate implies its appreciation.
Source: Thomson Reuters; OECD Exchange rate database; and OECD calculations.
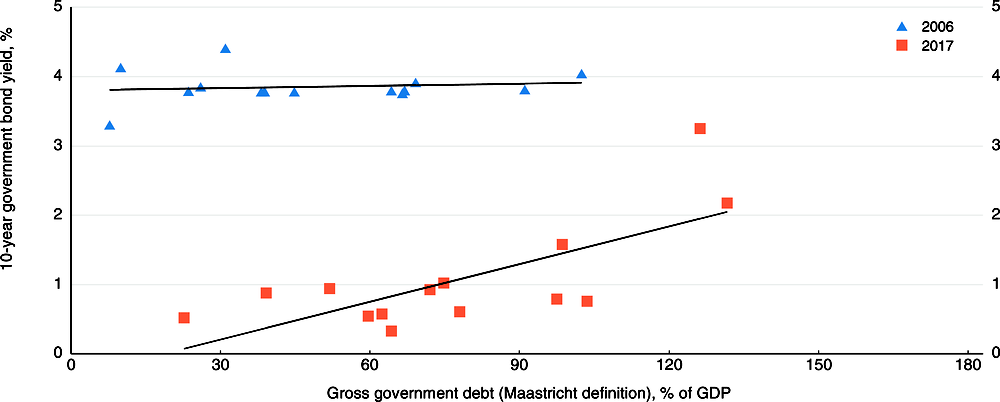
Note: Only OECD euro area member countries, excluding Greece. Government bond yields are annual averages. 2017 numbers refer to the OECD projections.
Source: OECD Economic Outlook 102 database.
Equity prices have risen in the main advanced economies, in several cases to post-crisis highs, helped by the broad-based upswing in global growth, higher corporate profits and, in some countries, weaker currencies against the background of still low interest rates and sustained risk-taking (Figures 1.22 and 1.24). However, the “improvement’’ may also reflect vulnerability. In the United States and the euro area, price-to-earnings ratios exceed historical averages, pointing to a potential overvaluation and risks of a future correction. Moreover, in the United States, perceived risks of a large decline in the S&P 500 index, as measured by the SKEW index, have risen.
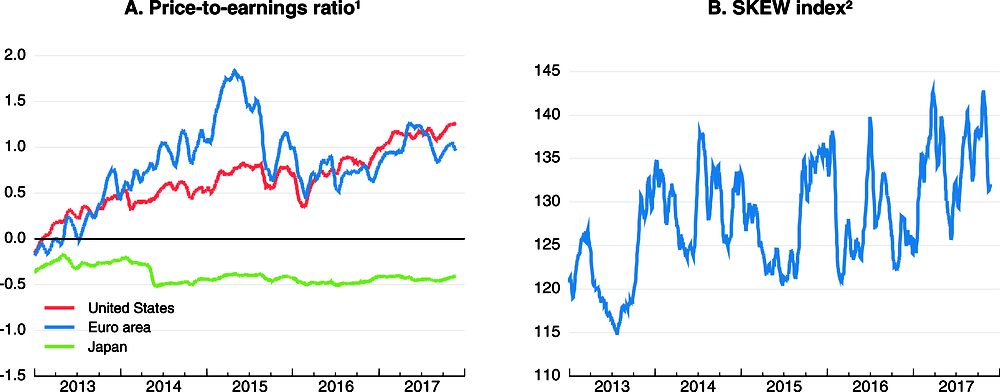
1. Normalised values based on as long as possible historical averages expressed in standard deviations.
2. The Chicago Board Options Exchange (CBOE) SKEW is an option-based measure of the perceived risk of 30-day ahead large (two or more standard deviations) changes in returns of the S&P500. Numbers above 100 indicate a negative skew in the distribution (i.e. negative tail risk). Since the standard deviation varies over time, so does the size of expected equity price declines.
Source: Thomson Reuters; and OECD calculations.
Strong risk appetite is also evident in corporate bond markets in the euro area and the United States,20 with spreads between high-yield corporate and government bond yields remaining at levels close to recent lows in 2014, despite their recent pick-up (Figure 1.25), and bond issuance remaining high (Figure 1.26). In the United States, non-financial corporations have issued more than USD 0.7 trillion of bonds so far this year, and 2017 is likely to be a third consecutive year of around USD 0.8 trillion (4.5% of GDP) issuance. Moreover, there has been a further decline in the quality of covenants that protect the interests of holders of non-investment-graded bonds, including in the United States.21 The share of non-investment-graded bonds in total corporate bond issuance has also been rising since the financial crisis (Chapter 2).
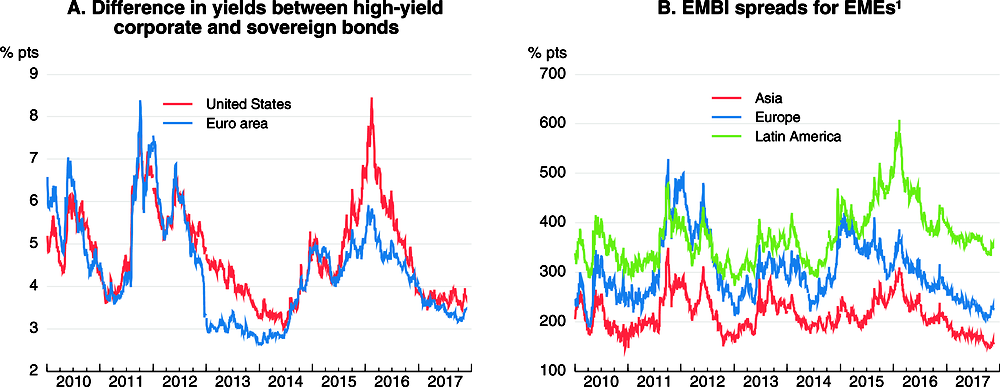
1. EMBI stands for J.P. Morgan Emerging Market Bond Index.
Source: Thomson Reuters; and OECD calculations.
1. Long-term bonds refer to bonds maturing in more than one year.
Source: OECD Economic Outlook 102 database; US Federal Reserve; ECB; Japan Securities Dealers Association; and OECD calculations.
Measures of implied volatility have declined to very low levels and indicators of systemic stress remain subdued, but they may underestimate risks (Figure 1.27). Current low levels of volatility indices are broadly in line with the low perceived uncertainty of future economic growth, especially in the United States, suggesting perceptions of unusually low risks in financial markets and the real economy (Figure 1.28). Financial market volatility indices, however, tend to be strongly affected by actual volatility and are not necessarily good predictors of future volatility. Prolonged low volatility, together with a low and flat yield curve, tends to induce higher risk-taking and thus make the financial system more fragile (OFR, 2017). Riskier exposures could be encouraged through lowering asset-return correlations, enticing investors to diversify investments by buying riskier assets, and risk management practices based on Value-at-Risk or volatility control.22 Such pro-cyclical strategies could amplify asset price corrections and volatility if market sentiment suddenly changes.
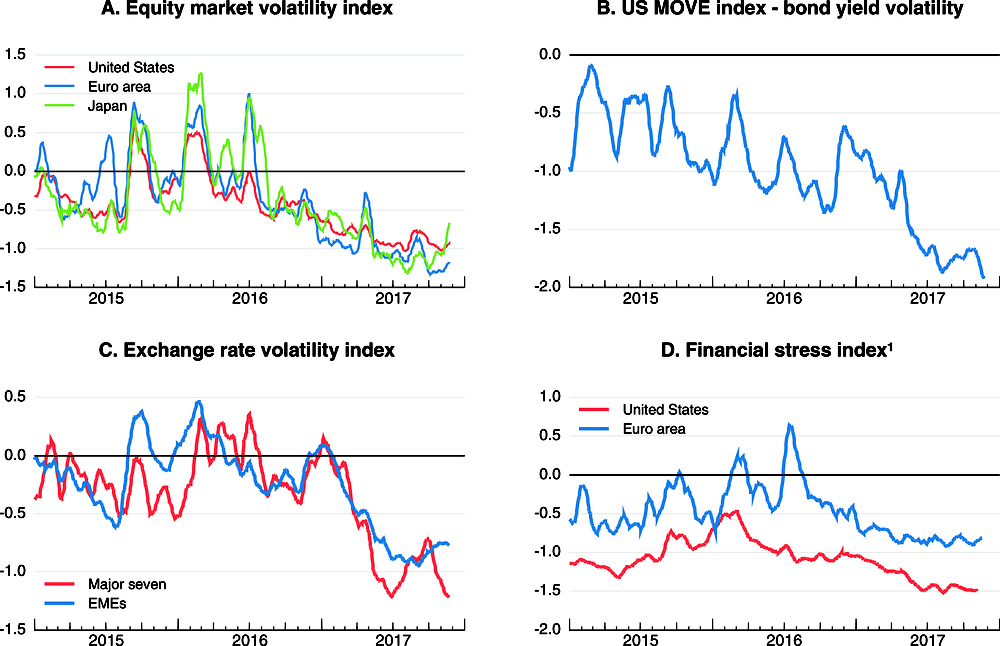
Note: The equity market volatility indices measure an expected symmetric range of movements in the main equity indices over next 30 days. They are derived from options. The Merrill Lynch Option Volatility Estimate (MOVE) index and exchange rate volatility index are equivalents of the equity market volatility index for US Treasuries and exchange rates, respectively.
1. The financial stress index is the Composite Indicator of Systemic Stress for the euro area and the St. Louis Fed Financial Stress Index for the United States. Lower values of the indices imply less financial stress.
Source: Thomson Reuters; and OECD calculations.
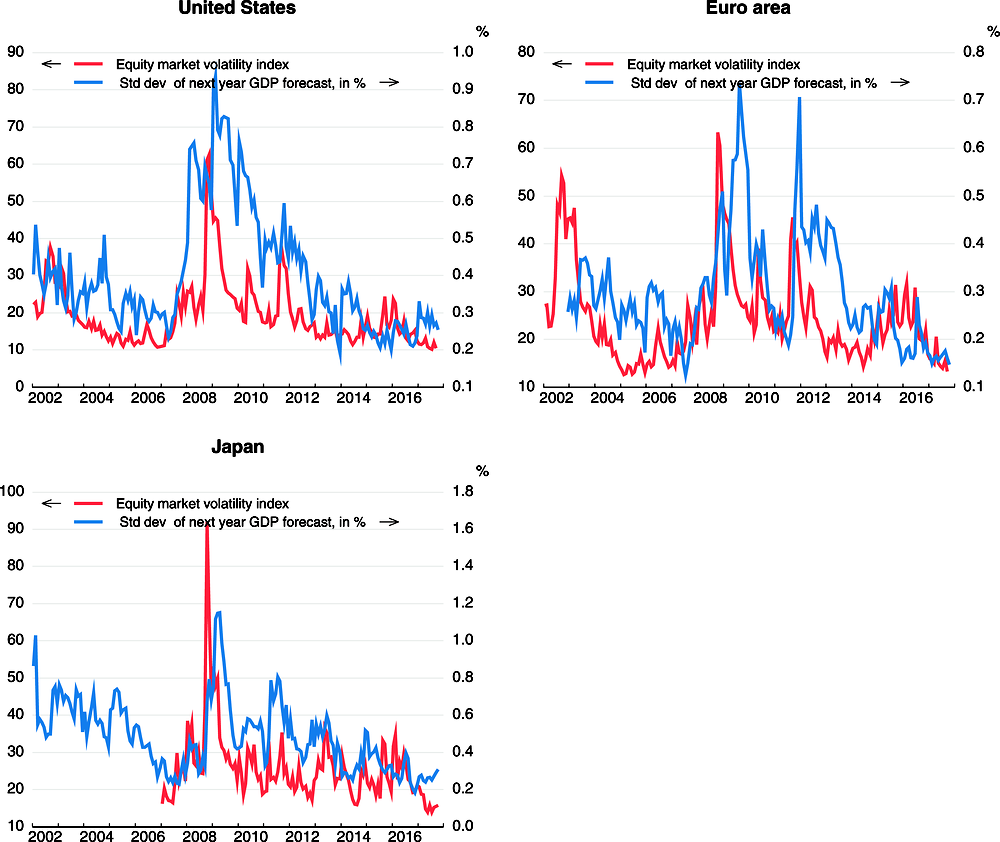
Note: “Std dev” stands for standard deviation.
Source: CBOE; Consensus Economics; and OECD calculations.
Turbulence in equity markets may also be accentuated by increased index-linked trading, used in particular by exchange-traded funds (ETFs). The assets under management of ETFs have grown by 27% since the beginning of 2017 and have reached USD 4.3 trillion globally (ETFGI, 2017), representing more than 5% of global market capitalisation. The nature of ETFs, namely low transaction costs and high intraday liquidity, has attracted investors to invest in such funds instead of the underlying assets. However, when the underlying assets are less liquid than the ETFs, the funds can amplify market volatility. Similarly, volatility could be heightened by investors in ETFs that are driven by short-term returns. Demand from such investors usually evaporates during market turmoil (Cella et al., 2013) and equity prices of companies included in the same index tend to be strongly correlated during market turmoil (Da and Shive, 2014).
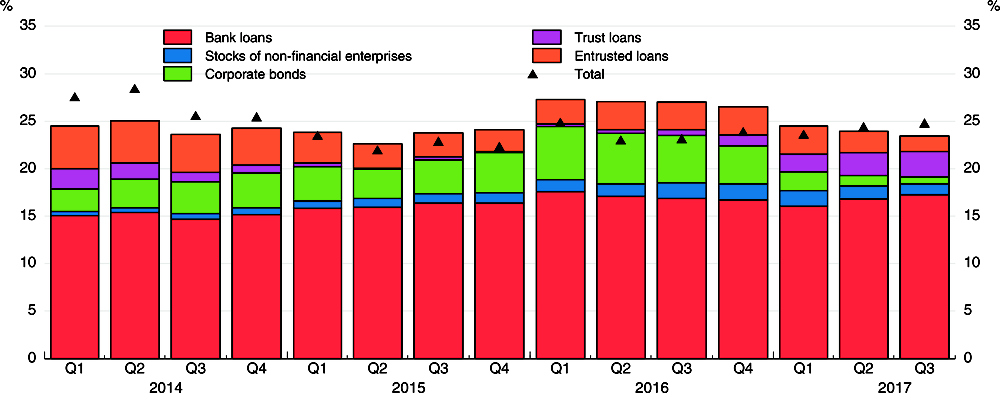
Financial conditions have tightened in China but eased in other large EMEs amid continued risk-taking. In China, this primarily resulted from macro-prudential and deleveraging measures, targeting in particular the shadow banking system. Nevertheless, total social financing flows in relation to GDP have remained robust (Figure 1.29). In many other EMEs, equity prices have increased and currencies have depreciated (Figure 1.22). Moreover, in some economies, the monetary policy stance has been eased and longer-term interest rates have declined, especially in India and Indonesia (Figure 1.22). Sovereign bond yield spreads vis-à-vis US Treasuries have declined to or below the levels last seen in 2014 in Asian and European EMEs (Figure 1.25). Capital is reported to have continued to flow into EMEs at a similar pace as in 2016, following short-lived capital outflows at the turn of the year. The increased risk tolerance of global investors has also allowed sub-prime sovereigns to issue debt at favourable rates. However, EMEs continue to be exposed to vulnerabilities, relating to recent rapid credit growth, especially in China, the exchange rate exposures of non-financial corporations and shifts in investors' sentiment (OECD, 2017c; Chapter 2).
Source: OECD Economic Outlook 102 database; Thomson Reuters; and OECD calculations.
Policy measures need to catalyse a private sector response
In advanced economies, the firming and broadening recovery and financial stability risks call for a gradual normalisation of monetary policy, but to a varying degree across the main areas. This should be accompanied by further rebalancing of the policy mix towards fiscal policy changes and structural policy packages that strengthen potential output, building on the welcome initiatives taken in a number of countries in the past year. The monetary policy normalisation process will need to be calibrated against the financial market response, realised and expected inflation, and the need to support growth. Fiscal policy easing in 2018 should be implemented as planned, but with an increased focus on measures that enhance support for long-term supply potential and inclusive growth. A more active use of structural measures is necessary to create the environment in which business investment will strengthen to promote productivity growth, and thus the growth of real wages. Improved potential output is essential to underpin fiscal sustainability and living standards in the longer term. EMEs should adjust macroeconomic policies in line with macroeconomic developments, address vulnerabilities related to the build-up in private sector indebtedness in view of prospective tighter financial conditions in advanced economies (Chapter 2), and buttress the structural underpinnings of longer-term growth. In all countries, measures are required to ensure that the benefits of economic growth are more equally distributed within societies.
Monetary policy should be data driven, considering real, financial and price dynamics
Monetary authorities in the main advanced economies face the challenge of calibrating policy stances against a backdrop of stronger near-term growth momentum and narrowing economic slack, but not yet sufficiently strong inflationary pressures, insufficient improvement in supply-side potential, and still-high political and economic risks. Uncertainty about inflation dynamics and financial market developments calls for a multiple indicator, data-driven strategy for normalising monetary policy. Identifying and explaining the reasons for recently-subdued inflation rates will be key for central banks' decisions and communication. If inflation is currently held down by forces which are beyond the control of national central banks (like positive technological shocks, regulation or global forces), it would in principle justify a delayed and slower withdrawal of monetary policy stimulus than otherwise. However, given the already lengthy period of a very expansionary monetary policy stance, this could aggravate mispricing of asset prices and may not be warranted. In such a case, some undershooting of inflation targets may have to be tolerated but should be clearly communicated as being related to exceptional circumstances. By the same token, should inflation rise if non-linearities in the relationship between labour markets, prices and wages emerge, an over-shooting of the inflation objective should not engender a sharp response.
The large balance sheets of key central banks, following years of quantitative easing, raise questions about the sequencing of decisions regarding central bank assets and policy interest rates. The US Federal Reserve, after having stopped net asset purchases at end-2014, has raised the policy rate gradually by 100 basis points since December 2015 and initiated a plan to gradually scale back reinvestments of maturing securities in a predictable way.23 This strategy has advantages and so far has not led to market disruptions. Effects of asset reductions on financial conditions are likely to be more uncertain than those of policy rate changes, if for no other reason that central banks have greater experience with using policy rates (Bernanke, 2017). It would also be easier to reverse any rise in policy rates, compared with an asset reduction, if growth were to moderate too quickly. The US normalisation strategy may serve as a blueprint for the ECB and the Bank of Japan,24 which are still increasing assets held, though they may decide on different modalities to reflect area-specific circumstances.
The normalisation of monetary policy raises questions also about the ultimate size of balance sheets and instrument use in the future (Inaba et al., 2015; Box 1.2). The authorities can opt either for returning to the pre-crisis practice of controlling overnight interest rates with small balance sheets or for using the interest rate on banks' reserves at the central bank as a floor for market rates with large balance sheets, as in recent years. The floor framework would require a calibration of the optimal size of balance sheets, which is challenging given the lack of clear criteria.
Given extraordinary monetary policy stimulus in the aftermath of the 2008 financial crisis, the size of major central banks’ balance sheets and their composition have changed significantly (figure below). In the process of policy normalisation, the balance sheets are likely to be reduced but their ultimate size will depend primarily on the type of the future operational framework. The size of balance sheets will also be affected by the demand for banknotes. This box discusses different operational frameworks and the possible evolution of public demand for banknotes.
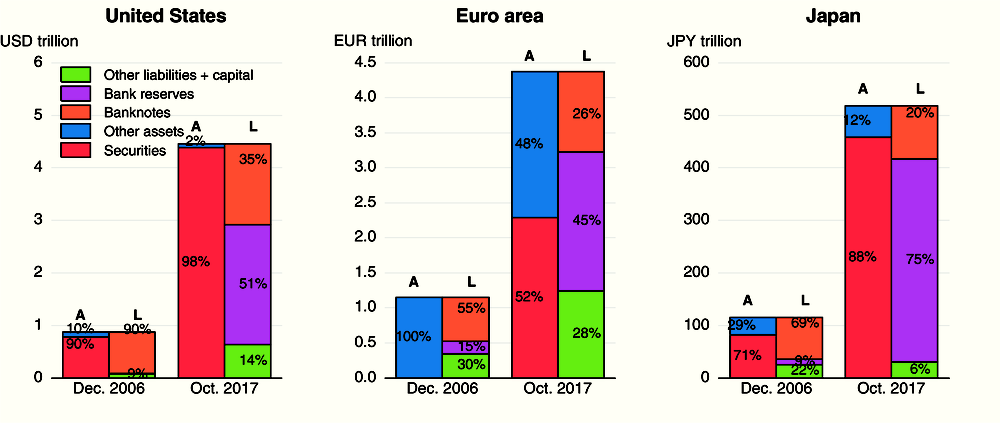
Note: “A“ stands for assets, “L“ stands for liabilities.
Source: US Federal Reserve; European Central Bank; and Bank of Japan.
Overview of operational frameworks of monetary policy
The corridor system has become a dominant operational monetary policy framework since the Bank of Canada first adopted it in 1994. The name derives from its feature of formulating a corridor of interest rates by putting a ceiling and a floor on short-term interest rates with standing lending and deposit facilities, respectively.1 In the corridor system, central banks provide short-term liquidity (reserve balances) to neutralise aggregated liquidity imbalances of financial institutions, with liquidity distributed through the banking system via money markets. When liquidity provision is insufficient, short-term interest rates may go up to the ceiling, and vice versa. The corridor systems have been often combined with reserve requirements, helping stabilise day-to-day fluctuations in market demand for reserve balances and making it easier for central banks to predict demand.
A possible variant to the corridor system with still small reserve balances, not currently adopted by any major central bank, is the zero-corridor system where financial institutions are always allowed to obtain enough liquidity and to deposit all the excess liquidity at central banks’ target rates without penalty. Therefore, financial institutions do not have any incentive to maintain precautionary reserve balances and central banks do not need to provide liquidity through market operations.
Another variant to the corridor system is the floor system. Under the floor system, central banks maintain short-term interest rates at the floor rate by deliberately supplying ample reserves in excess of market demand. Central banks that have expanded their balance sheets in recent years have been effectively operating the floor system.
In terms of the size and fluctuations of reserves, balances are the largest under the floor system, with little day-to-day fluctuations. In this framework, central banks can change the size of reserve balances without affecting short-term interest rates. In contrast, balances are significantly smaller under the corridor and zero-corridor systems and fluctuations are usually bigger. Reserve balances are likely to be slightly larger under the corridor system accompanied with reserve requirement arrangements than in the zero-corridor system. With the zero-corridor system, the size of reserve balances fluctuates with changes in demand from financial institutions.
Short-term market interest rates are best controlled in the zero-corridor and the floor systems. They may fluctuate considerably in the corridor system unless central banks intervene in money markets intensively. As a consequence, money market activity would be very limited under the floor system, in contrast to the corridor system. Well-functioning money markets are valuable for signalling liquidity and credit conditions. Under the zero-corridor system, allowing easy access to central banks’ standing facilities is likely to reduce the stigma of using central banks’ lending facilities. This is beneficial in case of market disruption, but may cause moral hazard in normal times.
Larger reserve balances under the floor system can contribute to financial stability. Ample reserves can work as a buffer in event of market liquidity shocks and could weaken, or crowd out, excessive short-term financing among private sector participants by satisfying the demand for safe short-term assets (Greenwood et al., 2016). On the other hand, larger reserve balances, probably with a high amount of government debt holdings, may induce higher political pressure on central banks. This could be motivated, among other things, by large fluctuations in net interest income and possible financial losses, since changes in policy interest rates pass through faster to the remuneration of reserve balances than to revenues from assets. These potential losses could be minimised by keeping the maturity of central banks' government bond holdings short.
Each framework has advantages and disadvantages and each could serve in the future as the main operating framework. The increasing focus on financial stability issues and currently-large balance sheets tend to favour the floor system. Maintaining the floor system and the associated large holdings of government bonds by central banks would also avoid the potential instability in financial markets that might occur if central banks were to reduce their balance sheets.
The effect of interest rates on the amount of banknotes
The amount of banknotes outstanding has increased significantly over the past decade (figure below). This change has been driven by public demand and has not been directly affected by quantitative easing policies. However, monetary policy has likely affected the demand for banknotes through interest rates, as these determine the opportunity cost of holding cash.2 The amount of banknotes was negatively related to interest rates before rates reached the zero lower bound in the main OECD areas (figure below). Since then, the prolonged period of very low interest rates might have undermined incentives to place deposits with banks and thus contributed to the growth in banknotes. Once the normalisation of interest rates is well underway, this could possibly imply that the amount of banknotes outstanding as a percentage of nominal GDP will decline to the level prevailing when interest rates were well above zero. Even in such a case, however, the nominal amount of banknotes outstanding is likely to remain at recent levels in the United States, as long as the economy grows steadily. Consequently, this would impose a minimal level of central bank assets.
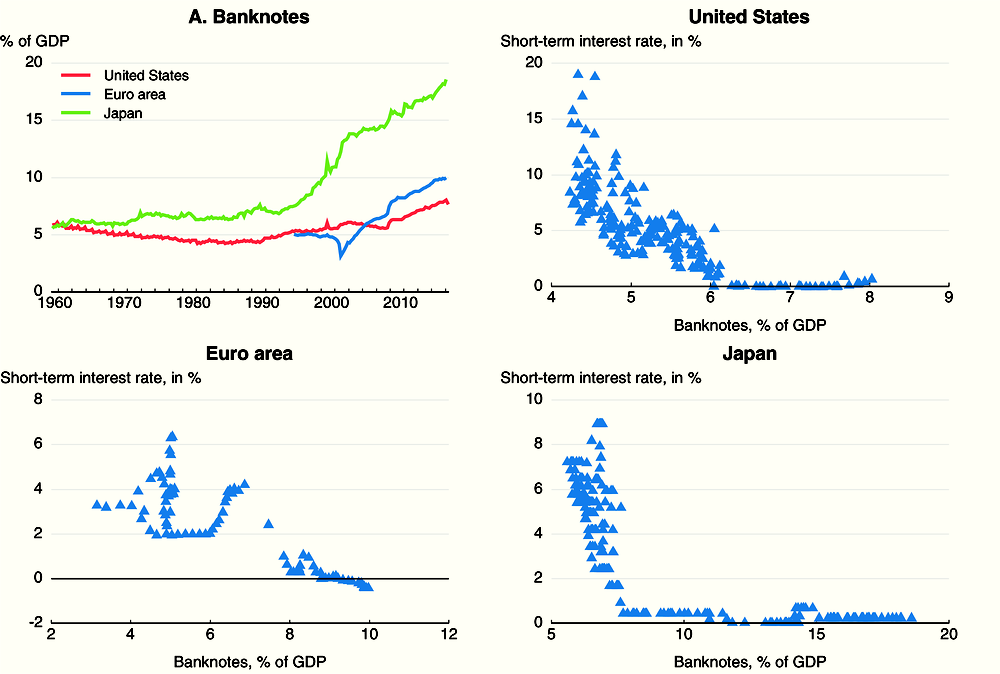
Note: For the United States and the euro area, amount outstanding of banknotes are approximated by currency in circulation.
Source: US Federal Reserve; European Central Bank; Bank of Japan; and OECD calculations.
← 1. Although any framework with those facilities can be classified as the corridor system, hereafter the term refers to a system under which a central bank sets its policy interest rate somewhere between the ceiling and floor, in order to distinguish it from variants such as the floor system or the zero-corridor system.
← 2. The amount of US banknotes is also affected by changes in foreign demand, especially from EMEs. Foreign demand has increased since the financial crisis due to higher uncertainty about the global economy (Banegas et al., 2015).
The need for a gradual removal of monetary stimulus differs among the main advanced economies, and this is reflected in expectations of interest rates in financial markets (Figure 1.30).
-
In the United States, the Federal Reserve should, as planned, continue with a gradual increase in policy rates and a gradual reduction of its balance sheet. Even with the announced pace at which the proceeds of maturing securities cease to be reinvested, the decline in Federal Reserve's balance sheet in nominal terms might be relatively short-lived and not very large (Figure 1.31). This reflects a likely higher level of banknotes and reserve balances needed to satisfy demand for short-term safe assets and transactions.
-
In the euro area, if realised and expected inflation strengthens with improving labour markets, the ECB should gradually taper asset purchases in 2018 in order to ultimately stop increasing the balance sheet. Decisions to increase policy rates should be deferred until 2020.
-
The Bank of Japan should continue its current stimulus in order to achieve the inflation target. Maintaining asset purchases lowers the servicing costs of Japan's elevated and rising government debt and thus prevents the tightening of financial conditions that could otherwise occur with rising fiscal risks. A rethinking of the monetary policy strategy would, however, be needed if the inflation target is not met for a prolonged time, the Bank of Japan becomes an even more predominant holder and buyer of government bonds and financial intermediation and stability become compromised.25
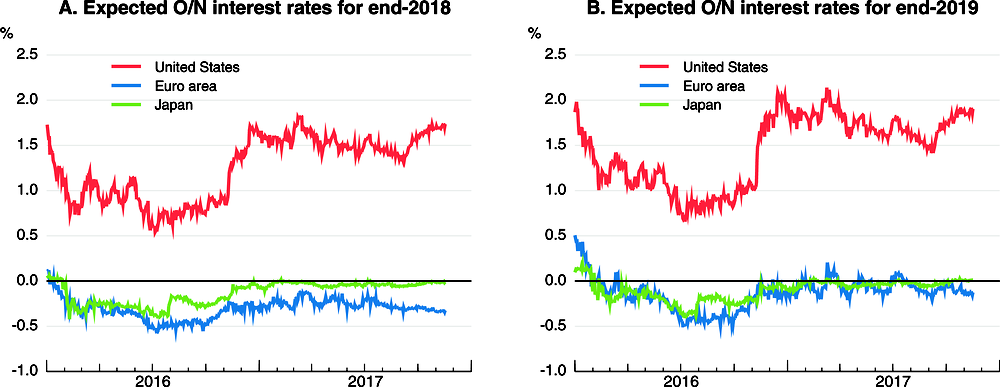
Source: Bloomberg; and OECD calculations.
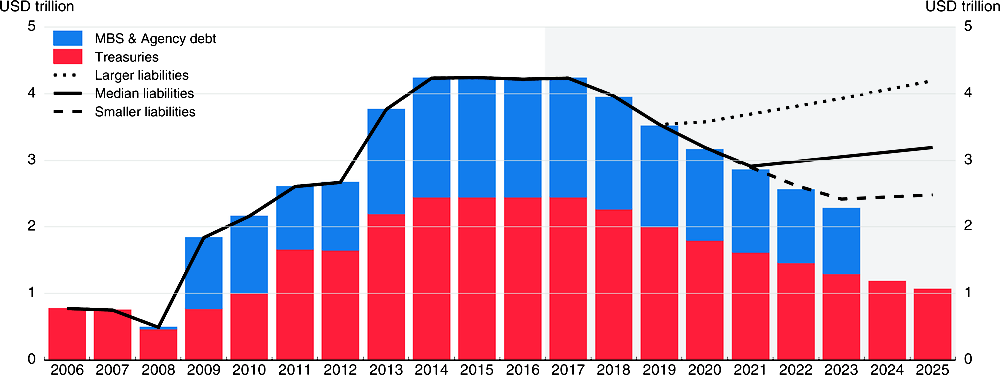
Notes: Figures for 2006-2016 are historical settled holdings. Smaller and larger liabilities projections are based, respectively, on the 25th percentile and 75th percentile responses to a question about the size and composition of the Federal Reserve’s long-run balance sheet in the New York Fed’s June 2017 Survey of Primary Dealers and Market Participants.
Source: Federal Reserve Bank of New York; and OECD calculations.
Short-term monetary policy requirements differ also among the largest EMEs. A continuation of monetary policy easing is warranted in Brazil and Russia, given declining inflation and the moderate recovery, and also in India, provided that inflation remains low. In China, monetary policy should aim to reduce the heavy reliance of economic growth on credit, thus targeting actions toward reducing the risks stemming from the significant accumulation of corporate and local government debt. The challenge for the Chinese authorities is to strike a balance between supporting demand and containing high risks to financial stability.
Structural and fiscal initiatives are still needed to boost potential growth
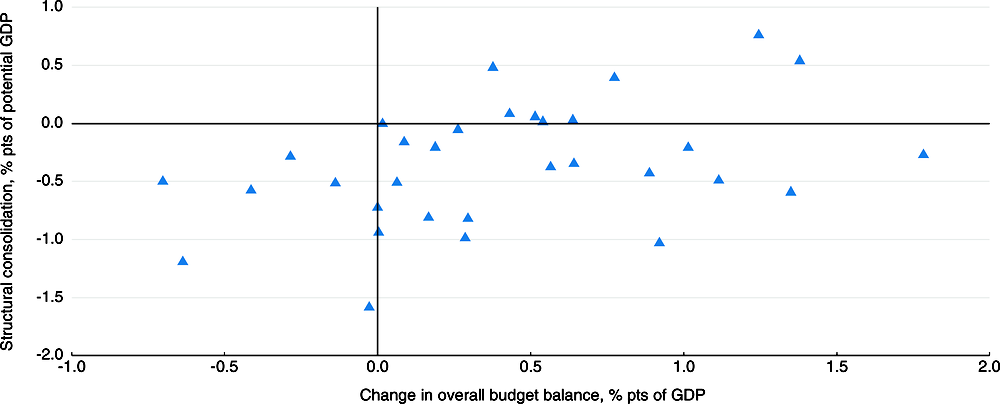
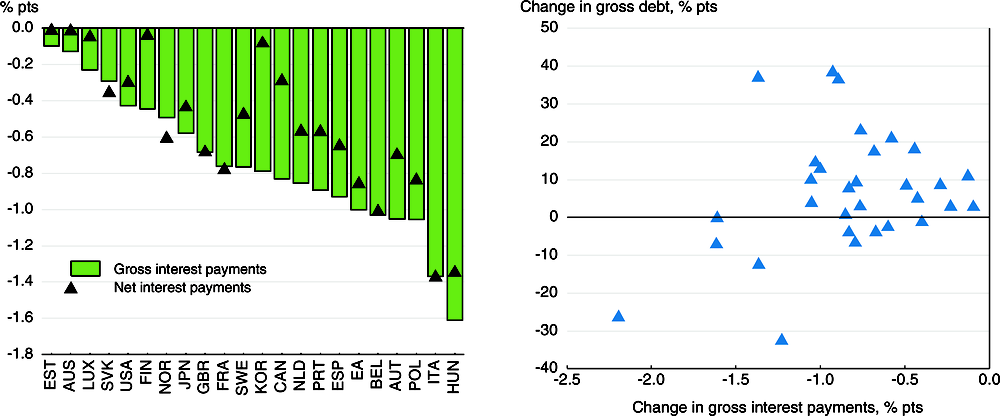
The fiscal policy stance is being eased in the majority of advanced economies as governments take advantage of the increase in the fiscal space offered by low borrowing costs. In the median OECD economy, a fiscal easing of just over ½ per cent of GDP is projected to occur over 2017-19, with the main boost in 2017 and 2018, after consolidation of around ½ per cent of GDP over 2015-16 (Figure 1.32). Despite the expected easing in many OECD countries, overall budget balances are projected to improve between 2017 and 2019, reflecting lower net interest payments and stronger cyclical momentum (Figure 1.33). Government gross interest payments have already declined between 2011 and 2017, even in many OECD countries with rising debt and even on a net basis, i.e. accounting for interest earnings on government financial assets (Figure 1.34).
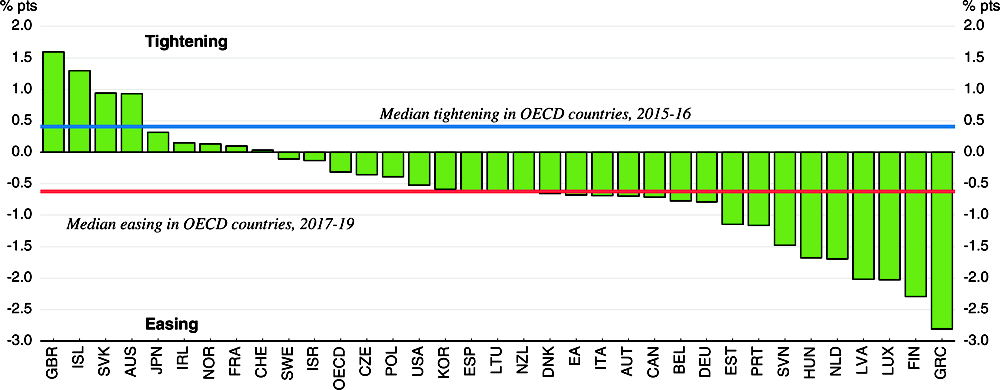
Source: OECD Economic Outlook 102 database; and OECD calculations.
Note: Excluding Greece and countries for which data are not available.
Source: OECD Economic Outlook 102 database; and OECD calculations.
Note: Excluding Greece and countries for which data are not available. The left hand side panel shows only countries with rising debt between 2011 and 2017.
Source: OECD Economic Outlook 102 database; and OECD calculations.
How vulnerable are fiscal conditions to a rise in interest rates? Stylised simulations for the largest advanced economies (excluding Japan) suggest that even a lasting increase in 10-year government bond yields of 1 percentage point compared with the current Economic Outlook projections might worsen budget balances on average by only between 0.1% and 0.3% of GDP annually in the following three years.26 Moreover, these estimates do not take into account two factors that might reduce the budget impact. First, in countries where central banks hold a significant share of government debt, debt servicing costs are effectively reduced as central banks' profits are ultimately transferred to governments. Second, higher nominal growth would likely reduce the fiscal burden of higher interest rates thanks to an improved primary balance and denominator effects.
Against the background of mildly expansionary fiscal policies, there is a need to implement supply-side-enhancing measures to ensure that growth strengthens in a sustainable way, increases in incomes and living standards are shared broadly and public finances are sustainable.
-
These measures should involve hard, soft and remedial infrastructure investment, with the mix differing across countries according to need, as such spending enhances longer-term supply and adds to aggregate demand.27
-
Countries should also aim to restructure their spending and tax policies towards a more growth-friendly and inclusive mix, including through the tax and transfer system (Cournède et al., 2013; Fournier and Johansson, 2016).
-
Moreover, coherent packages of structural reforms are needed. These can enhance the overall effectiveness of policies by raising their combined economic impact and helping to ensure that their benefits are widely shared (OECD, 2017c). In particular, reforms to reduce barriers to product market competition, either at home or from abroad, should be accompanied by labour market measures. The latter can help vulnerable workers transition to new jobs, as product market reforms may be associated with more frequent transitions out of employment for less qualified and low-income workers (Cournède et al., 2016) and may result in job losses concentrated in specific industries or geographical locations (OECD, 2017c). Yet in recent years there has only been a limited packaging of reforms. Policy efforts have been concentrated either in the labour market or product markets, but very rarely in both areas (OECD, 2017b), despite the opportunities that exist to combine measures to boost competition, either in domestic product markets or through lower barriers to international trade and investment, with specific labour reforms.
-
Services sector reforms that tackle regulatory barriers, such as licenses and a lack of recognition of qualifications, could help small and medium-sized enterprises scale up at an earlier stage by entering international markets through digital platforms and networks (OECD, 2017g). Simultaneous labour market reforms that soften the regulatory burden of scaling up could help such companies achieve the full benefits of more open and competitive services markets.
Bibliography
Adalet McGowan, M., D. Andrews and V. Millot (2017), “Insolvency Regimes, Zombie Firms and Capital Reallocation”, OECD Economics Department Working Papers, No. 1399, OECD Publishing, Paris. DOI: https://doi.org/10.1787/5a16beda-en
Alesina, A., S. Ardagna, G. Nicoletti and F. Schiantarelli (2005), “Regulation and Investment”, Journal of the European Economic Association, 3(4), 791–825.
Auer, R. and A. M. Fischer (2010), “The Effect of Low-Wage Import Competition on U.S. Inflationary Pressure”, Journal of Monetary Economics, 57(4), 491-503.
Banegas, A., R. Judson, C. Sims and V. Stebunovs (2015), “International Dollar Flows”, FRB International Finance Discussion Paper, No. 1144. DOI: https://doi.org/10.2139/ssrn.2664167
Bank of Japan (2017), Outlook for Economic Activity and Prices, July 2017.
Bernanke, B. (2017), “Shrinking the Fed’s balance sheet”, The Brookings Institution blog, January 26.
Bonis, B., J. Ihrig and W. Min (2017a), “The Effect of the Federal Reserve’s Securities Holdings on Longer-term Interest Rates”, FEDS Notes, Washington: Board of Governors of the Federal Reserve System, 20 April, DOI: https://doi.org/10.17016/2380-7172.1977.
Bonis, B., J. Ihrig and W. Min (2017b), “Projected Evolution of the SOMA Portfolio and the 10-year Treasury Term Premium Effect”, FEDS Notes, Washington: Board of Governors of the Federal Reserve System, 22 September.
Broadbent, B. (2015), “Compositional Shifts in the Labour Market”, speech at Bank of England conference ‘Understanding the Great Recession: From Micro to Macro’, September.
Carey, D., J. Lester and I. Luong (2016), “Boosting Productivity Through Greater Small Business Dynamism in Canada”, OECD Economics Department Working Papers, No. 1314, OECD Publishing, Paris. DOI: https://doi.org/10.1787/5jlv23k891r8-en
Cella, C., A. Ellul and M. Giannetti (2013), “Investors’ Horizons and the Amplification of Market Shocks”, The Review of Financial Studies, 26(7), 1607–1648, Oxford University Press.
Cœuré, B. (2017), “Scars or Scratches? Hysteresis in the euro area”, speech at the International Center for Monetary and Banking Studies, Geneva, May 2017.
Cournède, B. et al., (2013), “Reconciling Fiscal Consolidation With Growth and Equity”, OECD Journal: Economic Studies, Vol. 2013/1. DOI: https://doi.org/10.1787/eco_studies-2013-5jzb44vzbkhd
Cournède, B. et al., (2016), "Enhancing Economic Flexibility: What is in it for Workers?”, OECD Economic Policy Paper, No. 19, OECD Publishing, Paris. https://www.oecd.org/eco/Enhancing-economic-flexibility-what-is-in-it-for-workers.pdf
Da, Z. and S. Shive (2014), “Exchange Traded Funds and Asset Return Correlations”, Working Paper, Notre Dame University.
Daly, M. and B. Hobijn (2017), “Composition, Selection and Aggregate Real Wage Growth”, American Economic Review (Papers and Proceedings), 107(5), 349-52.
Deloitte (2014), CFO Survey: Looking Beyond The Clouds, Q3:2014 Survey, Deloitte Australia.
Deutsche Bundesbank (2015), “Slowdown in Growth in the Emerging Market Economies”, Deutsche Bundesbank Monthly Report, July.
Döttling, R., G. Gutiérrez and T. Philippon (2017), “Is There An Investment Gap in Advanced Economies? If So, Why?”, paper presented at ECB Forum on Central Banking, Sintra, 2017.
Égert, B. and P. Gal (2017), “The Quantification of Structural Reforms in OECD Countries: A New Framework”, OECD Economics Department Working Papers, No. 1354, OECD Publishing, Paris. DOI: https://doi.org/10.1787/2d887027-en
ETFGI (2017), “ETFGI Global ETF and ETP industry highlights”, etfgi.com, July.
Federal Reserve Bank of New York (2017), Projections for the SOMA Portfolio and Net Income. An update to projections presented in the “Report on Domestic Open market Operations during 2016”, July.
Federal Reserve Board (2017), “Addendum to the Policy Normalization Principles and Plans”. https://www.federalreserve.gov/monetarypolicy/files/FOMC_PolicyNormalization.20170613.pdf
Fournier, J.M. (2015), “The Negative Effect of Regulatory Divergence on Foreign Direct Investment”, OECD Economics Department Working Papers, No. 1268, OECD Publishing, Paris. DOI: https://doi.org/10.1787/5jrqgvg0dw27-en
Fournier, J.M. and Å. Johansson (2016), “The Effect of the Size and the Mix of Public Spending on Growth and Inequality”, OECD Economics Department Working Papers, No. 1344, OECD Publishing, Paris. DOI: https://doi.org/10.1787/f99f6b36-en
Gal, P. and A. Hijzen (2016), “The Short-Term Impact of Product Market Reforms: A Cross-Country Firm Level Analysis”, OECD Economics Department Working Papers, No. 1311, OECD Publishing. DOI: https://doi.org/10.1787/5jlv2jm07djl-en
Greenwood, R., S. Hanson and J. Stein (2016), “The Federal Reserve’s Balance Sheet as a Financial-Stability Tool”, mimeo.
Haugh, D., et al. (2016), “Cardiac Arrest or Dizzy Spell: Why is World Trade So Weak and What can Policy Do About It?”, OECD Economic Policy Papers, No. 18, OECD Publishing, Paris. DOI: https://doi.org/10.1787/5jlr2h45q532-en
Inaba, K., R. O’Farrell, Ł. Rawdanowicz and A. K. Christensen (2015), “The Conduct of Monetary Policy in the Future: Instrument Use”, OECD Economics Department Working Papers, No. 1187, OECD Publishing, Paris. DOI: https://doi.org/10.1787/5js4w293c46j-en
Krueger, A.B. (2017), “Where Have All the Workers Gone? An Inquiry into the Decline of the U.S. Labour Force Participation Rate”, Brookings Papers on Economic Activity, (forthcoming).
Lorenzoni, L., J. Millar, F. Sassi and D. Sutherland (2017), “Cyclical vs Structural Effects on Health Care Expenditure Trends in OECD Countries”, OECD Health Working Papers, No. 92, OECD Publishing, Paris. DOI: https://doi.org/10.1787/be74e5c5-en
Millar, J. and D. Sutherland (2016), “Unleashing Private Sector Productivity in the United States”, OECD Economics Department Working Papers, No. 1328, OECD Publishing, Paris. DOI: https://doi.org/10.1787/5jlpq7zk4j30-en
Mourougane, A., et al. (2016), “Can an Increase in Public Investment Sustainably Lift Economic Growth?”, OECD Economics Department Working Papers, No. 1351, OECD Publishing, Paris. DOI: https://doi.org/10.1787/a25a7723-en
Norman, D. (2016), “Lowering the Bar: Hurdle Rates”, US Manufacturers Alliance for Productivity and Innovation, April.
OECD (2015), “Lifting Investment for Higher Sustainable Growth”, OECD Economic Outlook, Volume 2015, Issue 1, OECD Publishing, Paris. DOI: https://doi.org/10.1787/eco_outlook-v2015-1-en
OECD (2016a), OECD Economic Outlook, Volume 2016, Issue 2, OECD Publishing, Paris. DOI: https://doi.org/10.1787/eco_outlook-v2016-2-en
OECD (2016b), OECD Employment Outlook 2016, Chapter 1, OECD Publishing, Paris. DOI: https://doi.org/10.1787/empl_outlook-2016-en
OECD (2017a), Investing in Climate, Investing in Growth, OECD Publishing, Paris. DOI: https://doi.org/10.1787/9789264273528-en
OECD (2017b), Economic Policy Reforms 2017: Going for Growth, OECD Publishing, Paris. DOI: https://doi.org/10.1787/growth-2017-ec
OECD (2017c), OECD Economic Outlook, Volume 2017, Issue 1, OECD Publishing, Paris. DOI: https://doi.org/10.1787/eco_outlook-v2017-1-en
OECD (2017d), OECD Economic Surveys: China 2017, OECD Publishing, Paris. DOI: https://doi.org/10.1787/eco_surveys-chn-2017-en
OECD (2017e), OECD Economic Surveys: India 2017, OECD Publishing, Paris. DOI: https://doi.org/10.1787/eco_surveys-ind-2017-en
OECD (2017f), OECD Economic Surveys: Mexico 2017, OECD Publishing, Paris. DOI: https://doi.org/10.1787/eco_surveys-mex-2017-en
OECD (2017g), Services Trade Policies and the Global Economy, OECD Publishing, Paris. DOI: https://doi.org/10.1787/9789264275232-en
OECD (2017h), Entrepreneurship At A Glance 2017, OECD Publishing, Paris. DOI: https://doi.org/10.1787/entrepreneur_aag-2017-en
OECD-WTO (2017), Nowcast TiVA Estimates: Methodology, OECD Publishing, Paris.
OFR (2017), “The Volatility Paradox: Tranquil Markets May Harbor Hidden Risks”, Markets Monitor, Second Quarter, Office of Financial Research, June 30.
Sharpe, S.A. and G.A. Suarez (2014), “Why Isn’t Investment More Sensitive to Interest Rates? Evidence from Surveys”, Federal Reserve Board Finance and Economic Discussion Series, No. 2014-002.
World Bank (2017), Global Economic Prospects: Weak Investment in Uncertain Times January 2017, World Bank, Washington.
WTO (2017), Report to the Trade Policy Review Body from the Director-General on Trade-Related Developments, July, World Trade Organisation, Geneva.
Fiscal policy settings for 2018 and 2019 are based as closely as possible on legislated tax and spending provisions and are consistent with growth, inflation and wage projections. Where government plans have been announced but not legislated, they are incorporated if it is deemed clear that they will be implemented in a shape close to that announced. For the United States, with the fiscal programme yet to be finalised, the projections assume an increase in the underlying primary deficit of around ½ per cent of GDP in 2018, primarily due to reduced taxes. Elsewhere, where there is insufficient information to determine budget outcomes, underlying primary balances are kept unchanged, implying no discretionary change in the fiscal stance; in euro area countries, the stated targets in Stability Programmes are also used. In Japan, it is assumed that a consumption tax rise is implemented in the fourth quarter of 2019.
Regarding monetary policy, the assumed path of policy interest rates represents the most likely outcome, conditional upon the OECD projections of activity and inflation, which may differ from the stated path of the monetary authorities.
-
In the United States, the upper bound of the target federal funds rate is assumed to be raised gradually to reach 2.75% in December 2019, up from the current level of 1.25%.
-
In Japan, the overnight interest rate is assumed to be kept at -0.1% for the entire projection period.
-
In the euro area, the main refinancing rate is assumed to be kept at 0% and the deposit interest rate at -0.4% until the end of 2019.
-
In China, monetary policy is assumed to be neutral, with a tightening bias to address financial stability risks and targeted easing to ease access to credit by small and agriculture businesses.
-
In India, the repo rate is assumed to be cut from the current level of 6% to 5.75% in mid-2018 and then remain constant.
-
In Brazil, the policy rate is assumed to be cut gradually from the current level of 7.5% to 7% by the end of 2019.
Although their impact is difficult to assess, the following quantitative easing measures are assumed to be taken over the projection period, implicitly affecting long-term interest rates. In the United States, it is assumed that the Federal Reserve reduces, as announced, the stock of asset holdings as October 2017. In Japan, the Bank of Japan’s asset purchases and yield curve control are assumed to last until the end of 2019, maintaining the 10-year government bond yield at 0%. In the euro area, it is assumed that the ECB will gradually taper asset purchases in 2018, keeping long-term interest rates fairly constant until mid-2018.
Structural reforms that have been implemented or announced for the projection period are taken into account, but no further reforms are assumed to take place.
The projections assume unchanged exchange rates from those prevailing on 8 November 2017: one US dollar equals JPY 113.82, EUR 0.86 (or equivalently one euro equals USD 1.16) and 6.63 renminbi.
The price of a barrel of Brent crude oil is assumed to remain constant at $60 throughout the projection period. Non-oil commodity prices are assumed to be constant over the projection period at their average levels from October 2017.
A technical assumption is made that the United Kingdom has a transition arrangement with the European Union after formal exit in 2019, resulting in little disruption to trade that year.
The cut-off date for information used in the projections is 23 November 2017.
← 1. Key technical assumptions underlying the projections are set out in Annex A1.
← 2. Trade growth in Europe in 2019 will depend in part on the new economic relationship between the United Kingdom and the European Union (EU). The projections use a technical assumption that the United Kingdom has a transition arrangement with the EU after formal exit in 2019, which minimises potential short-term disruptions to trade in 2019.
← 3. Consensus growth projections suggest that PPP-weighted global GDP growth is now expected to average only 3¼ per cent per annum over the next decade, compared with expectations prior to the crisis and its immediate aftermath that future annual global growth would average around 4% per annum.
← 4. More timely quarterly data show a rise in the number of new enterprises created in 2016 and early 2017 in some OECD countries (OECD, 2017h).
← 5. Information over a longer time period is available for the United States and Canada using national definitions of entry and exit rates. On average, over 2003-15 entry and exit rates in the United States were 3 and 2 percentage points lower, respectively, than in the previous two decades (Millar and Sutherland, 2016). In Canada, the equivalent gaps were around 4 percentage points (Carey et al., 2016).
← 6. The extent of the shortfall for each country depends on the pre-crisis period that is chosen for the target growth of the capital stock. Choosing a shorter sample from 1997-2007 does not alter the findings for the typical OECD economy, with the investment shortfall in the median OECD economy remaining at 15% and the unweighted average shortfall being 17% (down from 18% for 1990-2007).
← 7. The average hurdle rate amongst the US companies responding to the Duke CFO Global Business Outlook Survey was 14.7% in 2007, 14.8% in 2011 and 13.6% in 2017.
← 8. Since 2011, expectations of average annual growth over the next decade have declined by 2 percentage points in China and by close to 1½ percentage points in the other major EMEs.
← 9. No similar shifts have been observed in Germany and the United States. The shifts have resulted also in a significant narrowing of the distribution of price changes weighted by their respective core inflation weights.
← 10. In Japan, the planned consumption tax increase in the last quarter of 2019 is estimated to boost year-on-year inflation by 1.1 percentage points.
← 11. Two-year ahead consensus forecasts of headline inflation in 2015-16 were overestimated, on average by between 1 and 1¼ percentage points in the euro area, Japan and the United States.
← 12. The harmonised youth unemployment rate has however now declined to its pre-crisis level.
← 13. For the OECD economies overall, average annual real wage growth is just over 0.6% per annum in 2017-19 whether calculated on a producer wage basis (with nominal wages deflated by the GDP deflator) or a consumer wage basis (nominal wages deflated by the implicit household consumption deflator).
← 14. In contrast, economic part-time working has returned towards pre-crisis norms as the recovery has progressed.
← 15. Data on full-time and part-time employment based on a common definition of 30-usual weekly hours of work in the main job.
← 16. These compositional shifts may also help to account for the flattening of wage Phillips curves in recent years (OECD, 2016b).
← 17. Compositional effects could also affect the change in total earnings (earnings per hour multiplied by the number of hours worked) depending on changes in the annual hours (or weeks) worked by each category of employment. It may also be the case that the rising number of part-time and temporary workers has reduced the bargaining power of full-time workers, and hence wage growth, and that there are stronger effects in some sub-periods within the sample used.
← 18. Average pay per hour in the euro area and median weekly earnings in the United States rose by 16.9% and 14.9% between 2006-14 and 2008-16 respectively, implying average annual growth of 2% and 1.75% respectively.
← 19. For instance, if term premia were to increase to their pre-crisis levels in the United States, bond yields would go up by nearly 90 basis points, which studies show could result from the normalisation of the Federal Reserve's balance sheet (Bonis et al., 2017a, b). In addition, if policy interest rates in the United States were to evolve in line with FOMC median expectations rather than those implied in financial market prices, the US 10-year yield would rise by around 60 basis points.
← 20. This is discussed further in Chapter 2.
← 21. Moody's US high-yield bond covenant quality measure was close to a record low in October, see Moody's Investors Service, Global Credit Research, 14 November 2017.
← 22. Value-at-Risk and volatility control are methods to manage investment risks based on the recent volatility of asset prices. With the Value-at-Risk method, investment positions are adjusted to limit the potential loss based on a probability of the maximum potential loss during a given period, which is positively related to the volatility. With volatility control, the allocation between risky and safe assets is dynamically adjusted so that the volatility of the total value of investment stays in line with a pre-determined benchmark.
← 23. As of October 2017, principal payments from maturing securities are planned to be reinvested only if they exceed gradually rising caps (from USD 6 billion per month to USD 30 billion for Treasuries and from USD 4 billion per month to USD 20 billion for agency debt and mortgage-backed securities (MBS); caps for agency debt and MBS may stop being binding before reaching the maximum cap (Federal Reserve Board, 2017; Federal Reserve Bank of New York, 2017).
← 24. The ECB has already announced elements of a similar strategy, involving a reduction of asset purchases and a commitment to keep interest rates low well past the end of asset purchases.
← 25. The Bank of Japan is likely to own more than half of Japanese government bonds in the market by the end of 2019, even at the reduced pace of purchases after the introduction of yield curve control in September 2016.
← 26. The budget impact is calculated as the increase in interest payments that would occur cumulatively in the following three years if the long-end of the yield curve increases permanently by 1 percentage point, while the short-end remains unchanged compared with the baseline and the yields in between adjust linearly. The increase in 10-year yields could be prompted by market participants expecting higher policy interest rates, normalisation of term premia or higher fiscal risk premia. These stylised calculations assume that higher interest rates have no effect on nominal growth and the primary balance and that the maturity structure of new debt issues is the same as the remaining maturity of government debt as of October 2017. Higher interest rates are assumed not to be passed through to returns on government financial assets.
← 27. Stylised simulations show that several OECD countries could debt finance spending of this type, amounting to 0.5% of GDP, for 3-4 years on average and boost output without a deterioration in debt-to-GDP ratios in the long term (Mourougane et al., 2016).