.jpg?a4384ad645a7284c15259ce80248ac2e)
Indicator D7. What proportion of teachers leave the teaching profession?
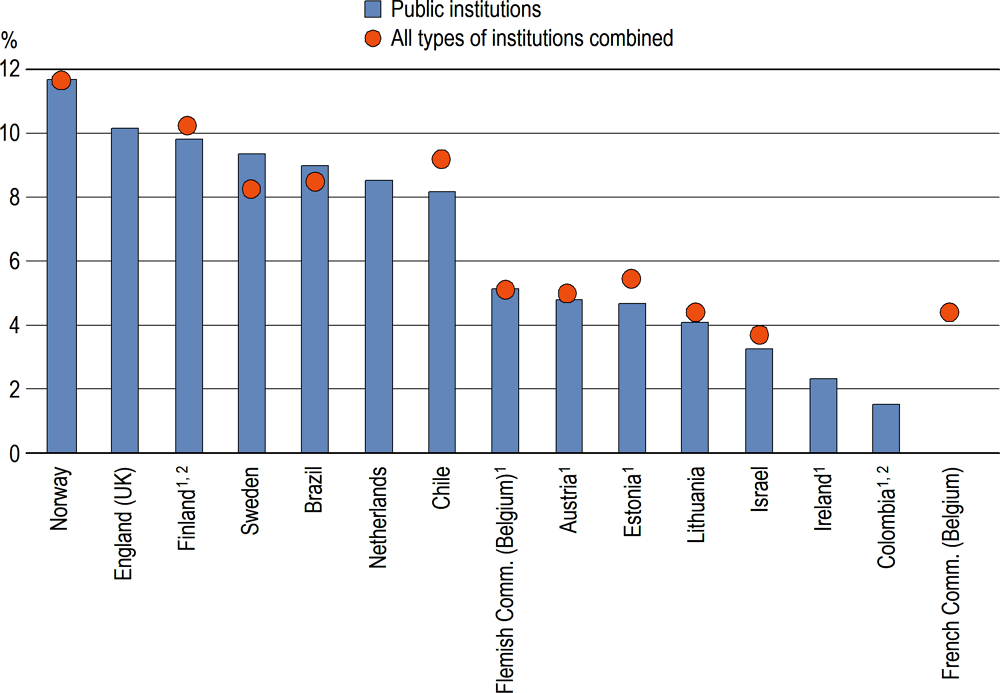
In 2016, attrition rates in public institutions varied from 3.3% in Israel to 11.7% in Norway from pre-primary to upper secondary education (among comparable countries).
Male teachers tend to show higher attrition rates than their female colleagues on average across countries with available data.
Attrition rates are higher in the oldest age group (aged 55 or over) than for mid-career teachers (aged 35-54) due to retirement on average across countries with available data. Attrition rates of younger teachers (aged 34 or below) are also higher than those of mid-career teachers in some countries, suggesting some differences in the status of the teaching profession as entry-level professionals.
1. The coverage differs from the indicated coverage. Refer to the source table for details.
2. Reference year differs from 2016. Refer to the source table for details.
Countries and economies are ranked in descending order of estimated attrition rates in public institutions.
Source: OECD (2021), Table D7.1. See Source section for more information and Annex 3 for notes (https://www.oecd.org/education/education-at-a-glance/EAG2021_Annex3_ChapterD.pdf).
Context
Most of the current expenditure on education is devoted to teaching staff compensation. As teachers are the primary mode of instruction that students receive, the distribution of teachers by age is an important variable when planning for changes in the teaching population. However, ensuring that there will be enough skilled, experienced teachers to educate all children also depends on the proportion of young people who would like to enter the teaching profession, and the proportion of teaching staff who leave the teaching profession before retirement. Teacher attrition and the reasons for attrition can thus shed light on how to develop effective policies to maintain the required number of teachers in the teaching profession.
Teachers decide to leave the teaching profession for various reasons. Some factors relate to the teaching profession in general (e.g. benefits and working conditions, reduction in teacher demand) and/or to the external job market (e.g. relative salaries to other professions). Individual factors relate to objective characteristics (e.g. age, region) or more subjective factors (e.g. stress from work). As a teacher’s decision to leave the profession is a result of numerous and complex factors, this indicator does not aim to explain the relationship between teacher attrition and the factors that may increase the likelihood that teachers will indeed leave the teaching profession.
Other findings
In the majority of countries and economies with comparable data, the teacher attrition rate in public institutions is similar to or less than that in all types of institutions combined. However, in Brazil and Sweden, teachers in public institutions show higher attrition rates than teachers in private institutions.
Higher attrition rates among male teachers than female teachers may not lead to high attrition rates for all teachers combined, due to the small proportion of male teachers in the teaching profession in some countries.
Teacher attrition rates at pre-primary level are either similar to or higher than those at the primary level in all countries and economies with data, regardless of the type of educational institution. Moreover, in seven out of the ten countries with data for public institutions, attrition rates for secondary school teachers (lower and upper secondary combined) are higher than those for primary school teachers.
Note
This indicator contributes to the development of the Sustainable Development Goal (SDG) Thematic Indicator 4.c.6 proposed by UNESCO (UNESCO-UIS, 2019[1]) on teacher attrition rates by level of education.
As a limited number of OECD countries participated in the data collection on attrition used to develop this indicator, information is not representative of all OECD countries; therefore only an average of participating OECD and partner countries and economies is presented in the data tables.
This indicator analyses teacher attrition; that is to say, the proportion of teachers (between pre-primary and upper secondary levels of education) leaving the teaching profession during their career. Several methods can be used to measure attrition, and this indicator focuses on an indirect measure of attrition, computing attrition based on the number of teachers in two successive reference years and the number of teachers who entered the teaching profession between these two reference years. This follows the method proposed by the Sustainable Development Goal (for comparability issues related to this method, see Box D7.1; for more information on other methods to estimate attrition, see Box D7.2).
Teacher attrition rates estimated using the Sustainable Development Goal (SDG) method (see the Methodology section at the end of this indicator) may include some bias due to teachers on temporary leave and/or teachers moving between levels of education.
Bias from temporary leave
Over the course of a teaching career, teachers may take various forms of leave, such as annual leave, sick leave, maternity/paternity leave and study leave. These kinds of temporary leave cannot bias teacher attrition rates when the total number of teachers includes both teachers on duty and teachers on temporary leave.
However, data sources in some countries are designed to count only the teachers on duty at a given point in time, so the total number of teachers does not include teachers on temporary leave. In this case, teacher attrition rates could be either under- or overestimated depending on the difference between the number of teachers on temporary leave and the number of teachers returning from temporary leave during the reference period.
Attrition rate is underestimated when the number of teachers leaving for temporary leave is greater than the number of teachers returning from temporary leave during the reference period.
Attrition rate is overestimated when the number of teachers returning from temporary leave is greater than the number of teachers leaving for temporary leave during the reference period.
For countries that report the total number of teachers excluding teachers on temporary leave, the underlying assumption is that the number of teachers leaving for temporary leave is similar to the number of teachers returning from temporary leave during the reference period. However, this assumption may not be true in some circumstances, for example, where there is a one-time change in the regulations regarding temporary leaves (e.g. incentive for teachers to take shorter leave, increase in the maximum duration of certain types of temporary leave). The extent of this bias cannot be estimated with the current set of data.
Bias from teachers moving between levels of education
Teachers in some countries may be granted flexibility to move between different levels of education, without leaving the teaching profession. One possibility is that multiple levels of education are integrated into a single structure (e.g. basic education in Finland integrates primary and lower secondary levels). Another possibility is that the minimum qualification to teach in one level of education is the same in other levels of education (e.g. teachers in the French Community of Belgium who qualified to teach in lower secondary schools could teach in upper secondary schools in case of teacher shortage).
When attrition rates are computed by level of education, teachers moving between levels of education during the reference period may introduce additional bias in teacher attrition rates (if these teachers are considered as leaving or entering the profession). When there are more teachers moving into the specific level of education than teachers moving out to other levels of education (i.e. net inflow into the specific level of education), the SDG method overestimates the attrition rate of the specific level of education. In contrast, when there are fewer teachers moving into the specific level of education than teachers moving out to other levels of education (i.e. net outflow), the attrition rate is underestimated.
To minimise the extent of this bias, a revised methodology incorporates the number of teachers moving between levels of education in the calculation. Among the ten countries and economies with comparable results, the extent of bias corrected using the revised method is estimated to be as much as 4 percentage points.
The SDG method used throughout this indicator estimates the teacher attrition rate based on an indirect measure of the number of teachers leaving the profession: teachers leaving the profession are deduced from the number of teachers in two consecutive reference years and the number of new teachers entering the teaching profession between these two reference years (see the Methodology section). This is a way to overcome technical limitations in many countries to track individual teachers (UNESCO, 2018[2]).
However, some OECD countries can obtain actual numbers of teachers who left the profession during the reference period by tracking the status of individual teachers over time. This allows a direct estimation of teacher attrition. The direct method is less influenced by biases resulting from teachers on temporary leave and from teachers moving between levels of education (see Box D7.1). It also allows other analyses on teacher attrition.
Among the 16 countries and economies that participated in the OECD survey on attrition gathering data to measure attrition based on both the indirect and direct methods, 13 countries and economies could use the direct method to estimate attrition rates.
Workload of teachers leaving the profession
As there are two types of counting methods for teachers (headcounts and full-time equivalents), attrition rates can be estimated in two ways. However, as the SDG method introduces another complexity to interpret teachers’ changing workload between the two reference years, only the direct estimation method can be used to measure and compare attrition rates estimated under different teacher counting methods.
Attrition rates based on full-time equivalents are usually lower than or equal to attrition rates based on headcounts (Tables D7.3 and D7.4, available on line). This suggests that teachers who left the profession had teaching loads less than one full-time equivalent teacher on average, thus likely to include part-time teachers. In addition, the impact of teacher attrition on actual workload would be less than the attrition rates obtained from headcounts.
Impact of retiring teachers on teacher attrition
Teacher attrition can be higher when there are many teachers leaving the profession due to retirement. The direct estimation method can be revised to exclude the impact of teachers retiring, as they belong to a specific group of teachers leaving the profession. Across eight countries and economies with comparable data, teachers retiring from the profession explain an average of 2 percentage points of overall teacher attrition rates (Table D7.5, available on line).
Note: The direct method can overestimate the level of attrition when the number of teachers leaving the profession includes some teachers leaving for temporary leave. However, this type of bias can be minimised by excluding the number of teachers returning from temporary leave in the following years’ data.
Across the OECD and partner countries and economies with comparable attrition rates estimated with the proposed method, attrition rates of all teachers from pre-primary to upper secondary public institutions range from 3.3% in Israel to 11.7% in Norway. In a half of these countries and economies, attrition rates exceed 8%: Brazil, Chile, England (United Kingdom), Finland, the Netherlands, Norway and Sweden (Figure D7.1).
Attrition rates of all teachers can also be expanded to analyse attrition by type of institution, gender, age and/or level of education. Except in the analysis by level of education, attrition rates in this analysis cover pre-primary to upper secondary levels of education combined.
Attrition rates by type of institution
Expanding the scope to all types of institutions combined (both public and private institutions combined) shows a similar range of attrition rates in public institutions for pre-primary to upper secondary education combined: from 3.8% in Israel to 11.7% in Norway. In eight out of the ten countries and economies with comparable data, differences in attrition rates between teachers in public institutions and teachers in all types of institutions combined do not exceed 1 percentage point (Figure D7.1). This may result from the fact that public institutions enrol most students, and then most teachers teach in public institutions, resulting in a similar level of attrition rates in public institutions as the level of attrition for all types of institutions combined (Table D7.6, available on line).
However, attrition may vary between types of institutions. In Sweden, teachers in private institutions show lower attrition than teachers in public institutions (because the attrition rate of teachers in all types of institutions combined is lower than that in public institutions) (Figure D7.1). Chile is an example of the opposite case. In Chile, where teachers in private institutions make up more than a half of all teachers, the attrition rate for teachers in private institutions is higher than that in public institutions (because the attrition rate of teachers in all types of institutions combined is higher than that in public institutions only) (Figure D7.1 and Table D7.6, available on line). Higher frequency of changes in the teaching population (due to recruitment and dismissal) in government-dependent private schools than in public (municipal) schools may explain this phenomenon (Ávalos and Valenzuela, 2016[3]).
Attrition by gender
In a majority of countries with available data, male teachers show higher attrition rates than their female colleagues, in both public institutions and in all types of institutions combined (Figure D7.2). However, this statement should not be generalised across all OECD countries considering the small number of countries with available data (for more information on the relationship between gender and the intention to leave teaching within five years among lower secondary teachers, see Box D7.3).
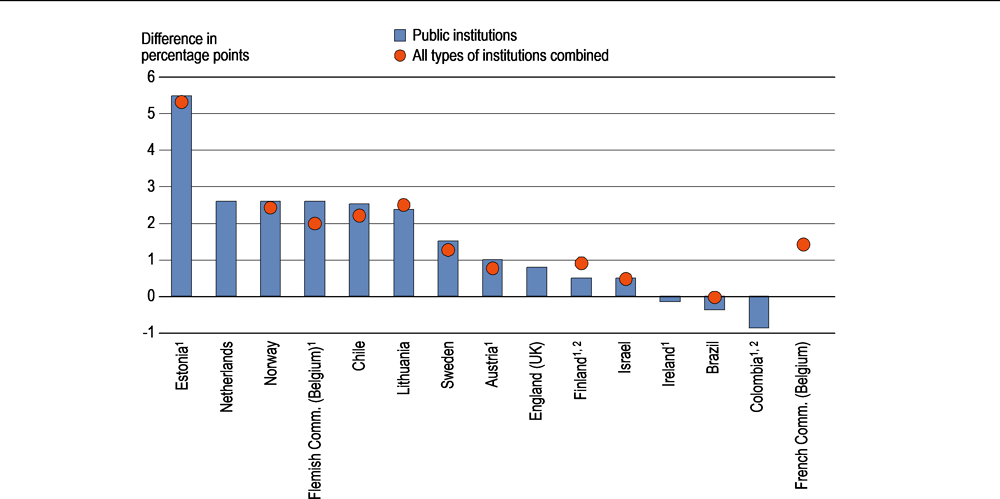
Note: Positive values indicate that attrition rates are higher for males than for females. Negative values indicate that attrition rates are lower for males than for females.
1. The coverage differs from the indicated coverage. Refer to the source table for details.
2. Reference year differs from 2016. Refer to the source table for details.
Countries and economies are ranked in descending order of the difference of attrition rates between male and female teachers in public institutions.
Source: OECD (2021), Table D7.1. See Source section for more information and Annex 3 for notes (https://www.oecd.org/education/education-at-a-glance/EAG2021_Annex3_ChapterD.pdf).
The OECD Teaching and Learning International Survey (TALIS) 2018 asked lower secondary teachers how many years they want to continue to work as teachers. The intention to stop teaching in the coming years cannot be directly interpreted as the actual level of teacher attrition (even if they are correlated; see Weiss (1999[4])). However, it can be a complementary indicator to analyse the characteristics of teachers who are more likely to leave teaching in the next few years.
To analyse the relationship between the intention to leave teaching within the next five years and various characteristics of teachers (such as gender, age, working hours and type of contract), a simple binary logistical regression model has been used, based on data from TALIS 2018 (OECD, 2020[5]). Subjective characteristics such as level of stress and satisfaction (including both satisfaction with the work environment and the profession) were also included, as these factors tend to play an important role in teachers’ decision to leave teaching (OECD, 2020[5]). Indeed, a study showed that teachers in England (United Kingdom) with higher job satisfaction were less likely to actually leave teaching by the following academic year (Sims and Jerrim, 2020[6]).
Demographic characteristics: Age and gender
Not surprisingly, the results of the analysis clearly show that teachers who are closer to retirement (aged 55 or over) are also more likely to leave teaching in the next five years compared to teachers who are in the middle of their careers (aged 25-54), all other characteristics the same (and this follows for all of the following analyses). However, across OECD countries and economies with data, there are some differences in trends across age groups below age 55. For example, in about one-third of the countries (Austria, Belgium, Chile, Denmark, Finland, Hungary, the Netherlands, New Zealand, Slovenia and Sweden), the likelihood for a teacher to leave teaching in the next five years is statistically similar across the three age groups between 25 and 54 (25-34, 35-44 and 45-54 year-olds). In contrast, in Korea and Turkey, the likelihood is the lowest for the youngest teachers (25-34 year-olds) and increases for older age groups (Figure D7.3).
Gender differences in the intention to leave teaching are significant in 12 out of 31 countries and economies with available data, but patterns are different across countries. Female teachers are at least 20% less likely to express their intention to leave teaching within the next five years than male teachers in Estonia, Finland, Norway and Portugal. In contrast, the likelihood is 1.4 to 2.6 times higher for female teachers than for male teachers in Colombia, Hungary, Japan, Korea, Lithuania, Mexico, the Russian Federation and Turkey (Figure D7.3).
Other observable characteristics: Type of contract and working hours
The decision to stop teaching could also vary depending on the type of contract teachers have and/or teachers’ total amount of working hours.
The likelihood of part-time teachers who expressed their intention to leave teaching within the next five years was higher than that of full-time teachers in 11 countries, while the opposite is observed in Mexico (Figure D7.3). Several reasons could explain why part-time teachers are more likely than full-time teachers to express their intention to leave teaching. For instance, soon-to-retire teachers could be reducing their workload or teachers choose to work part-time due to personal reasons that may eventually lead them to leave the profession.
Fixed-term contracts allow flexibility in managing teacher supply, for example to relieve bottlenecks in the recruitment processes or to fill vacancies due to a high number of retiring teachers (European Commission/EACEA/Eurydice, 2021[7]). Also, fixed-term contracts may be a usual type of contract for novice teachers until they eventually receive permanent contracts. Indeed, in many countries, there is no statistically significant relationship between the type of contract teachers have and their intention to leave teaching in the next five years. Nevertheless, the type of contract is significantly associated with teachers’ intention to leave teaching within the next five years in five countries (Figure D7.3).
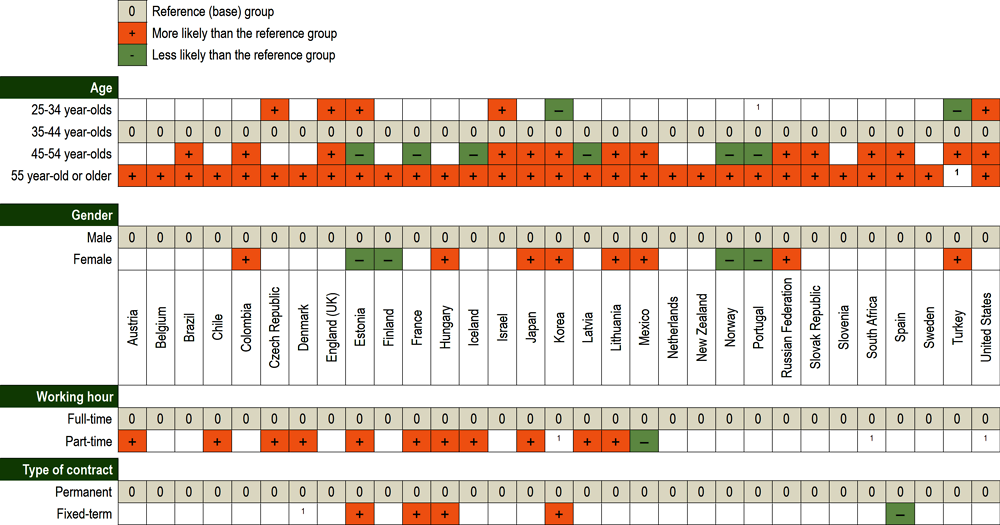
How to read this figure: A plus sign (+) indicates that, compared to the base group, the likelihood of teachers in the specific category expressing the intention to leave teaching in the next five years. For example, in nearly all countries and economies shown in the figure, teachers aged 55 or older are more likely to express their intention to leave teaching in the next five years than teachers aged 35-44, all other characteristics considered the same (i.e. gender, working hours, type of contract, level of stress and satisfaction with the work environment and the profession).
Note: Only the direction of statistically significant results are indicated, not their magnitude. Results are reported only when the share of teachers in the category is over 5% of the total teacher sample. Base group is teachers aged 35-44, male, working full time and with a permanent contract. The model already controls for level of stress and satisfaction with the work environment and the profession. Target population of TALIS 2018 is teachers who teach regular classes in ordinary schools. Some groups of teachers that are taken into account in the Teacher Attrition Survey (e.g. teachers on long-term leave, teachers who work as school principals and substitute teachers) are not included in TALIS 2018. In addition, TALIS data were collected in 2018 before the COVID-19 pandemic. Teachers may answer questions on their intention to stay in teaching differently in the current context than they did in 2018.
1. Proportion of sample is less than 5% of the total sample.
Countries and economies are listed in alphabetical order.
Source: Recalculated from TALIS 2018.
Among the 14 countries and economies with available data, the extent of the gender difference in teacher attrition rates in public institutions varies across countries. Gender differences in attrition rates exceed 5 percentage points in Estonia, but are less than 3 percentage points in other countries and economies. In Brazil, Colombia and Ireland, the attrition rate of female teachers in public institutions is larger than that of their male colleagues, though the extent of the difference is less than 1 percentage point. In 11 countries and economies with data on all types of institutions combined, the pattern of gender difference is more consistent than that of public institutions: attrition rates of male teachers are equal to or higher than than those of female colleagues (Table D7.1).
Higher attrition rates among male teachers compared to female teachers may not lead to high attrition rates for all teachers combined, due to the smaller proportion of male teachers in the teaching profession. For example, in Estonia, while attrition rates of male teachers in public institutions are 9.3%, the attrition rate of all teachers is 4.8%, as only 17% of teachers are male at primary and secondary levels combined (Table D7.1 and Education at a Glance Database (OECD, 2021[8])).
The higher attrition rate of male teachers may increase the gender imbalance in the teaching profession that is already observed in many OECD countries. In fact, between 2005 and 2019, the share of female teachers in the teaching profession in primary and secondary levels combined increased from 69% to 72% on average for all OECD countries with data (see Indicator D5). A gender imbalance in itself may not be a critical problem, as its impact on students’ performance is unclear (Cho, 2012[9]). Nevertheless, the higher attrition rate of male teachers may signal other reasons, which implicitly differ between gender (e.g. flexibility in working arrangements, social perceptions of teaching jobs, differences in relative salaries to similarly educated workers in the labour market), that better explain why certain groups of teachers leave the teaching profession (see Box D3.3 for teachers’ actual salaries relative to earnings of tertiary-educated workers and Box D5.1 for potential sources and implications of gender imbalances in the teaching profession).
Attrition by age group
Regardless of the type of institution, teachers of different age groups show varying levels of attrition, which may reflect differences in expectations of staff from their jobs and also the situation of the job market. Among countries with available data, attrition rates are high for younger age groups (aged 24 or below and 25-34 year-olds), reach the lowest levels during the mid-career years (35-44 year-olds and 45-54 year-olds), then increase again when teachers approach legal retirement age (aged 55 or over). The general trend is similar across all countries with available data, though there are some differences due to differences in the education systems (Figure D7.4).

Note: Positive values indicate that attrition rates are higher for the selected age group than for teachers aged 35-44. Negative values indicate that attrition rates are lower for the selected age group than for teachers aged 35-44.
1. The coverage differs from the indicated coverage. Refer to the source table for details.
2. Reference year differs from 2016. Refer to the source table for details.
Countries and economies are ranked in descending order of the difference of attrition rates between teachers in the youngest age group (under the age of 25) and teachers aged 35-44 in public institutions.
Source: OECD (2021), Table D7.1. See Source section for more information and Annex 3 for notes (https://www.oecd.org/education/education-at-a-glance/EAG2021_Annex3_ChapterD.pdf)
Among the countries and economies with available data, attrition rates of teachers in the youngest age group (aged 24 or below) are the highest among all the age groups in 5 out of the 12 countries and economies with data (Austria, Brazil, Finland, Norway and Sweden) (Figure D7.4). In these countries, attrition rates for the youngest age group are 20-40 percentage points higher than those of teachers aged 35-44 (Table D7.1). The prevalence of short-term contracts and lack of qualification as fully qualified teachers for teachers of younger ages may explain the high attrition rates of the youngest age group in some of these countries. For example, in Austria, teachers usually begin their teaching career under fixed-term contracts up to five years. In Sweden, a large proportion of young teachers have short-term contracts and/or are not yet qualified for the national teacher certification, which is required for a permanent contract. Other plausible reasons for high attrition among younger teachers could be that young teachers realise that the teaching profession does not meet their expectations or the fact that female teachers may leave the teaching profession to care for their young children.
However, the level of attrition among the youngest age group needs to be interpreted with caution in some countries, considering the small absolute number of teachers included in this group. For example, many teachers in Finland begin their teaching career beyond age 25, because the minimum qualification required for primary and secondary teachers is a master’s qualification (ISCED 7) for most teachers. Consequently, teachers aged 24 or below make up only about 1% of all teachers in pre-primary to upper secondary levels combined and high levels of attrition will not translate into a large number of teachers leaving the profession.
In contrast, the attrition rate of teachers in the oldest age group (aged 55 or older) is the highest among all age groups in Chile, the Flemish and French Communities of Belgium, England (United Kingdom) and Ireland, regardless of the type of institution (Figure D7.4). In most countries, legal retirement ages are 60 or over, though there can be some differences between teachers (e.g. depending on gender or year of birth) and prerequisite conditions (see Annex 3 for more information). The younger legal retirement age (55 in Ireland) and existence of pre-retirement systems allowing teachers to prepare for retirement before they reach the legal retirement age (the Flemish and French Communities of Belgium and England (United Kingdom)) could contribute to explain high attrition rates in the oldest age group.
Attrition by level of education
The variation of attrition rates by level of education differs across the countries and economies with available data. For example, for teachers in public institutions, differences in attrition rates between primary and secondary education is less than 1 percentage point in Brazil, whereas the difference exceeds 4 percentage points in Lithuania (Figure D7.5).
Among the 11 countries and economies with available data, no specific level of education shows a particularly high level of attrition compared to the other levels of education. However, regardless of the type of institution, attrition rates at pre-primary level are either similar (e.g. Colombia) or higher than those at the primary level (e.g. Finland, Lithuania) in all countries and economies with available data (Figure D7.5).
In seven out of the ten countries and economies with available data, attrition rates for teachers in lower and upper secondary education combined is higher than that of teachers in primary education (Figure D7.5). In these countries, statutory work requirements (e.g. number of annual statutory working hours, task requirements) do not vary greatly between primary and secondary levels (OECD, 2016[10]). However, differences in teaching load or difficulty, actual working conditions, and/or relative salary level between the two levels may help to explain why attrition rates are higher at the secondary level than the primary level.

Note: Positive values indicate that attrition rates are higher for teachers at the selected level than at the primary level. Negative values indicate that attrition rates are lower for teachers at the selected level than at the primary level.
1. The coverage differs from the indicated coverage. Refer to the source table for details.
2. Primary level includes pre-primary level.
3. Reference year differs from 2016. Refer to the source table for details.
Countries and economies are ranked in descending order of the difference of attrition rates between primary school teachers and secondary school teachers (lower and upper secondary levels combined) in public institution.
Source: OECD (2021), Table D7.2. See Source section for more information and Annex 3 for notes (https://www.oecd.org/education/education-at-a-glance/EAG2021_Annex3_ChapterD.pdf).
Attrition rate is the percentage of teachers at a given level of education permanently leaving the teaching profession during the reference period.
Reference period in this indicator refers to a period between the consecutive time points when the number of teachers is counted for the school year.
Temporary leave in this indicator refers to any form of leave during which teachers are identified “temporarily not at work” as defined in the UNESCO-UIS/OECD/Eurostat data collection on education statistics when counting the number of teaching personnel.
The indicator covers the most aggregated level of education from pre-primary to upper secondary education in headcount numbers. Most of the analysis is based on the method proposed in the Sustainable Development Goal project, unless stated otherwise.
Please see Annex 3 for more information on other estimation methods used in this indicator and for country-specific notes.
Sixteen OECD and partner countries and economies contributed to this indicator: Austria, the Flemish and French Communities of Belgium, Brazil, Chile, Colombia, England (United Kingdom), Estonia, Finland, Ireland, Israel, Lithuania, the Netherlands, Norway, Sweden, and the United States.
Data are from the 2020 OECD-INES NESLI survey on teacher attrition, which refer to the school year 2015/16 (or 2016 for southern hemisphere countries).
References
[3] Ávalos, B. and J. Valenzuela (2016), “Education for all and attrition/retention of new teachers: A trajectory study in Chile”, International Journal of Educational Development, Vol. 49, pp. 279-290, https://doi.org/10.1016/j.ijedudev.2016.03.012.
[9] Cho, I. (2012), “The effect of teacher-student gender matching: Evidence from OECD countries”, Economics of Education Review, Vol. 31/3, https://doi.org/10.1016/j.econedurev.2012.02.002.
[7] European Commission/EACEA/Eurydice (2021), Teachers in Europe: Careers, Development and Well-being, Publications Office of the European Union, Luxembourg.
[8] OECD (2021), “Educational personnel by institution”, Education at a Glance Database, http://stats.oecd.org/Index.aspx?datasetcode=EDU_PERS_INST (accessed on 12 May 2021).
[11] OECD (2020), Education at a Glance 2020: OECD Indicators, OECD Publishing, Paris, https://dx.doi.org/10.1787/69096873-en.
[5] OECD (2020), TALIS 2018 Results (Volume II): Teachers and School Leaders as Valued Professionals, TALIS, OECD Publishing, Paris, https://dx.doi.org/10.1787/19cf08df-en.
[10] OECD (2016), Education at a Glance 2016: OECD Indicators, OECD Publishing, Paris, https://doi.org/10.1787/eag-2016-en.
[6] Sims, S. and J. Jerrim (2020), “TALIS 2018: Teacher working conditions, turnover and attrition”, statistical working paper, UK Department for Education, https://assets.publishing.service.gov.uk/government/uploads/system/uploads/attachment_data/file/873922/Teaching_and_Learning_International_Survey_2018_March_2020.pdf (accessed on 19 March 2021).
[2] UNESCO (2018), Global Education Monitoring Report 2019: Migration, Displacement and Education - Building Bridges, Not Walls, UNESCO, Paris, https://unesdoc.unesco.org/ark:/48223/pf0000265866 (accessed on 19 March 2021).
[1] UNESCO-UIS (2019), SDG 4 Data Digest: How to Produce and Use the Global and Thematic Education Indicators, UNESCO Institute for Statistics, Montreal, http://uis.unesco.org/sites/default/files/documents/sdg4-data-digest-2019-en_0.pdf (accessed on 19 March 2021).
[4] Weiss, E. (1999), “Perceived workplace conditions and first-year teachers’ morale, career choice commitment, and planned retention: A secondary analysis”, Teaching and Teacher Education, Vol. 15/8, pp. 861-879, https://doi.org/10.1016/S0742-051X(99)00040-2.
Cut-off date for the data: 17 June 2021. Any updates on data can be found on line at: https://doi.org/10.1787/eag-data-en. More breakdowns can also be found at: http://stats.oecd.org, Education at a Glance Database.
Table D7.1. Teacher attrition rates in pre-primary to upper secondary education, by gender and age group (2016) |
|---|
By type of institutions, based on indirect measure of teachers leaving the teaching profession, in headcounts |
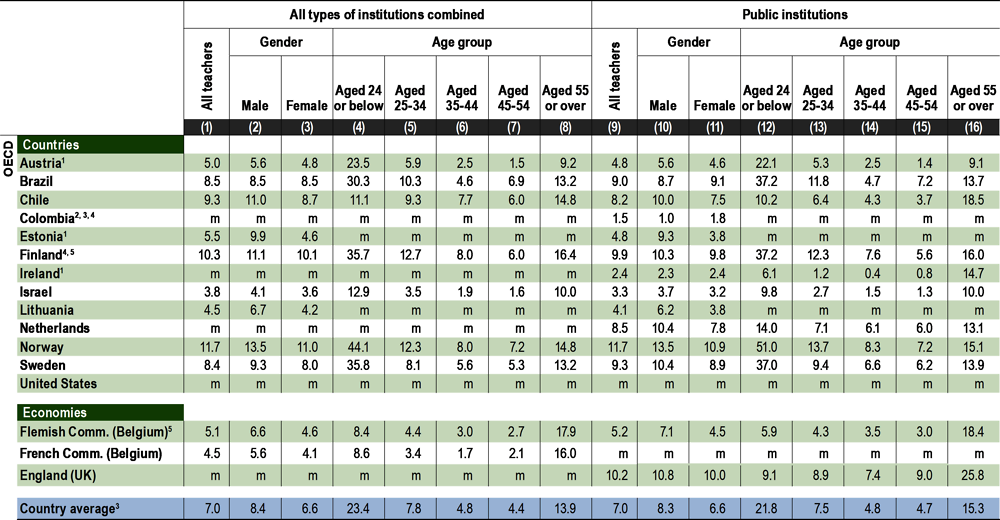 |
Note: See Definitions and Methodology sections for more information. |
4. Year of reference 2017 for Finland and 2018 for Colombia. |
Source: OECD (2021). See Source section for more information and Annex 3 for notes (https://www.oecd.org/education/education-at-a-glance/EAG2021_Annex3_ChapterD.pdf). Please refer to the Reader's Guide for information concerning symbols for missing data and abbreviations. |
Table D7.2. Teacher attrition rates by level of education (2016) |
|---|
By type of institution, based on indirect measure of teachers leaving the teaching profession, in headcounts |
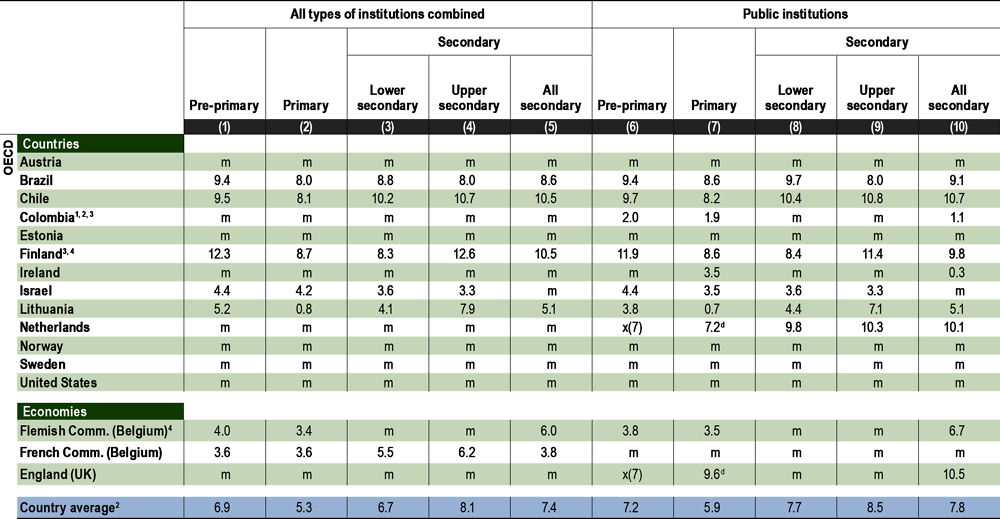 |
Note: Revised calculation method was used to minimise bias from teachers moving between different levels of education. See Definitions and Methodology sections for more information. |
3. Year of reference 2017 for Finland and 2018 for Colombia. |
4. Upper secondary education includes post-secondary non-tertiary education. |
Source: OECD (2021). See Source section for more information and Annex 3 for notes (https://www.oecd.org/education/education-at-a-glance/EAG2021_Annex3_ChapterD.pdf). Please refer to the Reader's Guide for information concerning symbols for missing data and abbreviations. |