Chapter 2. Improving well-being through migration
New Zealand’s immigration system aims to enhance well-being by promoting economic development, reuniting families and meeting humanitarian objectives. Immigration is high and residence admissions are focused on the high skilled to enhance economic outcomes. Empirical evidence suggests that immigration has had small positive effects on per capita incomes and has not adversely affected the wage or employment outcomes of the average NZ-born worker. However, temporary migration has had small negative impacts on new hires of some groups of people, notably social welfare beneficiaries not in the (16) most urbanised areas. Immigrants have high well-being outcomes on average but suffer an initial shortfall in employment and wages relative to the comparable NZ-born. New Zealand has refined the migration system over the years to attract those who are more likely to ease labour shortages and, should they apply for residence, have better earnings prospects. It has also deployed settlement and integration programmes to improve labour market and other outcomes that affect well-being. This chapter looks at further adjustments to the system to enhance its well-being benefits for both the NZ-born and immigrants.
New Zealand has experienced high emigration and immigration in recent decades. Emigration picked up in the late 1960s, when income levels in New Zealand slipped below those in Australia, and subsequently grew as New Zealand’s economic performance deteriorated relative to that in Australia and other English-speaking countries. Partly in response, and in the context of a wider structural reform programme to improve economic performance, immigration policy was overhauled in the late 1980s and early 1990s to attract many more high-skilled immigrants. Immigration has been high since then, more than compensating for the population loss and brain drain through emigration in most years.
Immigration has had small positive effects on GDP per capita and has not adversely affected wage or employment opportunities of the average NZ-born worker (Brunow, Nijkamp and Poot, 2015[1]; Maré and Stillman, 2009[2]). Temporary migration has had some positive effects on the earnings of New Zealanders 25 years and older, but not of youth (Ministry of Business, Innovation and Employment, 2018[3]). Immigration has also had favourable effects on government finances overall, although not at the local government level. On the other hand, infrastructure and housing supply have not kept pace with the demand generated by high net migration, resulting in traffic congestion, water pollution and large increases in house prices, which has redistributed wealth to property owners from non-property owners, who tend to be less well off; this issue is discussed in the next chapter. More research is needed to understand fully the wider well-being impacts of immigration on the local population.
Immigrants in New Zealand tend to experience similar well-being outcomes to the native-born, whereas in most other OECD countries they have mostly worse outcomes. They and their children are better integrated into society on a variety of indicators than in most other countries (OECD and European Union, 2015[4]). Immigrants’ children succeed well in education and the labour market. Immigrants selected for their skills earn substantially more than other immigrants, indicating that selection effectively identifies immigrants with the greatest potential for labour market integration.
As in other countries, immigrants initially tend to perform less well in the labour market than the comparable native-born but in most cases gradually close the gap. Enhancing their labour market outcomes would increase their well-being and that of others, through higher productivity and stronger government finances. New Zealand has refined immigrant selection over the years to favour those with better earnings prospects and has deployed settlement and integration programmes to improve labour market and other outcomes. Further adjustments to immigration policy and integration programmes would enhance migrant well-being with positive spill-overs to the well-being of the rest of the population.
After discussing migration trends and the main features of migration policy, this chapter reviews the effects of migration on per capita incomes, government budgets, and employment and wage outcomes of the NZ-born. The causes of the shortfall in immigrant labour market outcomes relative to those of the comparable NZ-born are addressed in the next section followed by a discussion of measures to improve immigrants’ labour market outcomes and other aspects of well-being. These broadly fall into the categories of selecting immigrants with better labour-market prospects and improving integration of those already in New Zealand.
Emigration has been high in recent decades
Emigration increased in response to better economic opportunities abroad
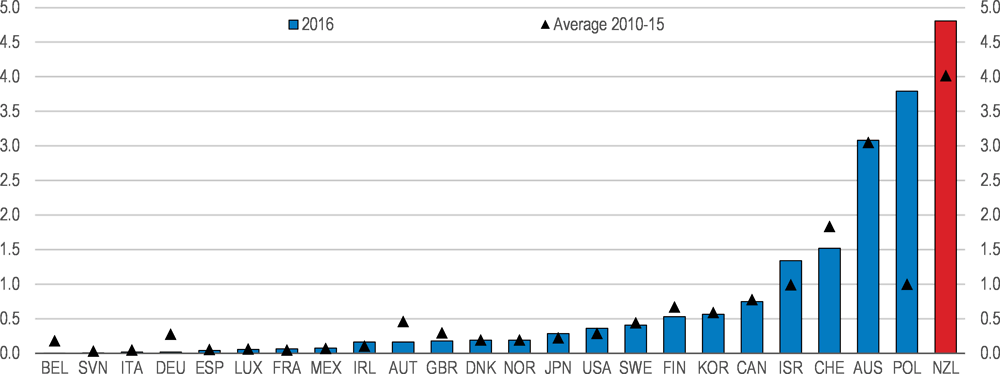
Emigration increased significantly from the late 1960s, when income levels in New Zealand started to fall below those in Australia, and soared in the 1970s and 1980s, when the income gap grew markedly (Figure 2.1 and Figure 2.2). Emigration to Australia, with which New Zealand has an agreement (1973 Trans-Tasman Travel Agreement (TTTA)) that allows New Zealanders and Australians to settle in each other’s country, accounted for most of the increase; the TTTA formalised practice since colonial times (Carmichael and Warwick, 1993[5]). Since the 1990s, incomes in Australia and New Zealand have broadly grown in line and emigration has declined, albeit with large fluctuations that depend on the relative states of the labour markets in the two countries. Even so, at around 1.3% of the population on average over the past four years, emigration remains high relative to the rate in Canada but, in contrast to earlier periods, is only somewhat higher than in Australia. Emigration to Australia has represented around 40% of total emigration in recent years, somewhat less than the long-run average, with the vast majority (80%) being New Zealand citizens. Emigration of non-NZ citizens has increased as a share of total emigration in recent years, largely reflecting substantial increases in temporary migration (see below).
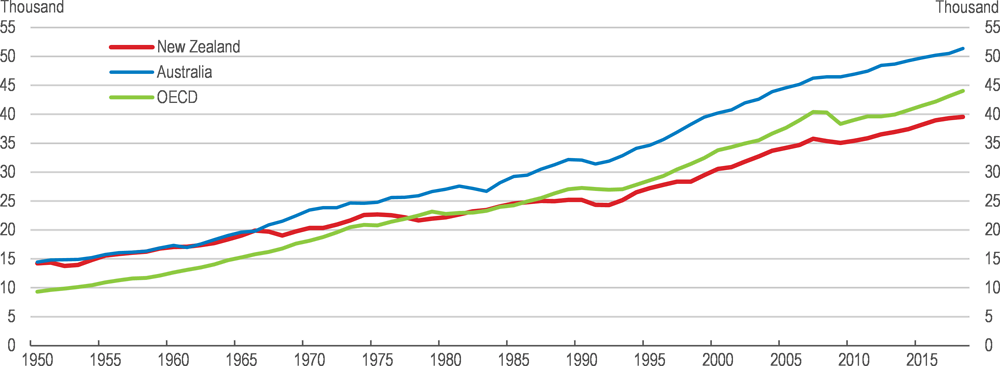
Source: The Conference Board, Total Economy database, April 2019.
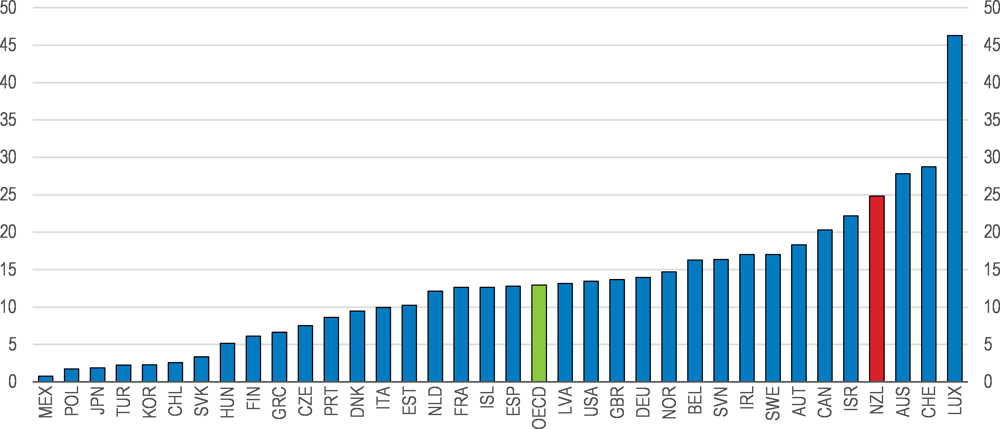
New Zealand’s diaspora has grown markedly in recent decades (Figure 2.3, Panel A) to one of the largest relative to population in the OECD (Panel B). In 2015/16, 583 thousand NZ-born people lived in other OECD countries, which at 13.5% of the national population was the fourth highest share among OECD countries. Most of New Zealand’s diaspora lives in Australia, followed by other English-speaking countries (Table 2.1). However, New Zealand’s diaspora outside Australia is inflated by many young New Zealanders living abroad for short periods. Over the past 20 years, around 90% of the 355 000 New Zealanders who departed for countries other than Australia were matched by New Zealanders returning. In contrast, most New Zealanders who depart for Australia don’t return, with arrivals of New Zealanders from Australia being only 34% of the 630 000 departures over the past 20 years. Over the past five years, net emigration of New Zealanders has fallen, with fewer departing for Australia and more returning from other countries.
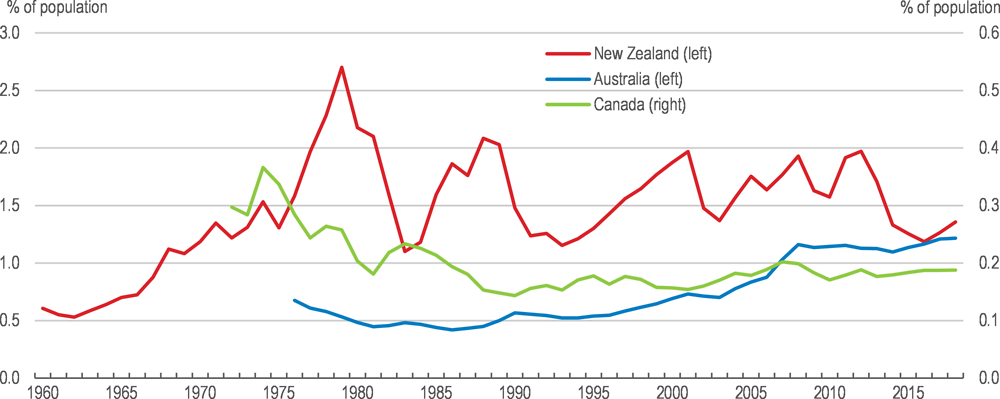
Source: Stats NZ; Statistics Canada; and Australian Bureau of Statistics.
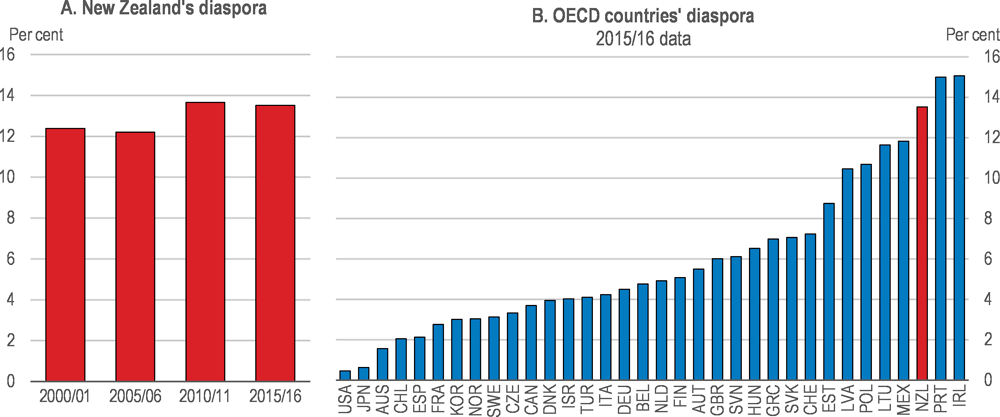
Source: Data on Immigrants in OECD Countries (DIOC) database.
High-skilled emigration is a drag on the economy
New Zealand’s diaspora is increasingly more highly educated than the NZ resident population. The share of New Zealand’s diaspora aged 15 and over with tertiary education attainment increased from 29% in 2000/01 to 39% in 2015/16, a higher rate than for the NZ resident population (29% in 2013). The tertiary attainment rate of the diaspora was only slightly higher in Australia than for the NZ resident population but was much higher in the other main destination countries (Table 2.1). As a share of the university-educated population in New Zealand, the university-educated diaspora was 15% in 2015/16, far higher than in other English-speaking countries except Ireland (14%); the corresponding shares for Australia, Canada, the United Kingdom and the United States were 3%, 4%, 11% and 1%, respectively.
Digging a little deeper into the education attainment of the New Zealand-born population in Australia, there appears to be something of a ‘trades drain’. The share of the NZ-born population aged 15 and over with post-secondary qualifications below university degree level is higher in Australia than in New Zealand (Table 2.2). By contrast, the share of the NZ-born with a Bachelor’s degree or higher is similar in Australia and New Zealand.
Salaries for persons with trades qualifications are 28% higher in Australia than New Zealand adjusting for differences in purchasing power, encouraging the NZ-born with these qualifications to emigrate there; pay differentials are smaller for occupations requiring fewer years of education and training (Table 2.3). In the other main countries to which New Zealanders emigrate, many such qualifications are unlikely to be sufficient to qualify for residence under their selective immigration rules. Earnings for people with university education attainment are considerably higher in most of the countries to which the NZ-born emigrate (Table 2.4), helping to explain the large share of the NZ-born with tertiary qualifications in these countries.
High-skilled emigration is also likely to cause skills shortages, disproportionately reduce high-skilled employment as complementarities between high-skilled jobs diminish and reduce agglomeration economies. The consequences of such effects are lower productivity and living standards.
Immigration is high with a focus on attracting high-skilled people
New Zealand has a managed immigration model that targets skilled people
New Zealand’s immigration system is predominantly aimed at increasing the well-being of permanent NZ residents (both NZ-born and immigrants) and is well run. It has a managed immigration model with defined legal pathways for people to come and live in the country. The immigration system has multiple and sometimes competing objectives in the areas of economic growth, social inclusion and resilience (Figure 2.4). While each government articulates the objectives of the immigration system differently, there has been little change in the overall themes in recent decades. Since the early 1990s, when the points-based system modelled on those in Australia and Canada was first adopted, there has been a strong skills focus. High-skilled immigration helps to mitigate the adverse economic effects of high-skilled emigration.
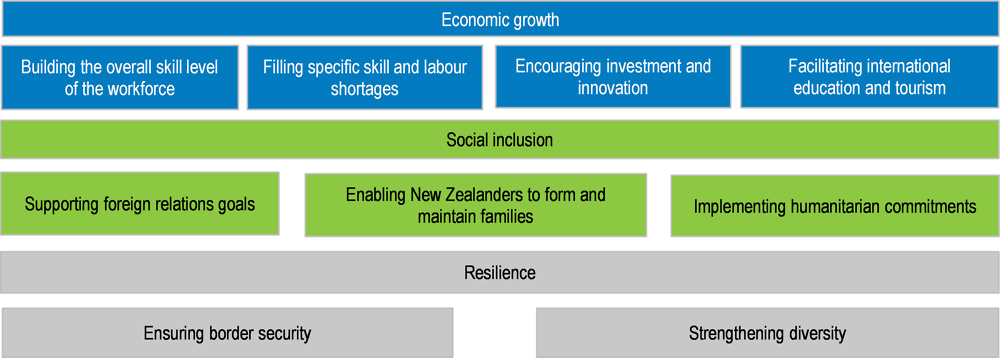
Source: The Treasury, direct submission to the OECD.
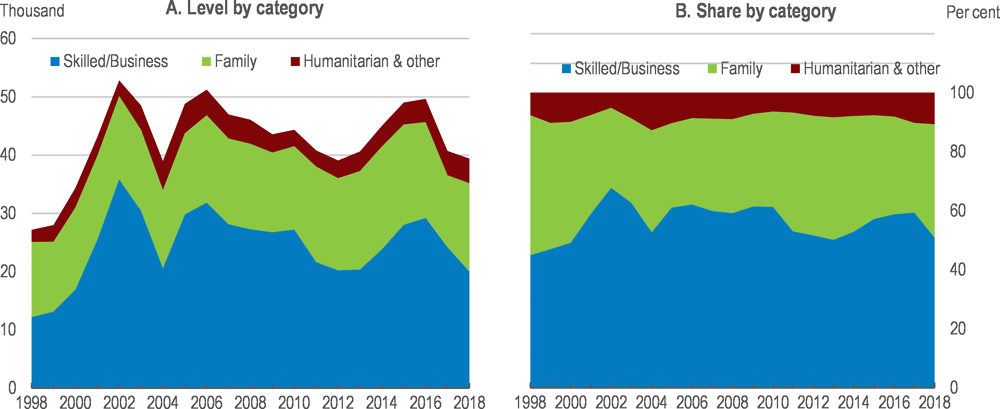
The government sets a planning range for resident admissions to achieve a pace and mix of immigration that is judged best to contribute to economic and social well-being. For 1 July 2018-31 December 2019, the planning range is 50 000 to 60 000 resident admissions (around 0.7% of the population at an annual rate) (Table 2.5). The number of annual admissions increased in the early 2000s and has since fluctuated around current levels (Figure 2.5, Panel A). At the same time, the skilled migrant share increased to around the current level (Panel B), which is one of the highest shares in the OECD (Figure 2.6). Skilled migrant principal applicants make up about one third of the skilled intake. Spouses/partners of skilled principal applicants also tend to be well educated. The refugee intake is to rise from 1 000 per year currently, which is low as a share of the population by international comparison, to 1 500 in 2020.
The existing residence planning range and streams structure is to be replaced from 1 January 2020 by a framework in which the government controls residence numbers and priorities directly through forecast individual policy settings for each of the individual categories in the New Zealand Residence Programme streams. This change will end the need to vary admission criteria (and hence immigrant quality) in the Skilled Migrant category, which is the main stream that can be readily adjusted, to conform to the overall planning range.
Note: Ending-June data.
Source: Ministry of Business, Innovation and Employment (2019), Migration Data Explorer.
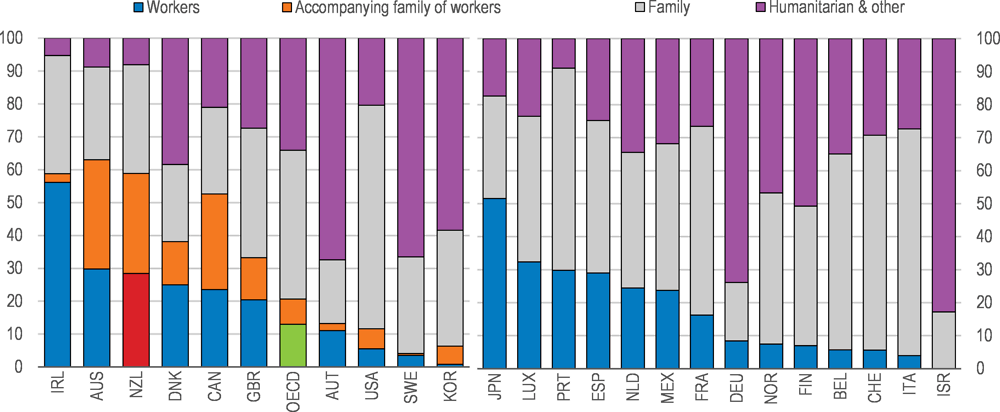
← 1. Countries that do not separately identify accompanying family of workers are shown on the right-hand side of the figure. In these countries, accompanying family of workers are included in the family category.
Source: OECD (2018), International Migration Outlook 2018, Annex Table 1.A.2.
Temporary immigration has expanded markedly over the past two decades
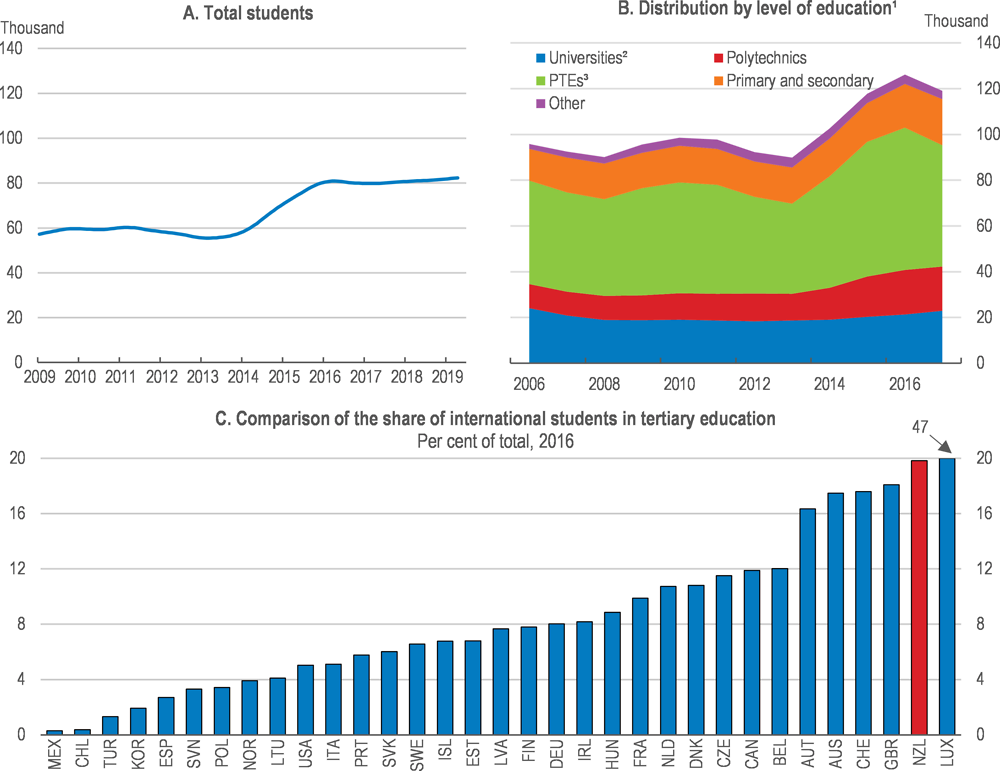
Following a period of consolidation after the sharp increases in the late 1990s and early 2000s, the number of student visa holders has increased by one third since 2014 (Figure 2.7, Panel A). Three quarters of students are at post-secondary level (Panel B). Polytechnics and private training establishments have increased their shares of international students in recent years while universities have lost share. New Zealand has the second highest share of international students in tertiary education (20%) in the OECD (Panel C). International education has grown to be the fifth biggest export sector in New Zealand. It is also an important route for attracting skilled immigrants well acquainted with life in New Zealand – more than 30% of international students stay in New Zealand after their studies to work, at least temporarily.
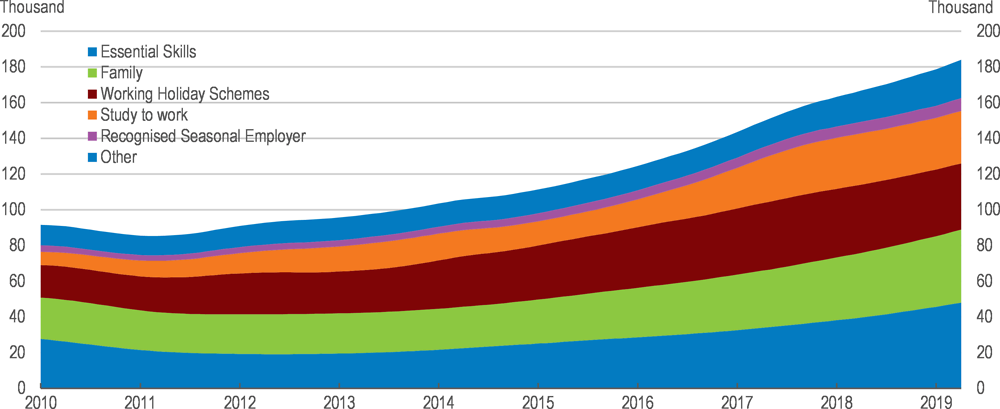
Temporary work migrant numbers have soared during the past decade (Figure 2.8). The largest contribution to the increase in the stock came from Study to Work visas, which allow international students who have graduated to work in New Zealand for up to three years. The aim of this scheme is to enable former international students who want to stay in New Zealand to gain skilled work experience to help them to qualify for residence. Despite having grown more slowly than the other temporary work visa categories, Essential Skills migrants remain the largest temporary work migrant group. The Essential Skills scheme is a labour market tested policy that allows New Zealand’s employers to recruit workers from abroad to meet shortages they cannot fill locally. In 2016/17, almost two thirds of Essential Skills workers were in medium- to high-skilled occupations according to the ANZSCO (levels 1-3 on a scale up to 5, with level 1 being the highest skill level). This scheme is undoubtedly an important part of the response to the ‘trades drain’ to Australia. It is also the cornerstone of New Zealand’s immigration system, as more than half of new permanent migrants had such a visa at some stage (OECD, 2014[6]). In all, temporary labour migrants represent almost 5% of the labour force in New Zealand, by far the highest share among OECD countries (Figure 2.9).
1. International fee-paying students.
2. Includes Colleges of Education.
3. PTEs (Private Training Establishments) are tertiary education providers privately owned. They are registered by NZQA and to enrol international students, they must be signatories to the Code of Practice for the Pastoral Care of International Students.
Source: Ministry of Business, Innovation and Employment, https://www.educationcounts.govt.nz/statistics/international-education/international-students-in-new-zealand; OECD, Education database.
Source: Ministry of Business, Innovation and Employment, https://mbienz.shinyapps.io/migration_data_explorer/.
Note: The data consist of inflows of seasonal and non-seasonal (interns, intra-company transfers and working holidays) foreign workers who obtained a working visa.
Source: OECD, International Migration database and Annual Labour Force Statistics database.
Net migration contributes to high population growth and ‘brain exchange’
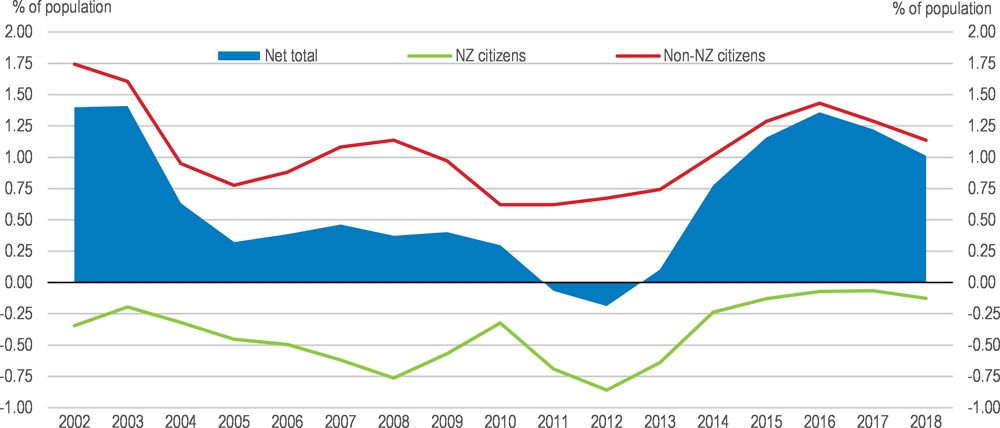
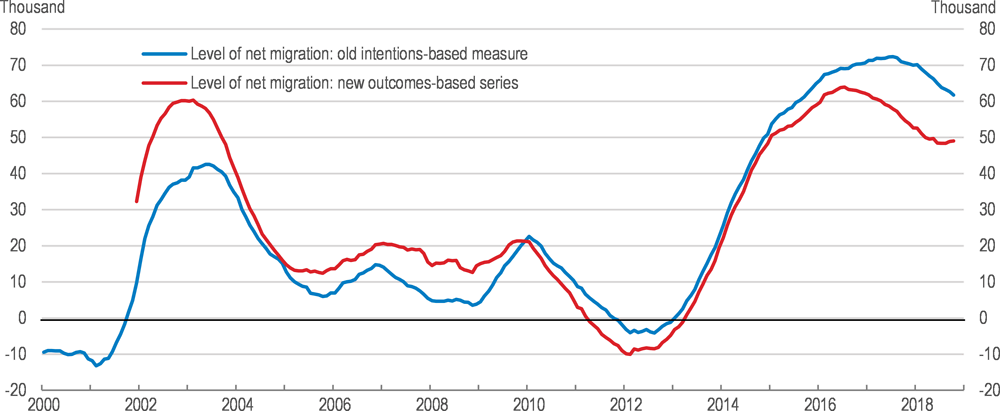
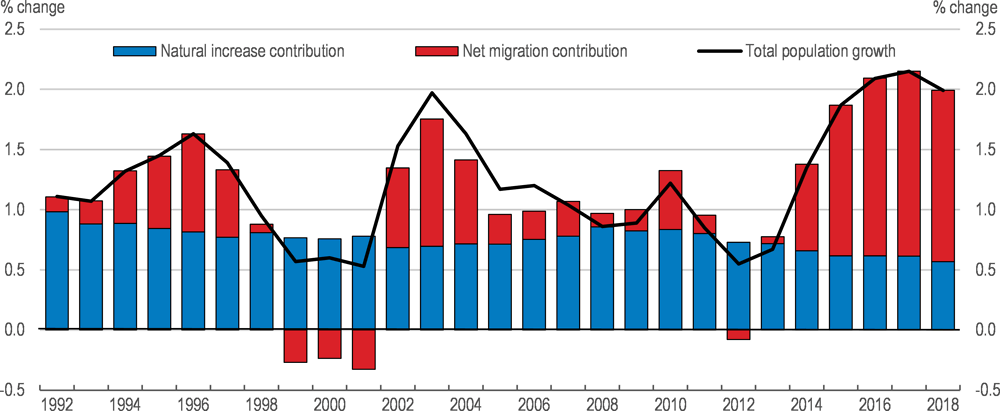
Net permanent and long-term migration has soared in recent years, peaking at 63 948 (1.4% of the total population; positive values reflect an inflow) in the year to July, 2016, well above the yearly average of 29 000 since 2002 (Figure 2.10); the methodology for collecting migration data has been overhauled, resulting in lower estimated net migration flows in recent years, as shown in Figure 2.10, than in the old intentions-based series (Box 2.1). Around one half of this net inflow went to Auckland (this share is likely to be somewhat lower when new, regional outcomes-based data become available), accentuating pressures on its housing market (see Chapter 3). The surge reflected simultaneous peaks in net migration of both NZ and non-NZ citizens, which is unusual. Net migration of NZ citizens increased to around zero as labour market conditions in Australia deteriorated relative to those in New Zealand following the end of the Australian mining boom. Net migration of non-NZ citizens peaked at a higher level than in the previous cycle a decade ago but at a lower level than in the early 2000s. Net migration has contributed around 30% of annual population growth on average since the early 1990s, but has become the dominant driver in recent years (Figure 2.12) (albeit somewhat less so when the new outcome-based data are integrated).
Statistics New Zealand recently overhauled its approach to measuring migration flows. Previously, net migration estimates were based on peoples’ stated intentions on immigration arrival and departure cards. This approach ended in October 2018 with the removal of the requirement for travellers to complete departure cards. Under the new outcomes-based measure, border crossings are used to estimate how long people actually spend in New Zealand, giving a more accurate measure of actual rather than expected migration flows. However, it takes 17 months to finalise outcomes-based measures, so the most recent 16 months of data are provisional estimates constructed using a statistical model, with estimates for recent months subject to substantial uncertainty.
In principle, the change in approach could either increase or decrease measured migration, but in practice it has led to a substantial downward revision in net immigration over the past four years, when net inflows were 41 000 less than previously thought (Figure 2.11). Consequently, growth in the working-age (and total) population, employment, household disposable income and new demand for housing has been lower than previously thought, as has household saving. Concomitantly, labour productivity has been higher.
Note: Cumulative data for the past four quarters. Before June 2014, the outcomes-based series has been extended using Stats NZ's discontinued experimental series.
Source: Stats NZ and Reserve Bank of New Zealand.
Note: Net migration is based on the old intentions-based series.
Source: Stats NZ, Estimated Resident Population Change - End-March data, Table DPE069AA.
High-skilled immigration has more than offset New Zealand’s brain drain, resulting in a ‘brain exchange’. As a share of New Zealand’s population aged 15 or over in 2015/16, immigrants comprised 40% of those with high (i.e., tertiary) education while NZ citizens with high education living abroad (i.e., emigrants) represented 21% (Table 2.6). Thus, net migration accounted for 19% of the population aged 15 or over with high education. By contrast, net migration only represented 11% of the population with less than tertiary attainment.
Net inward migration is essential to working-age population growth over coming decades. Without it, New Zealand’s working-age population (15-64 years) would decline by 7% over 2016-68 in Statistics New Zealand’s (2016[7]) population projection compared with an increase of 42% in a high immigration scenario (30 000 per year).
Nevertheless, while net immigration helps to mitigate population ageing, it only has a small effect on the age structure of the population in the long run because immigrants age too. While the old-age dependency ratio increases from 23% to 54% in the zero net immigration scenario, it still rises to 45% in the high net immigration scenario. Consequently, net immigration can only help to mitigate the fiscal effects of population ageing, not largely offset them.
Migration is increasing the cultural diversity and education attainment of New Zealand’s population
Immigrants have become a large and increasingly culturally diverse part of New Zealand’s population
The share of immigrants in New Zealand’s population has increased by one-half since the mid-1990s to 25% in 2016, one of the highest in the OECD (Figure 2.13). Almost half of the population is foreign-born in Auckland, where most immigrants settle. In 2014, one quarter of New Zealand’s foreign-born population was born in the United Kingdom, by far the largest immigrant group, reflecting historical immigration patterns (Table 2.7). The next largest groups were from China and India. In terms of flows, China, India and the United Kingdom are the largest immigrant source countries. Birthplace diversity, which may positively affect economic prosperity (Alesina, Harnoss and Rapoport, 2016[8]), is moderate by international comparison for the stock of immigrants but higher for recent arrivals (Figure 2.14).
Note: 2015 for Chile, Greece, Mexico, Portugal and 2011 for Poland. For Japan and Korea, the data refer to the foreign population rather than the foreign-born population. The OECD is a simple average based on rates presented.
Source: OECD (2018), International Migration Outlook 2018, Table A.4 and Figure 1.12.
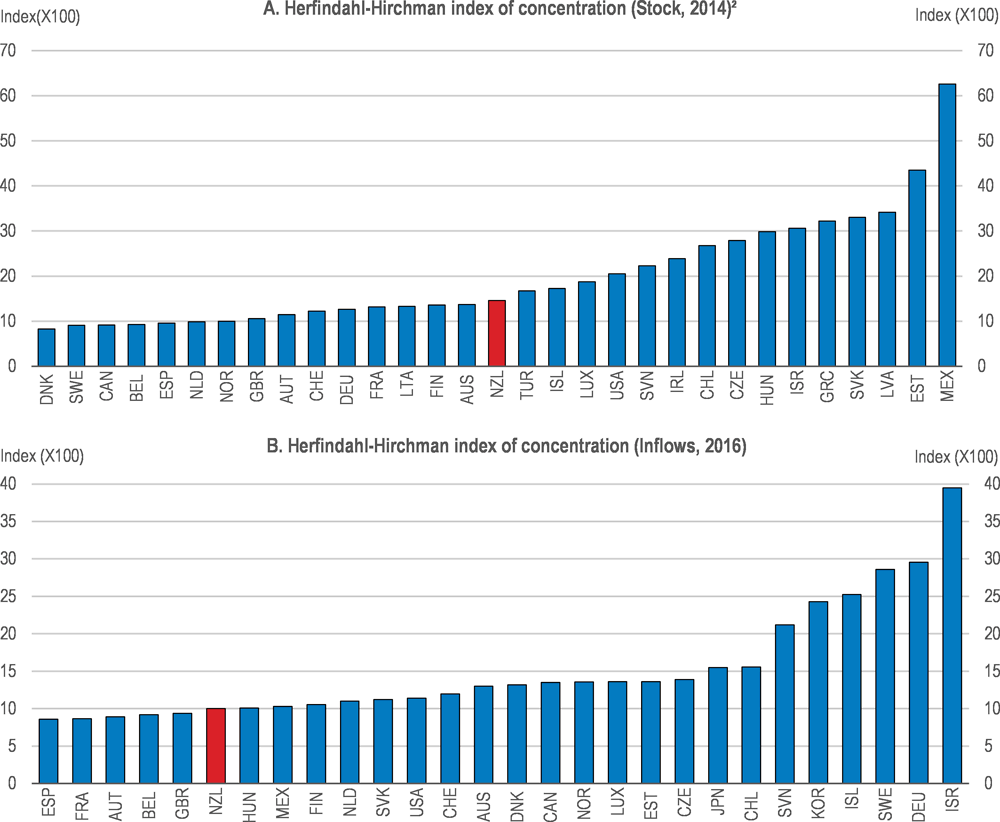
1. Diversity is measured by one minus the Herfindahl-Hirchman (HH) index of immigrant birthplace concentration. Thus, a higher HH index value corresponds to lower birthplace diversity.
2. 2015 for Greece and Ireland, 2013 for Chile and France, 2012 for Canada and 2011 for the Czech Republic.
Source: OECD, International Migration Outlook 2018, Statistical Annex, Table B.1 and B.4; and OECD calculations.
Immigrants and their children are more highly educated than the native-born population
Immigration is increasing the average education attainment of the NZ population (Figure 2.15, Panel A). A considerably higher share of immigrants than the NZ-born have tertiary attainment, reflecting the effectiveness of the immigration system in attracting such immigrants. Immigrants also boast higher literacy scores in New Zealand than in any other OECD country, contributing to a narrow gap in scores between the native-born and immigrants by international comparison (Panel B).
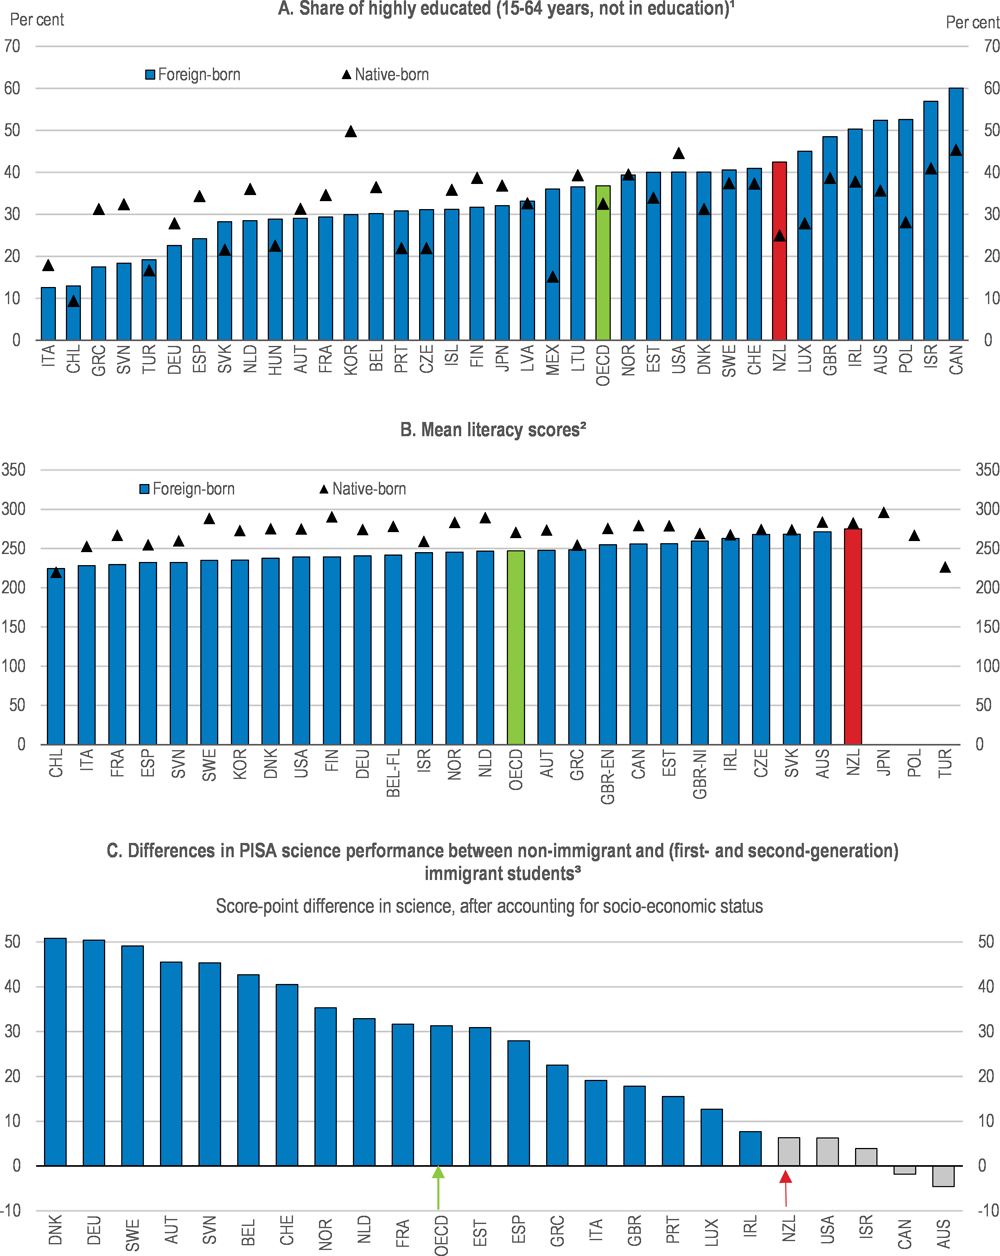
1. Highly-educated is tertiary (ISCED 5-8) attainment. Canada and New Zealand include people still in education. Immigrants are determined on the basis of nationality in Japan.
2. BEL-FL corresponds to Flanders, GBR-EN to England and GBR-NI to Northern Ireland.
3. A positive score indicates better performance for non-immigrants than immigrants. The blue bars denote that they are statistically significant and the grey bars that they are not.
Source: OECD (2018), Settling In 2018: Indicators of Immigrant Integration; OECD (2016), Skills Matter: Further Results from the Survey of Adult Skills, Annex A; OECD, Survey of Adult Skills (PIAAC) (2012, 2015); OECD (2016), PISA 2015 Results (Vol I): Excellence and Equity in Education.
Immigrants’ children also succeed well in education. Their PISA results are on a par with those for non-immigrant children controlling for socio-economic background, whereas in most other countries their scores are lower (Panel C). Among immigrant groups, Asian students do well and Pasifika students less so (May, Flockton and Kirkham, 2016[9]). Education attainment of second-generation immigrants is higher than for the native-born (OECD and European Union, 2015[4]).
Immigrants in New Zealand have high levels of well-being
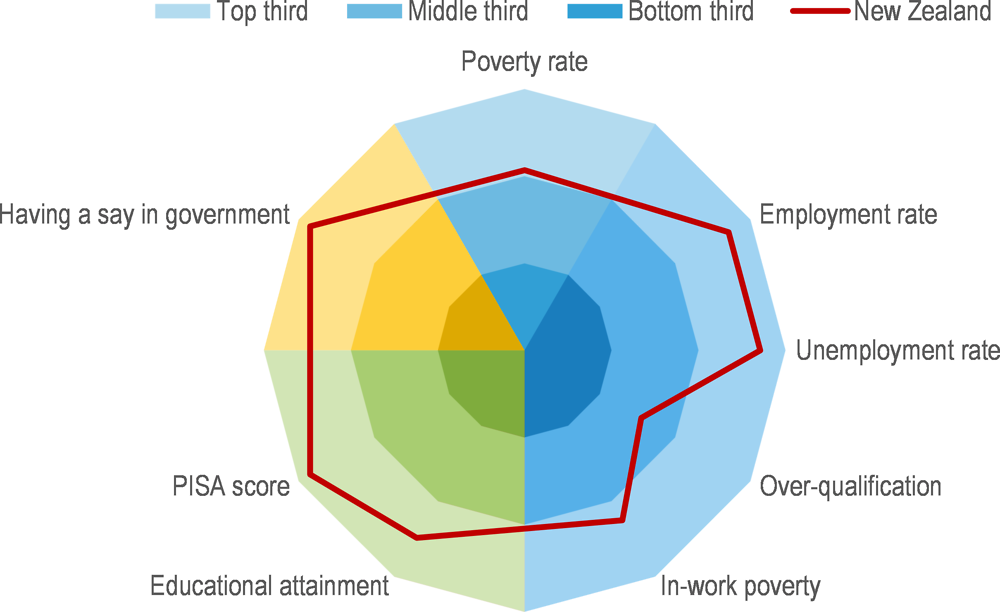
Immigrants in New Zealand tend to have better well-being outcomes than those living in other OECD countries. Compared with immigrants in other countries, immigrants in New Zealand rank in the top third of OECD-country immigrants for well-being outcomes in the areas of education, employment, poverty and having a say in government (Figure 2.16). However, over-qualification outcomes are less favourable, with migrants settled in New Zealand only ranking in the middle third of OECD-country migrants.
Source: OECD (2017), How's Life in New Zealand.
In contrast to the experience in most other OECD countries, where immigrants have mostly worse outcomes than the native-born, immigrants in New Zealand tend to experience similar well-being outcomes. In particular, NZ immigrants have similar levels of well-being outcomes to the native-born for life satisfaction, PISA scores, perceived health and having a say in government. They are more likely to feel safe than the native-born but are also more likely to express loneliness and to experience discrimination and tend to have slightly lower literacy scores. Immigrants in New Zealand also report relatively low participation rates in elections relative to those for the native-born, which is a sign of weak civic engagement and hence social integration.
Immigration has small positive effects on long-run incomes
Immigration may increase GDP per capita modestly in the long run
In the simplest neo-classical growth model, net migration has no effect on GDP per capita in equilibrium. A net inward migration shock increases the labour supply and, with the capital stock fixed in the short run, reduces labour productivity and wage rates but increases the return on capital, which has become scarcer relative to labour. In the presence of international capital mobility, capital will be imported until the rate of return returns to the internationally going rate, leaving capital intensity on the same long-run path as before the population shock. In the long run, productivity and real wage rates will be the same as if the net migration shock had not occurred. In this model, net migration can only affect living standards in the long run if multifactor productivity (MFP) is affected. Given that the increase in investment that follows an increase in immigration will embody technical progress, positive long-run MFP effects are in fact likely.
Boubtane and Dumont (2013[10]) extend the above simple neo-classical model to take skills levels into account. Estimating their model using data for 22 OECD countries over 1986-2006, they find that an increase in net migration increases labour productivity growth slightly: for the EU15 countries, an increase in the net immigration rate of 1 percentage point would increase labour productivity growth by 0.1-percentage point. This result matches the average effect of net migration found in a meta-analysis by Ozgen et al. (2010[11]).
Brunow, Nijkamp and Poot (2015[1]) extend the analysis to cover a wider range of countries over a longer period (1950-2010) and control for income convergence (including effects by continent) but not for skills. They find that net immigration has no effect on GDP per capita growth in the current decade but that there is a weakly significant negative effect in countries experiencing net emigration. Focussing on 36 rich countries (including New Zealand) that have high rates of net migration, Brunow et al. find that net immigration has a positive effect on GDP per capita at a lag of two decades (although these results should be considered as indicative as it is technically difficult to estimate the long-run effects of net migration precisely). This would be consistent with the integration of new immigrants taking 10 to 20 years (see below), while endogenous productivity growth through new investment or other channels may take a similar time to be realised.
Using a computable general equilibrium (CGE) model of the NZ economy, Nana, Sanderson and Hodgson (2009[12]) find that doubling annual net immigration to 40 000 non-NZ-born migrants over 2006-21 would increase GDP per capita by 1.5% over the baseline by 2021. For this and a variety of scenarios with alternative assumptions for technical change, international trade propensities, the skills mix of immigrants and investment, the authors find that increased immigration: reduces production costs, improves export competitiveness, benefits domestic investment and/or consumer spending, and increases government net lending. The authors also tested the effects of cutting the net immigration flow to zero and found that this would result in GDP per capita falling to 1.8% below the baseline level by 2021. A critical assumption underpinning the positive effect of immigration on GDP per capita is that the capital-labour ratio is unaffected in the long run by changing levels of immigration. This may be a reasonable assumption for an advanced country with an open capital account, such as New Zealand, and in light of international evidence that the long-run wage impact of immigration is very small (Hodgson and Poot, 2010[13]).
Immigration may boost productivity through agglomeration economies and innovation
An important channel through which net immigration may increase productivity is agglomeration economies, which are generated by concentrations of population in cities and industrial clusters (Glaeser, 2010[14]). Migrants are predominantly drawn to large cities by the benefits of greater agglomeration, including higher wages and greater amenities (Glaeser, 2011[15]). As noted above, this pattern also occurs in New Zealand, with around half of immigrants settling in Auckland, a city that accounts for around one third of New Zealand’s population.
Based on longitudinal firm-level microdata, Maré (2016[16]) finds evidence that agglomeration economies contribute to higher productivity in Auckland. Value added per worker in Auckland is 17.9% higher than the average for other urban areas, with 4.4 percentage points of this premium attributable to industry composition. Controlling for Auckland firms’ more intensive use of non-labour inputs, Auckland’s productivity advantage falls further, to 7.9%, when labour inputs are measured as full-time-equivalent employment. However, Auckland firms disproportionately employ higher quality labour. Adjusting for labour quality, Auckland’s productivity premium falls to 2.2%. This estimate controls for higher labour and input prices and lower output prices in Auckland than in other urban areas. Maré also demonstrates that failure to account for these spatial price differences biases downwards estimates of the Auckland productivity premium by 3 to 6 percentage points.
Agglomeration benefits in Auckland have been constrained by the failure of infrastructure investment and housing supply to keep up with population growth (see Chapter 3), which has resulted in growing traffic congestion (and water pollution) and rising house prices. Traffic congestion has directly reduced productivity and, together with rising house prices, made it more difficult for workers to move to a better skills-matched job where they would be more productive. Adalet McGowan and Andrews (2017[17]) estimate that reducing literacy skills mismatch in New Zealand to the best practice minimum could increase industry labour productivity by 7% through gains in allocative efficiency. They find that the biggest problem in this area is the relatively low long-run elasticity of new housing supply, which is only one third of the best practice level in the United States (Andrews, Caldera Sánchez and Johansson, 2011[18]).
McLeod et al. (2014[19]) report various ways in which inward migration could increase innovation, notably through increasing: the scale of the economy; the share of the workforce that is highly skilled; the cultural diversity of the workforce; and international knowledge transfers. Numerous empirical studies have identified a positive relationship between immigration at area level and innovation at the area or firm level in the United States and Europe (Kerr and Lincoln, 2010[20]); (Hunt and Gauthier-Loiselle, 2010[21]); (Ozgen et al., 2014[22]); and (Peri, 2007[23]). More recently, studies have begun to emerge using both migrant intensity and innovation outcomes at the firm level thanks to developments in linked employer-employee datasets. Using such a dataset for New Zealand, McLeod et al. (2014[19]) find that firms hiring greater numbers of recent immigrants and those hiring more recent returnee New Zealanders tend to innovate more than other firms. Furthermore, they find that it is the being new and high-skilled characteristics of these groups that are most important, at least for some forms of innovation, as opposed to the outside perspective. They also find that the impact of high-skilled immigrants on innovation does not seem to be different from that of similarly high-skilled new employees. In other words, the main way that immigration policy facilitates innovation is through positive effects on the skills composition of the workforce.
Immigration seems to have a positive net fiscal impact
Immigrants appear to have a positive effect overall on public finances. Slack et al. (2007[24]) estimate that in FY 2005/06 immigrants contributed 24.7% of government revenue and accounted for 18% of government expenditure; government expenditure included education, health, benefits and allowances and superannuation but not infrastructure, which is difficult to attribute. Their net contribution to the budget balance (NZD 3 288 million) was greater than that of the NZ-born (NZD 2 838 million) despite comprising only 23% of the population. The larger net contribution of immigrants than the native-born is attributable to them being relatively young, often single and usually employed in relatively well-paid jobs.
Unfortunately, no NZ studies taking a life-cycle approach are available. Such studies would give a better indication of contributions to the budget and claims on it by immigrants and their children as they age. However, as Hodgson and Poot (2010[13]) note, the long-run net fiscal contribution on average of an immigrant is likely to be greater than that of a NZ-born person as an immigrant who enters New Zealand at working age will have been educated at another country’s expense; for some categories of immigrants, such as elderly parents of immigrants, the opposite would hold. While the overall budget impact is likely to be positive, this is unlikely to hold for local government. Net inward migration tends to have negative effects on local government finances as it requires extra infrastructure investment but does not yield much more tax revenue for local government; most of the extra revenue flows to central government (see Chapter 3).
On average, immigration has no negative effects on the wage or employment of New Zealanders
In theory, immigrants reduce employment and/or wage rates of existing residents if the two groups are highly substitutable but have the opposite effects if they are largely complements. A vast international empirical literature has developed to estimate these effects in practice. Depending on model specifications, immigration has small negative or positive effects on the native-born in the labour market (Longhi, Nijkamp and Poot, 2010[25]). For example, Canadian studies generally find that overall immigration has no or only a small negative impact on the wage rates of Canadian workers but a relatively larger effect on those of other immigrants (OECD, 2018[26]).
Assuming that competition only occurs between recent migrants, earlier migrants and the NZ-born, Maré and Stillman (2009[2]) find that a 10% increase in the recent migrant share of the workforce is associated with 0.14 and 0.36 percentage point lower employment rates of the NZ-born and recent migrants, respectively, and 0.89% higher wages for the NZ-born. These positive wage effects suggest that recent immigrants are complements to NZ-born workers rather than substitutes. With these reduced-form regressions, the authors also find no significant impact on the wages of recent migrants themselves.
However competition is likely to occur across skills groups. To capture this effect, Maré and Stillman specify three different types of production function that allow the nature of competition and substitutability between migrants and non-migrants to differ. Regardless of the production function used, the authors find little evidence that immigrants negatively affect either the wages or the employment opportunities of the average NZ-born worker. The only evidence of negative impacts of recent migrants on wages of the NZ-born is when the relative skill composition of recent immigrants is increased. This has a small negative effect on the wages of high-skilled NZ-born that is offset by a positive effect on wages of the medium-skilled NZ-born.
It has been argued that many empirical studies that find minor labour market impacts of immigration, such as Maré and Stillman (2009[2]), are biased because they do not take into account the effects beyond the local labour market (Borjas, 2003[27]), which in New Zealand’s case would include effects on the Australian labour market. To test this hypothesis, Maré and Stillman (2010[28]) examine the relationship between inflows of migrants in particular skill groups and the geographical mobility of the NZ-born and earlier migrants. New Zealand is an ideal candidate to test this hypothesis given the overwhelming concentration of immigrants in Auckland. They find little support for the hypothesis that migrant inflows displace either the NZ-born or earlier immigrants with similar skills from the areas where immigrants are settling. If anything, their results suggest that there are positive spillovers between recent immigrants and other workers that encourage workers to move to or remain in the areas where similarly skilled immigrants are settling. Consequently, it appears unlikely that geographical mobility moderates any impacts of immigration on labour or housing markets in New Zealand.
The surge in migrants on temporary work visas in recent years (see above) has raised concerns about their impact on the employment and earnings of New Zealanders. Ministry of Business, Innovation and Employment (2018[3]) updates an earlier study (McLeod and Maré, 2013[29]) that was ‘unable to find any evidence [of] adverse consequences for the employment of New Zealanders overall’ (p. vii). The updated study, which uses 2000-15 data, finds that temporary migrants did not have negative effects on employment and new hires of New Zealanders on average, either in the same industry (direct effects) or when also taking into account effects in other industries (combined effects), and increased the average earnings of New Zealanders aged 25 years or more (but not of youth). Looking at different periods and subgroups, the study finds that there were:
-
negative effects for beneficiary hires in 2001-05 and positive effects for youth hires in 2006-10 and 2011-15;
-
positive effects for youth and beneficiary hires in major urban areas in all years and positive effects on earnings of New Zealanders aged 25 or over in Auckland;
-
negative effects on beneficiary hires and positive effects on the earnings of New Zealanders aged 25 or more and New Zealanders as a whole in areas outside the 16 most urbanised ones;
-
negative effects on new hires of beneficiaries in horticultural regions; and
-
positive effects on new hires of all groups except beneficiaries (no effect) in the food services industry.
By temporary visa type, Ministry of Business, Innovation and Employment (2018[3]) finds that migrants on Essential Skills visas, which is the largest category of temporary work visas, have negative effects on hires of New Zealanders as a whole. The authors wondered if this effect might be attributable to employers, who have to guarantee a certain number of hours of employment to Essential Skills migrants, finding it easier (or being contractually obliged) to retain them over New Zealanders in challenging economic conditions, but were unable to obtain estimates for such a hypothesis. Migrants on Family visas also have a negative effect on hires of New Zealanders as a whole, with the effect being stronger for beneficiary hires. Other findings were that migrants on International Student visas have positive effects on new hires of youth and beneficiaries while migrants on Study to Work visas have negative effects on youth hires, suggesting that migrants under this visa and youth may be competing for the same jobs.
Immigrants under-perform in the labour market, but the gap closes over time
Controlling for relevant characteristics, such as education and geographical location, Stillman and Maré (2009[30]) find that newly arriving immigrants have on average employment rates and annual incomes that are 20 percentage points and NZD 10 000-15 000 (30-35%) lower, respectively, than for the comparable NZ-born. The shortfall in annual earnings relative to the native-born is comparable to that estimated by Picot and Sweetman (2012[31]) in Canada. For immigrants who gained employment, occupational rank (classified by average wages earned by the NZ-born in each occupation over the entire sample period, 1997-2007) is 5-8% lower and hourly wages are 10-15% lower than for the comparable NZ-born.
However, outcomes generally improve over time. After around 15 years in New Zealand, employment rates for immigrants are close to those for the comparable NZ-born and the income difference has halved for men and vanished for women. For employed immigrants, occupational rank has almost converged with that for the comparable NZ-born and the relative wage disadvantage has fallen to 5% for women but remains around 10-15% for men. Nevertheless, there is much diversity in patterns of labour market adjustment. Immigrants from the Asian region have the most pronounced pattern of initial shortfall in outcomes relative to the comparable native-born while immigrants from the United Kingdom do not experience any shortfall – they have the same outcomes as the NZ-born both initially and over time. Immigrants from the Pacific region, on the other hand, most of whom arrive through family and humanitarian programmes, have poor relative outcomes at the time of arrival with no subsequent improvement. Immigrants with university degrees overcome their entry disadvantage within 10 years, whereas for immigrant men without qualifications, catch-up takes 20 years.
Stillman (2011[32]) extends this analysis by simultaneously considering interactions between immigrant status and ethnicity, and labour market outcomes. He finds that immigrant status, not ethnicity, drives the lower employment rates of immigrants from Asia and the Pacific than of the comparable NZ-born ethnic Europeans. There is little employment gap between NZ-born Asians and NZ-born Europeans but a large one between NZ-born Pasifika and NZ-born Europeans, most of which can be explained by characteristics, such as education (Table 2.8, Panel A). When interpreted with evidence in the paper that immigrants at all levels of education have lower employment rates than equivalent NZ-born, Stillman opines that ‘these results are consistent with Asian and Pasifika immigrants having worse job networks or higher reservation wages, perhaps because of different family obligations, less access to informal childcare, or being impacted by labour market discrimination’. Another possibility is that these immigrants have lower effective human capital than the equally educated NZ-born, perhaps because of weaker English language skills.
For wage gaps, on the other hand, ethnicity, not immigrant status appears to be the dominant factor (Panel B). Maori, Pasifika and Asians have lower wages than individuals with European or Other ethnicity, regardless of whether they are immigrants. For example, controlling for relevant characteristics, NZ-born Asian males have wages that are 15% below their NZ-born European counterparts while for Asian-born Asian males the gap is 24%. Wages for Australian-born Europeans, UK-born Europeans and other-born Europeans are similar to or higher than those for NZ-born Europeans. In light of evidence elsewhere in the paper that it is only less educated immigrants who have lower wages than their NZ-born counterparts, these results suggest that labour market discrimination may play an important role in wage setting among less-educated Maori, Pasifika and Asians in New Zealand. Stillman also notes that other possible explanations are lower quality education, worse job networks and occupational segregation.
Daldy, Poot and Roskruge (2013[33]) investigate workplace discrimination in New Zealand, which is perceived by 6% of workers (Statistics New Zealand, 2009[34]), using multivariate probit modelling techniques to disentangle a range of factors that could influence discrimination, including selection effects that may make groups that are discriminated against less likely to be in employment. They find that for men, only those born in South and Other Asia (predominantly India) perceive more discrimination than the rest of the population whereas for women, this applies to those from Southeast Asia (predominantly the Philippines and Malaysia). For men from North East Asia (predominantly China), discrimination may be reflected in lower employment rates. The authors recommend future research on the extent to which fluency in English reduces discrimination and hence, the extent to which post-settlement language training could reduce the incidence of discrimination in the workplace.
Selecting immigrants with better labour market integration prospects
Attracting higher-skilled temporary migrants and reducing exploitation
The cornerstone of New Zealand’s immigration system is the Essential Skills (ES) temporary work visa, which is for migrants who fill jobs for which no New Zealander or permanent resident is available (OECD, 2014[6]). It is a major route to residence - more than half of immigrants under the Skilled Migrant Category (SMC) had an ES visa at some stage. An elaborate system of labour market tests and exemptions aims to limit the potentially negative impact of ES migrants on the domestic workforce – as noted above, ES migrants have a negative effect on new hires of New Zealanders - while at the same time responding to employer needs.
Changes were made in 2017 to ES visa settings aimed at continuing to enable employers to hire temporary migrant workers where there are genuine shortages, while ensuring that only those likely to be able to transition to residence could stay in New Zealand long term. First, remuneration thresholds were introduced to assess the skill level of jobs offered to ES visa applicants to create high-, mid- and low-skill bands. This is a major improvement for assessing skill levels, as many ANZSCO classifications are outdated; a review of these classifications is underway. Second, lower-skilled ES visas were limited to a maximum duration of three years (after which migrants on them need to spend 12 months outside New Zealand before they can be granted another such visa). Previously, lower skilled migrants had been able to ‘roll over’ their visas indefinitely as long as a labour market test continued to be met. Third, partners and children of lower-skilled ES visa holders will have to meet the requirements for a visa in their own right.
The government is planning further reforms to the employer-assisted temporary work visa system (i.e., temporary work visas that are issued for a specific employer) and associated labour market tests to ensure that migrants are only recruited for genuine regional skills shortages and to create better connections between the immigration, education/skills and welfare systems as well as to increase expectations for employers to employ and train more New Zealanders. Final decisions on these proposals may be made in 2019. To recruit migrant workers, employers will first have to be accredited, which will require them to demonstrate that their business practices incentivise training and upskilling of New Zealanders and put upward pressure on wages and conditions, amongst other conditions. No labour market test will be required for occupations on new Regional Skills Shortages lists and for highly-skilled jobs paying at least twice the median wage. In sectors with high demand for lower-skilled migrant labour, sector agreements are to be negotiated that will oblige employers to commit to improvements to industry productivity, investment in training and development of domestic workers, or better conditions for both domestic and migrant workers in exchange for access to migrant labour. Regional differentiation in the labour market test is planned to support the alignment of the education/skills, welfare and immigration systems. Officials are working on how this alignment could best be achieved. These reforms and increases in the salary thresholds for mid-skilled- and high-skilled temporary migrants are expected to reduce employers’ reliance on lower-skilled immigration over time.
Recent changes were made to student visa settings to make clear that studying in New Zealand is not a pathway to residence for students with low levels of education attainment. The duration of Post-Study Work (PSW) visas, which allow international-student graduates to work in New Zealand, are now differentiated by level of study. Those with university degree level qualifications or higher are eligible for three-year visas and lower-level students are now only eligible for one-year visas. The higher remuneration thresholds introduced for residence (see below) reinforce the message that international students from lower-quality tertiary programmes and/or without advanced English language skills will have difficulty obtaining residence. International students’ chances of gaining residence would also be enhanced by providing them with more information about labour market needs and opportunities in New Zealand as few of them seem to go into fields in high demand (OECD, 2014[6]). In particular, too many study management and commerce, where they earn considerably less than comparable NZ-born counterparts, and too few enter science, technology, engineering and mathematics fields, where earnings are higher and, in the health field, higher than for the comparable NZ-born (Park, 2017[35]).
There have been reports of exploitation of temporary migrants on work visas linked to individual employers, despite laws against exploitation. To reduce such exploitation, the government increased the number of Labour Inspectors through Budget 2018 and recently ended the link between PSWs and a sponsoring employer – such visas are now open. It also initiated a review of the problem that includes in-depth policy analysis, independent commissioned research and a consultation group to hear the voices of migrants, business, unions, international students, the legal profession and community advocates. The more intense employer checks envisaged in the planned employer-assisted temporary work visa system may help to reduce exploitation. Making it easier for workers on such visas to change employers could also help by reducing opportunities for exploitation.
The points system for skilled immigrants has been realigned to emphasise characteristics associated with better labour market outcomes
The points system for the Skilled Migrant Category (SMC) was adjusted in 2017 to put more emphasis on characteristics associated with better labour market outcomes. The minimum number of points for automatic selection from the Expression of Interest pool was increased, remuneration thresholds were introduced as an additional means of defining skilled employment, and more points were awarded for skilled work experience, some recognised postgraduate qualifications and applicants aged 30-39 years. The government decided not to award additional points for English language skills beyond the minimum required level (International English Language Testing System level 6.5 on a 1-9 scale, corresponding to a competent to good user). However, evidence from New Zealand (Grangier, Hodgson and McLeod, 2012[36]) and other countries (e.g., Picot and Sweetman (2012[31]) for Canada) shows that better mastery of the host country language is associated with better labour market outcomes (OECD, 2014[6]). At the same time, there does not seem to be a strong case for awarding additional points for NZ qualifications as they are not more highly rewarded in the labour market than foreign ones (Grangier, Hodgson and McLeod, 2012[36]), although NZ-qualified immigrants are less likely to re-emigrate than other immigrants.
The New Zealand Qualifications authority is expanding referencing of foreign qualifications from English-speaking countries to 50 countries, including the European Union. However, occupational councils set qualification requirements for regulated occupations inconsistently. Highly skilled health sector professionals frequently have difficulty being able to practise in New Zealand.
The government supports an extensive array of immigrant settlement programmes
The New Zealand Migrant Settlement and Integration Strategy (the Strategy), which came into force in 2014, aims to settle and integrate migrants so that they ‘make New Zealand their home, participate fully and contribute to all aspects of NZ life’. The government provides tailored information and services to migrants to support positive outcomes in each of the Strategy’s five target areas: employment; education and training; English language; inclusion; and health and well-being. During 2017/18, the Ministry of Business, Innovation and Employment (MBIE) worked with the Interagency Reference Group to develop and implement a new and consistent approach across agencies to ongoing outcomes evaluation and reporting for integration programmes/services. The objectives of the new approach are to support the alignment of reporting on the effectiveness of services, strengthen collaborative oversight of service delivery and help to inform future decision-making on funding allocations.
Improving labour market outcomes for spouses/partners of skilled immigrants and for former international students who have graduated is a priority
The Strategy identifies two groups in particular that may need help to find employment that makes good use of their skills: spouses/partners of principal skilled applicants (referred to as secondary skilled applicants), only 45% of whom were employed in jobs that matched skills and qualifications in 2016, compared with 81% for principal applicants; and international student graduates with a Bachelor’s level degree or above. The government has given priority to these groups in its Work Connect programme. This programme, which is an employment service for migrants first piloted in Auckland in 2016, provides them with career management competencies to help them find, secure and remain in employment. Participants who complete the programme should be able to understand and promote their skills, experience and qualifications in a NZ context. Preliminary findings from the 2016/17 evaluation show that it is meeting its targets and the needs of most clients. Work Connect was consolidated in Auckland and expanded to the other main centres in 2017/18.
The government also sponsors Regional Skills Matching programmes, again with skilled migrants, skilled migrant’s partners and international student graduates (with a Bachelor’s level degree and above) as priority groups. These programmes build connectivity between priority job-seeking migrants and employers who need their skills. Each programme provides face-to-face and/or online assistance to migrants, and advice and support to employers who have registered with the service. Three quarters of migrants who benefited from these services gained employment appropriate to their skill level and four fifths of employers using the service reported being able to find appropriate potential employees. The Auckland Chamber of Commerce’s New Kiwis website was particularly successful, accounting for around 60% of employment placements. It uses CVs without names to reduce discrimination.
Mentoring and bridge programmes could help improve labour market outcomes
These programmes largely provide placement services, which in New Zealand are otherwise extremely limited, being restricted to welfare beneficiaries. They could usefully be complemented by mentoring programmes, which have proven to be a promising way to overcome immigrants’ underrepresentation in high-wage jobs (Skuterud and Su (2012[37]) discuss this problem for Canada). Such programmes, which help currently employed skilled immigrant workers meet people in their profession, potentially integrating them in job-search networks, provide profession-specific language skills as well as literacy and soft skills specific to the host country workplaces. In Canada, the programmes operated by the Toronto Region Immigrant Employment Council (TRIEC) have been particularly successful: three-quarters of immigrant professionals using their programmes find a job in their field within a year. The success has been such that the model has been exported to other Canadian cities and Australia. The main constraint to running these programmes is finding people who can take the time to mentor.
The government should also expand bridge programmes, which combine advanced language training specific to an immigrant’s field and courses needed to bring credentials up to host country standards in regulated occupations. In Canada, these programmes have been very important in the health-care sector, which has many immigrant physicians but a high failure rate (60%) in the licensing test. Mentoring programmes would make bridge programmes still more effective.
English language programmes could be more effective
A related issue to the absence of bridge programmes is that the government does not support occupationally-based language courses. Yet these can be very helpful in equipping immigrants with the advanced English-language skills needed to find and retain high-skilled employment that corresponds to their education level. In Canada, clients who use Immigration, Refugees and Citizenship Canada (IRCC)-funded occupation-specific language training are the most likely to improve their English language skills by at least one Canadian Language Benchmark and require the least time to do so (OECD, 2018[26]). Warman et al. (2015[38]) observe higher earnings for immigrants in Canada who report educational training preparatory to a licensed occupation, especially for immigrants with advanced English language skills. Expanding access to occupation-specific classes, which are often held in the evening, may be particularly beneficial for refugees, who cannot afford to delay working for years while they learn English for daily needs.
Indicators measuring migrant outcomes related to English-language competency show room for improvement. Only two-thirds of immigrants required to pre-pay English for Speakers of Other Languages (ESOL) courses take them up. To increase this share, Immigration New Zealand and the Tertiary Education Commission (TEC) have developed an online tool to help migrants find an English language class. The government should also consider giving immigrants the option of paying a bond that they recover if they demonstrate the required level of English-language competency (OECD, 2014[6]). Such an approach would leave immigrants free to decide how best to reach the required level.
Another issue concerns support for ESOL students in schools. These students are at a considerable disadvantage in learning relative to native English speakers. To help overcome this disadvantage, ESOL funding is available for immigrant and refugee background students for up to five years and for NZ-born students of migrant or refugee parents for up to three years in years zero to four of schooling. These interventions have been effective - students who have had up to the maximum ESOL funding entitlement have a National Certificate of Educational Achievement (NCEA) level 2 (normally achieved in year 12 of schooling) or above attainment rate that is higher than the average for all school leavers. However, teachers receive little training for teaching linguistically diverse students (Green, 2016[39]), despite there being specific post-graduate qualifications for teaching ESOL students and funding for teachers to undertake these studies, albeit in their own time. Undertaking such studies would be more attractive if funding were provided for teachers to do so in work time. It would also help if a curriculum to guide teaching of ESOL students were developed. Homework centres at schools could also assist many of these students, as well those from socio-economically disadvantaged backgrounds, to advance academically.
Families and ethnic communities could facilitate the academic success of ESOL learners by contributing to the maintenance of their first language. Evidence from the United States and the United Kingdom suggests this is very important for mastery of the host country language – children who can read and write in their first language quickly adjust to another (Green, 2016[39]). A challenge in New Zealand is that ethnic communities are not particularly concentrated geographically, either between or within cities; while this lack of concentration is a disadvantage for building bonding social capital, it could help build bridging social capital.
Programmes to support immigrant inclusion and counter racism are working well
The Strategy includes Welcoming Communities, which aims to help immigrants to integrate well in New Zealand and encourages local communities to be more welcoming of newcomers. This programme is part of a global welcoming network that includes Welcoming Cities Australia, Welcoming America and Welcoming International. In contrast to previous initiatives, which focused primarily on newcomers and their families, Welcoming Communities seeks to equip and involve local residents in welcoming activities. The Welcoming Communities Standard provides local councils and communities with a benchmark for success in the following areas: inclusive leadership; welcoming communications; equitable access; connected and inclusive communities; economic development, business and employment; civic engagement and participation, welcoming public spaces; and culture and identity. Early outcomes from the programme’s interim evaluation report show that:
-
Stronger links are forming with the communities piloting the programme – community engagement is growing;
-
Local government councils are taking a more visible leadership role in promoting diversity and inclusion;
-
There has been an explicit shift in the communities from expecting newcomers to fit in to locals taking a welcoming role; and
-
There is a positive change in community awareness of diversity and inclusion.
Local/Regional Settlement Networks also support integration. All regions have a Network, where settlement stakeholders meet regularly to collaborate, interact on issues, exchange information and develop useful contacts to strengthen migrant settlement and retention. Using the Strategy, Relationship Managers from Immigration New Zealand inform networks on settlement approaches and encourage activities at the local level. Findings from the May 2018 Stakeholder Research Survey monitoring the value of these Relationship Managers strongly support their role in facilitating networks to build closer working relationships between regional settlement stakeholders.
The Strategy also includes the Tackling Casual Racism campaign, which is led by the Human Rights Commission and aims to create a culture in which racist and discriminatory attitudes and behaviours are unacceptable for most New Zealanders. The campaign aims to raise awareness of racism, create attitudes that are more positive to growing diversity and ensure that those who experience racism know where they can turn for help. Most people aware of the campaign agreed that it made them more aware of racism in New Zealand and that they had taken some action to reduce it, most commonly reflecting on their own views or behaviours. The focus in 2018/19 will be on helping employers to reduce racism in the workplace.
References
[17] Adalet McGowan, M. and D. Andrews (2017), “Skills mismatch, productivity and policies: Evidence from the second wave of PIAAC”, OECD Economics Department Working Papers, No. 1403, OECD Publishing, Paris, https://dx.doi.org/10.1787/65dab7c6-en.
[8] Alesina, A., J. Harnoss and H. Rapoport (2016), “Birthplace diversity and economic prosperity”, Journal of Economic Growth, Vol. 21/2, pp. 101-138, https://doi.org/10.1007/s10887-016-9127-6.
[18] Andrews, D., A. Caldera Sánchez and Å. Johansson (2011), “Housing Markets and Structural Policies in OECD Countries”, OECD Economics Department Working Papers, No. 836, OECD Publishing, Paris, https://dx.doi.org/10.1787/5kgk8t2k9vf3-en.
[27] Borjas, G. (2003), “The Labor Demand Curve is Downward Sloping: Reexamining the Impact of Immigration on the Labor Market”, The Quarterly Journal of Economics, Vol. 118/4, pp. 1335-1374, https://doi.org/10.1162/003355303322552810.
[10] Boubtane, E. and J. Dumont (2013), “Immigration and Economic Growth in OECD Countries 1986-2006: A Panel Data Analysis”, CES Working, No. 2013.13, Centre d’Economie de la Sorbonne , Paris, https://www.mendeley.com/library/ (accessed on 23 January 2019).
[1] Brunow, S., P. Nijkamp and J. Poot (2015), “The Impact of International Migration on Economic Growth in the Global Economy”, Handbook of the Economics of International Migration, Vol. 1B, https://doi.org/10.1016/B978-0-444.53768-3.00019-9.
[5] Carmichael, G. (ed.) (1993), Trans-Tasman Migration: Trends, Causes and Consequences, Australian Government Publishing Service, Canberra.
[33] Daldy, B., J. Poot and M. Roskruge (2013), “Perceptions of Workplace Discrimination among Immigrants and Native Born New Zealanders”, IZA Discussion Papers, No. 7504, https://www.mendeley.com/library/ (accessed on 24 January 2019).
[15] Glaeser, E. (2011), Triumph of the City, Macmillan, New York, https://www.mendeley.com/library/.
[14] Glaeser, E. (2010), Agglomeration Economics, University of Chicago Press, https://doi.org/10.7208/chicago/9780226297927.001.0001.
[36] Grangier, J., R. Hodgson and K. McLeod (2012), Points of Difference. Does the Skilled Migrant Category Points System Predict Wages?, Department of Labour, Wellington.
[13] Hodgson, R. and J. Poot (2010), “New Zealand Research on the Economic Impacts of Immigration 2005-2010: Synthesis and Research Agenda”, Economic Impacts of Immigration Working Paper Series, Department of Labour, Wellington, https://www.mendeley.com/library/.
[21] Hunt, J. and M. Gauthier-Loiselle (2010), “How Much Does Immigration Boost Innovation?”, American Economic Journal: Macroeconomics, Vol. 2/2, pp. 31-56, https://doi.org/10.1257/mac.2.2.31.
[20] Kerr, W. and W. Lincoln (2010), “The Supply Side of Innovation: H-1B Visa Reforms and U.S. Ethnic Invention”, Journal of Labor Economics, Vol. 28/3, pp. 473-508, https://www.mendeley.com/library/.
[25] Longhi, S., P. Nijkamp and J. Poot (2010), “Meta-analyses of labour-market impacts of immigration: key conclusions and policy implications”, Environment and Planning C: Government and Policy, Vol. 28, pp. 819-833, https://doi.org/10.1068/c0915tr.
[16] Maré, D. (2016), “Urban productivity estimation with heterogeneous prices and labour”, Motu Working Paper, No. 16-21, Motu Economic and Public Policy Research , Wellington, http://www.motu.org.nz.
[28] Maré, D. and S. Stillman (2010), “The Impact of Immigration on the Geographic Mobility of New Zealanders”, The Economic Record, Vol. 86/273, pp. 247-259, https://doi.org/10.1111/j.1475-4932.2009.00620.x.
[2] Maré, D. and S. Stillman (2009), The Impact of Immigration on the Labour Market Outcomes of New Zealanders, Department of Labour, Wellington, https://www.mendeley.com/library/.
[9] May, S., J. Flockton and S. Kirkham (2016), PISA2015 New Zealand Summary Report, Ministry of Education, Wellington, https://www.mendeley.com/library/.
[19] McLeod, K., R. Fabling and D. Maré (2014), Hiring new ideas: International migration and firm innovation in New Zealand, Ministry of Business, Innovation and Employment, https://www.mendeley.com/library/.
[29] McLeod, K. and D. Maré (2013), The rise of temporary migration in New Zealand and its impact on the labour market, Ministry of Business, Innovation and Employment, https://www.mendeley.com/library/.
[3] Ministry of Business, Innovation and Employment (2018), Impact of Temporary Migration on Employment and Earnings of New Zealanders, Ministry of Business, Innovation and Employment, https://www.mendeley.com/library/.
[12] Nana, G., K. Sanderson and R. Hodgson (2009), “Economic Impacts of Immigration: Scenarios using a Computable General Equilibrium Model of the New Zealand Economy”, Department of Labour, Wellington, https://www.mendeley.com/library/.
[39] New Zealand Immigration (ed.) (2016), The Challenging Interface between Secondary and Tertiary Education for Young Migrants, New Zealand Immigration, Wellington, https://www.mendeley.com/library/.
[26] OECD (2018), OECD Economic Surveys: Canada 2018, OECD Publishing, Paris, https://dx.doi.org/10.1787/eco_surveys-can-2018-en.
[6] OECD (2014), Recruiting Immigrant Workers: New Zealand 2014, Recruiting Immigrant Workers, OECD Publishing, Paris, https://dx.doi.org/10.1787/9789264215658-en.
[4] OECD and European Union (2015), Indicators of Immigrant Integration 2015: Settling In, OECD/European Union , Paris, https://www.mendeley.com/library/.
[11] Ozgen, C., P. Nijkamp and J. Poot (2010), “The effect of migration on income growth and convergence: Meta-analytic evidence”, Papers in Regional Science, Vol. 89/3, pp. 537-562, https://doi.org/10.1111/j.1435-5957.2010.00313.x.
[22] Ozgen, C. et al. (2014), “Does Cultural Diversity of Migrant Employees Affect Innovation?”, International Migration Review, Vol. 48/1_suppl, pp. 377-416, https://doi.org/10.1111/imre.12138.
[35] Park, Z. (2017), Moving places Destinations and earnings of international graduates, Ministry of Education, Wellington, https://www.mendeley.com/library/.
[23] Peri, G. (2007), “Higher Education, Innovation and Growth”, in Brunello, G., P. Garibaldi and E. Wasmer (eds.), Education and Training in Europe, Oxford University Press, Oxford, https://www.mendeley.com/library/ (accessed on 24 January 2019).
[31] Picot, G. and A. Sweetman (2012), Making It in Canada Immigration Outcomes and Policies, Institut de recherche en politique publique.
[37] Skuterud, M. and M. Su (2012), “Immigrants and the dynamics of high-wage jobs”, Industrial and Labor Relations Review, Vol. 65/2, pp. 377-397, https://www.mendeley.com/library/ (accessed on 28 February 2018).
[24] Slack, A., J. Wu and G. Nana (2007), “Fiscal Impacts of Immigration”, Department of Labour, Wellington.
[7] Statistics New Zealand (2016), National Population Projections: 2016 (base)-2068, Statistics New Zealand, Wellington, https://www.mendeley.com/library/.
[34] Statistics New Zealand (2009), New Zealand General Social Survey, Statistics New Zealand , Wellington, https://www.mendeley.com/library/.
[32] Stillman, S. (2011), Labour Market Outcomes for Immigrants and the New Zealand-Born 1997-2009, Department of Labour, Wellington, https://www.mendeley.com/library/.
[30] Stillman, S. and D. Maré (2009), “The Labour Market Adjustment of Immigrants in New Zealand”, No. 09-10, Motu Economic and Public Policy Research, Wellington.
[38] Warman, C., A. Sweetman and G. Goldmann (2015), “The Portability of New Immigrants’ Human Capital: Language, Education, and Occupational Skills”, Canadian Public Policy, Vol. 41/Supplement 1, pp. S64-S79, https://doi.org/10.3138/cpp.2013-055.