copy the linklink copied!Indicator C4. What is the total public spending on education?
-
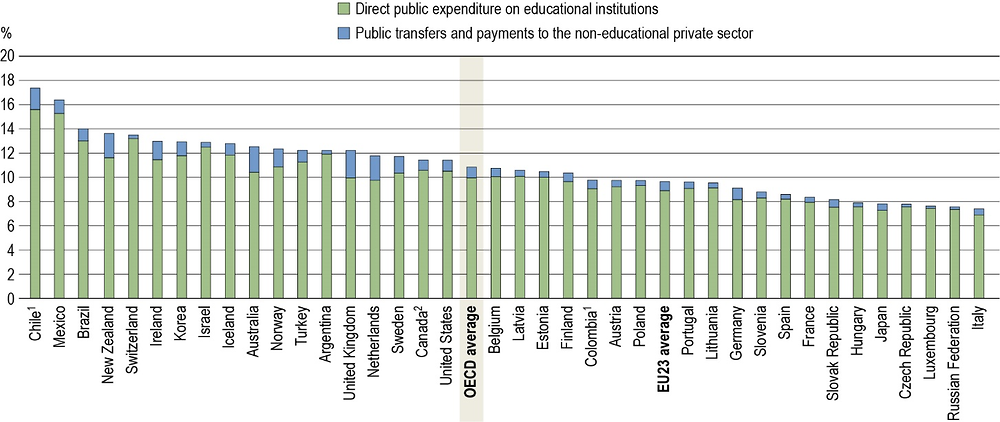
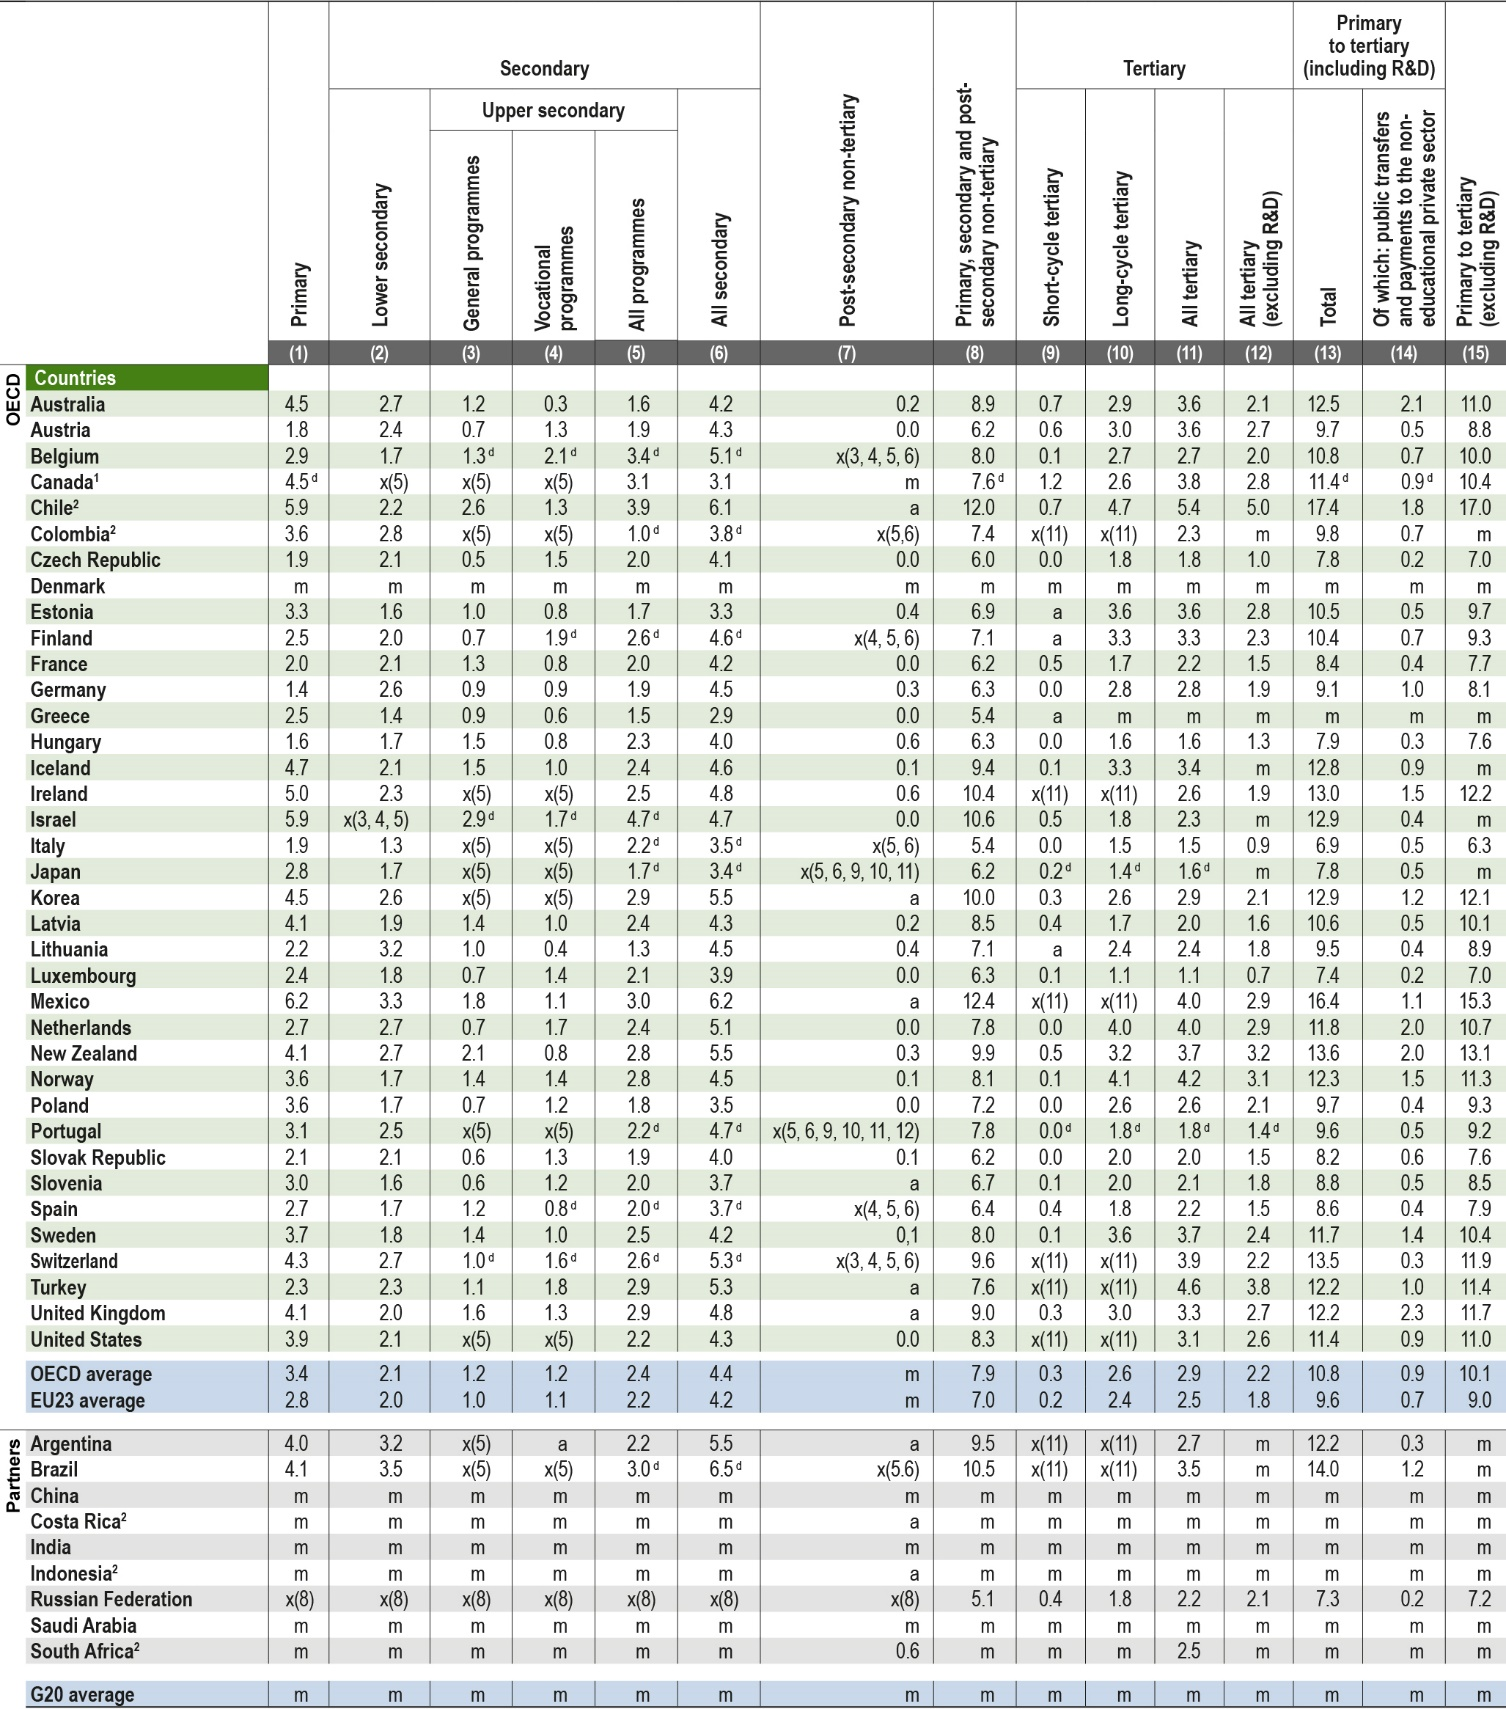
Total public spending on primary to tertiary education as a percentage of total government expenditure averages 11% across OECD countries, ranging from around 7% to around 17%.
-
In 2016, public transfers and payments to the non-educational private sector for primary to tertiary education represented on average less than 1% of total government expenditure. This represents 8% of public expenditure on education, with the remaining 92% corresponding to direct public expenditure on education.
-
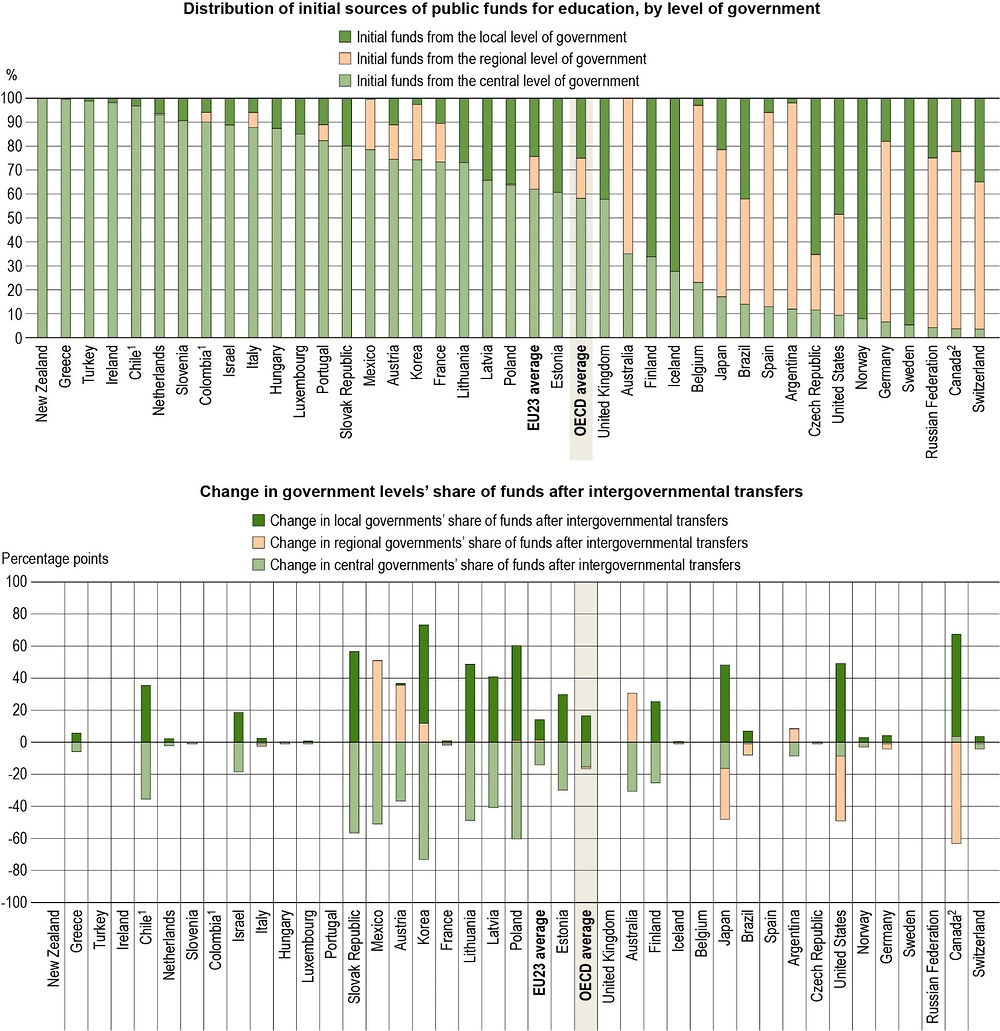
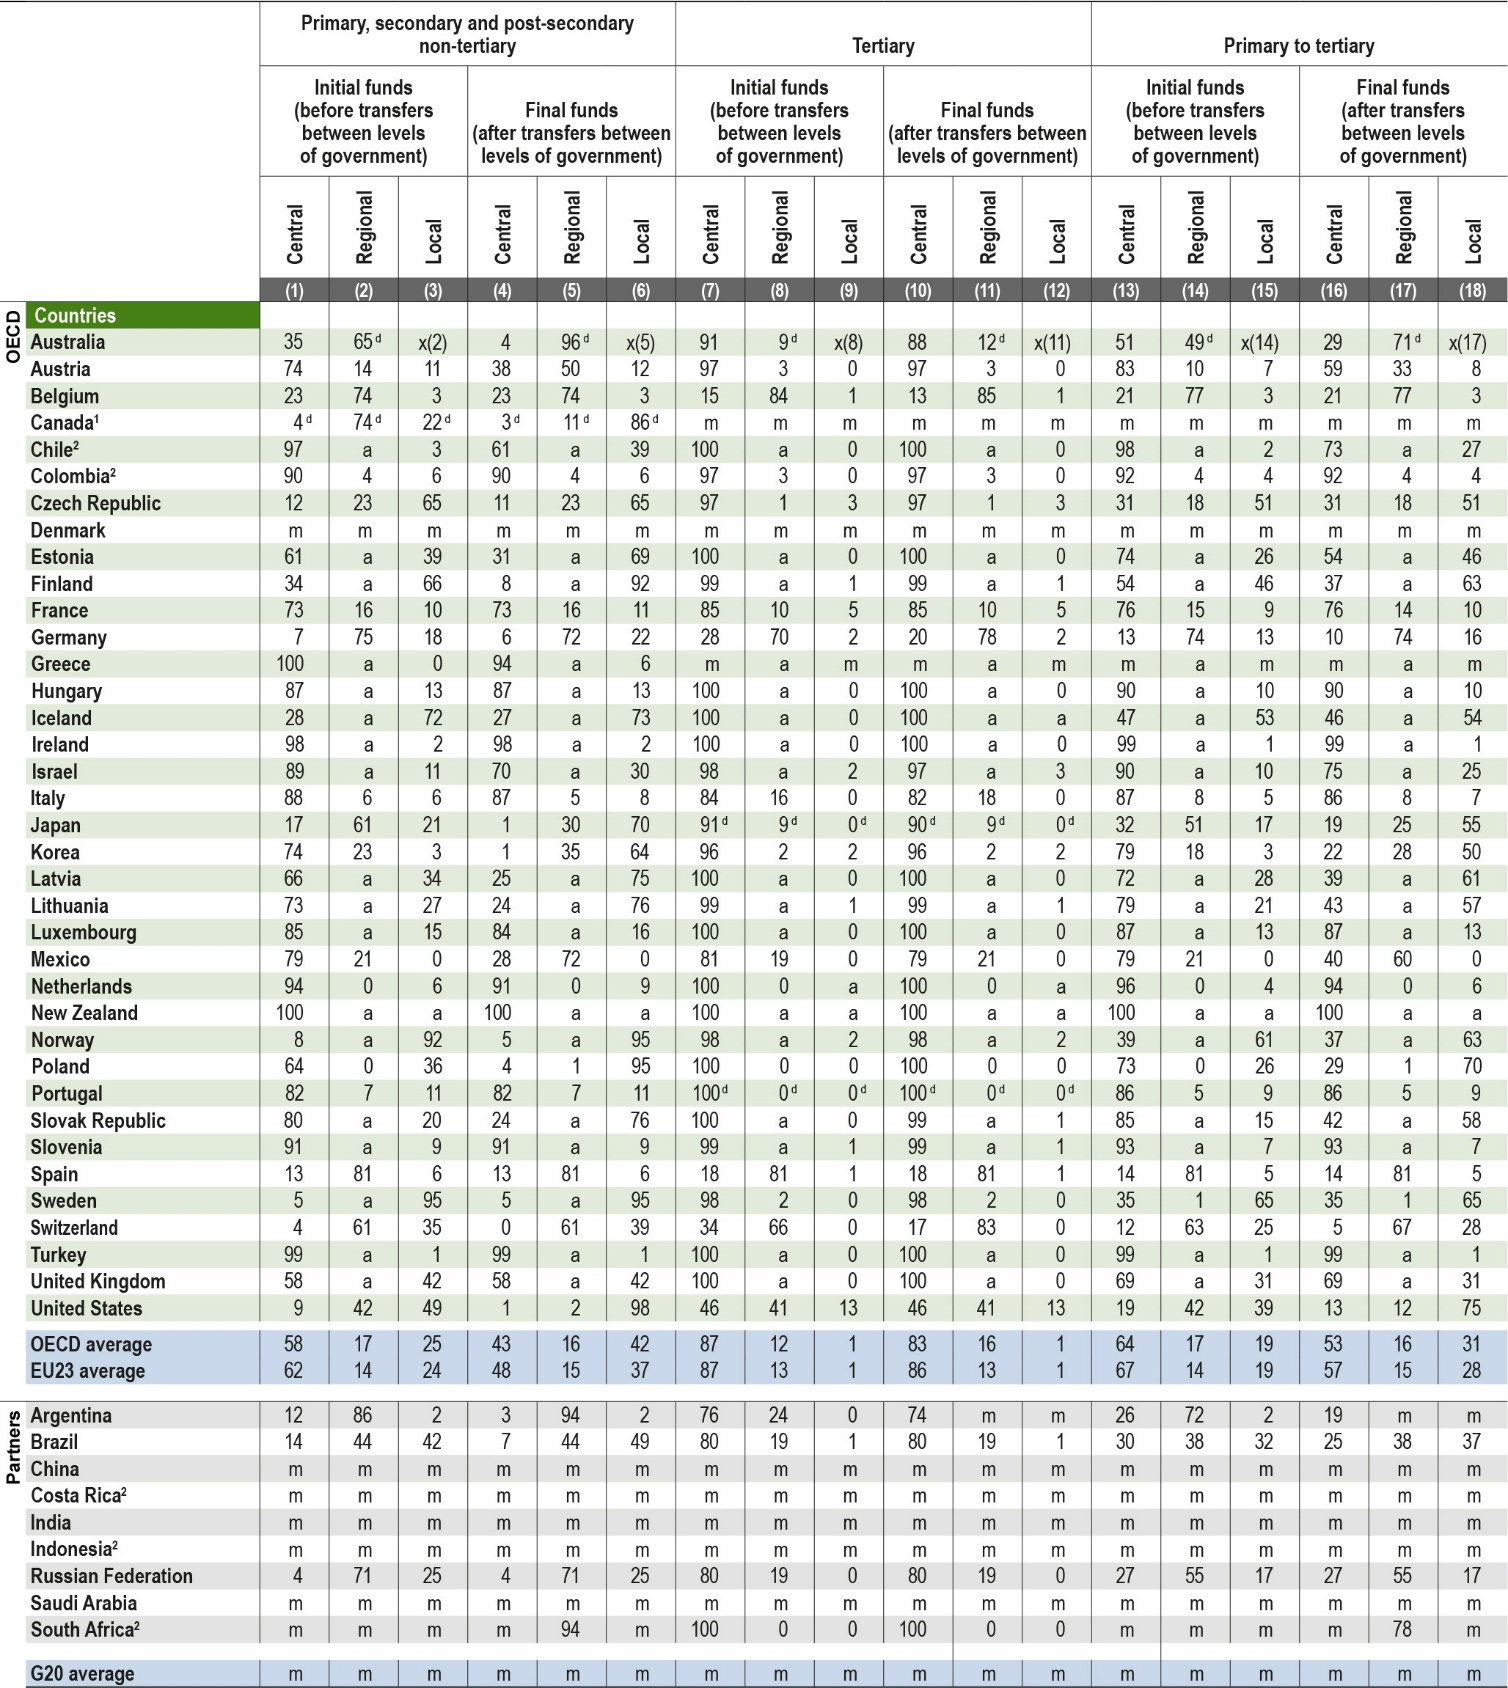
Spending in non-tertiary education (primary, secondary and post-secondary non-tertiary levels) is mostly decentralised, with 57% of final funds (after transfers between levels of government) managed by regional and local governments. In contrast, spending at tertiary level is more centralised with only 17% of final public funds sourced from the regional and local level.
1. Year of reference 2017.
2. Primary education includes pre-primary programmes.
Countries are ranked in descending order of total public expenditure on education as a percentage of total government expenditure.
Source: OECD/UIS/Eurostat (2019), Table C4.1. See Source section for more information and Annex 3 for notes (https://doi.org/10.1787/f8d7880d-en).
Context
Decisions concerning budget allocations to various sectors (including education, healthcare, social security and defence) depend on countries’ priorities and the options for private provision of these services. Government funding is appropriate in situations where the public benefit is high but private costs are greater than private benefits. Education is one area in which all governments intervene to fund or direct the provision of services. As there is no guarantee that markets will provide equal access to educational opportunities, government funding of educational services is necessary to ensure that education is not beyond the reach of some members of society.
The economic crisis has put pressure on public budgets with the result that less public funding has been allocated to education in some countries. Budget cuts can represent improved allocation of government funds and may generate gains in efficiency and economic dynamism, but they can also affect the quality of government-provided education, particularly at a time when investment in education is important to support economic growth.
This indicator compares total public spending on education with total government expenditure across OECD and partner countries. It also includes data on the different sources of public funding in education (central, regional and local governments) and on transfers of funds between these levels of government.
Other findings
-
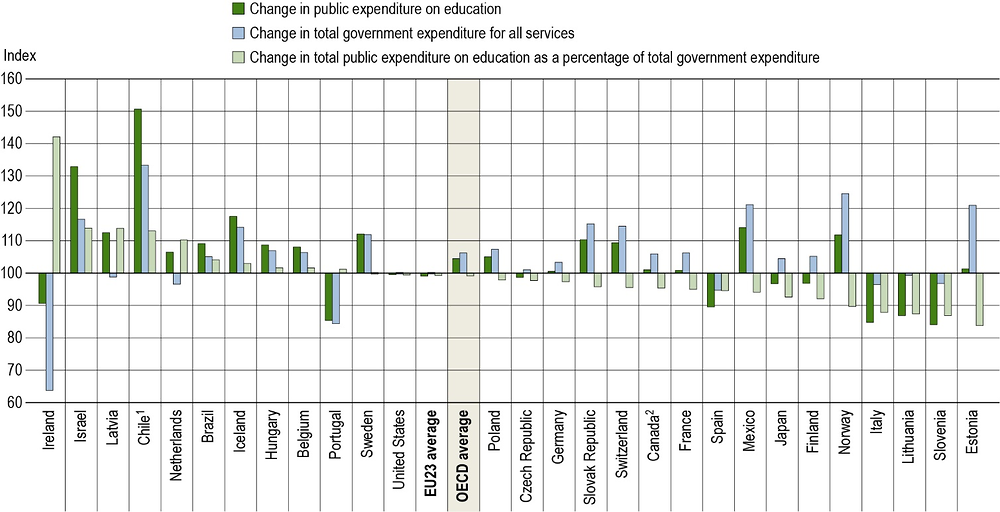
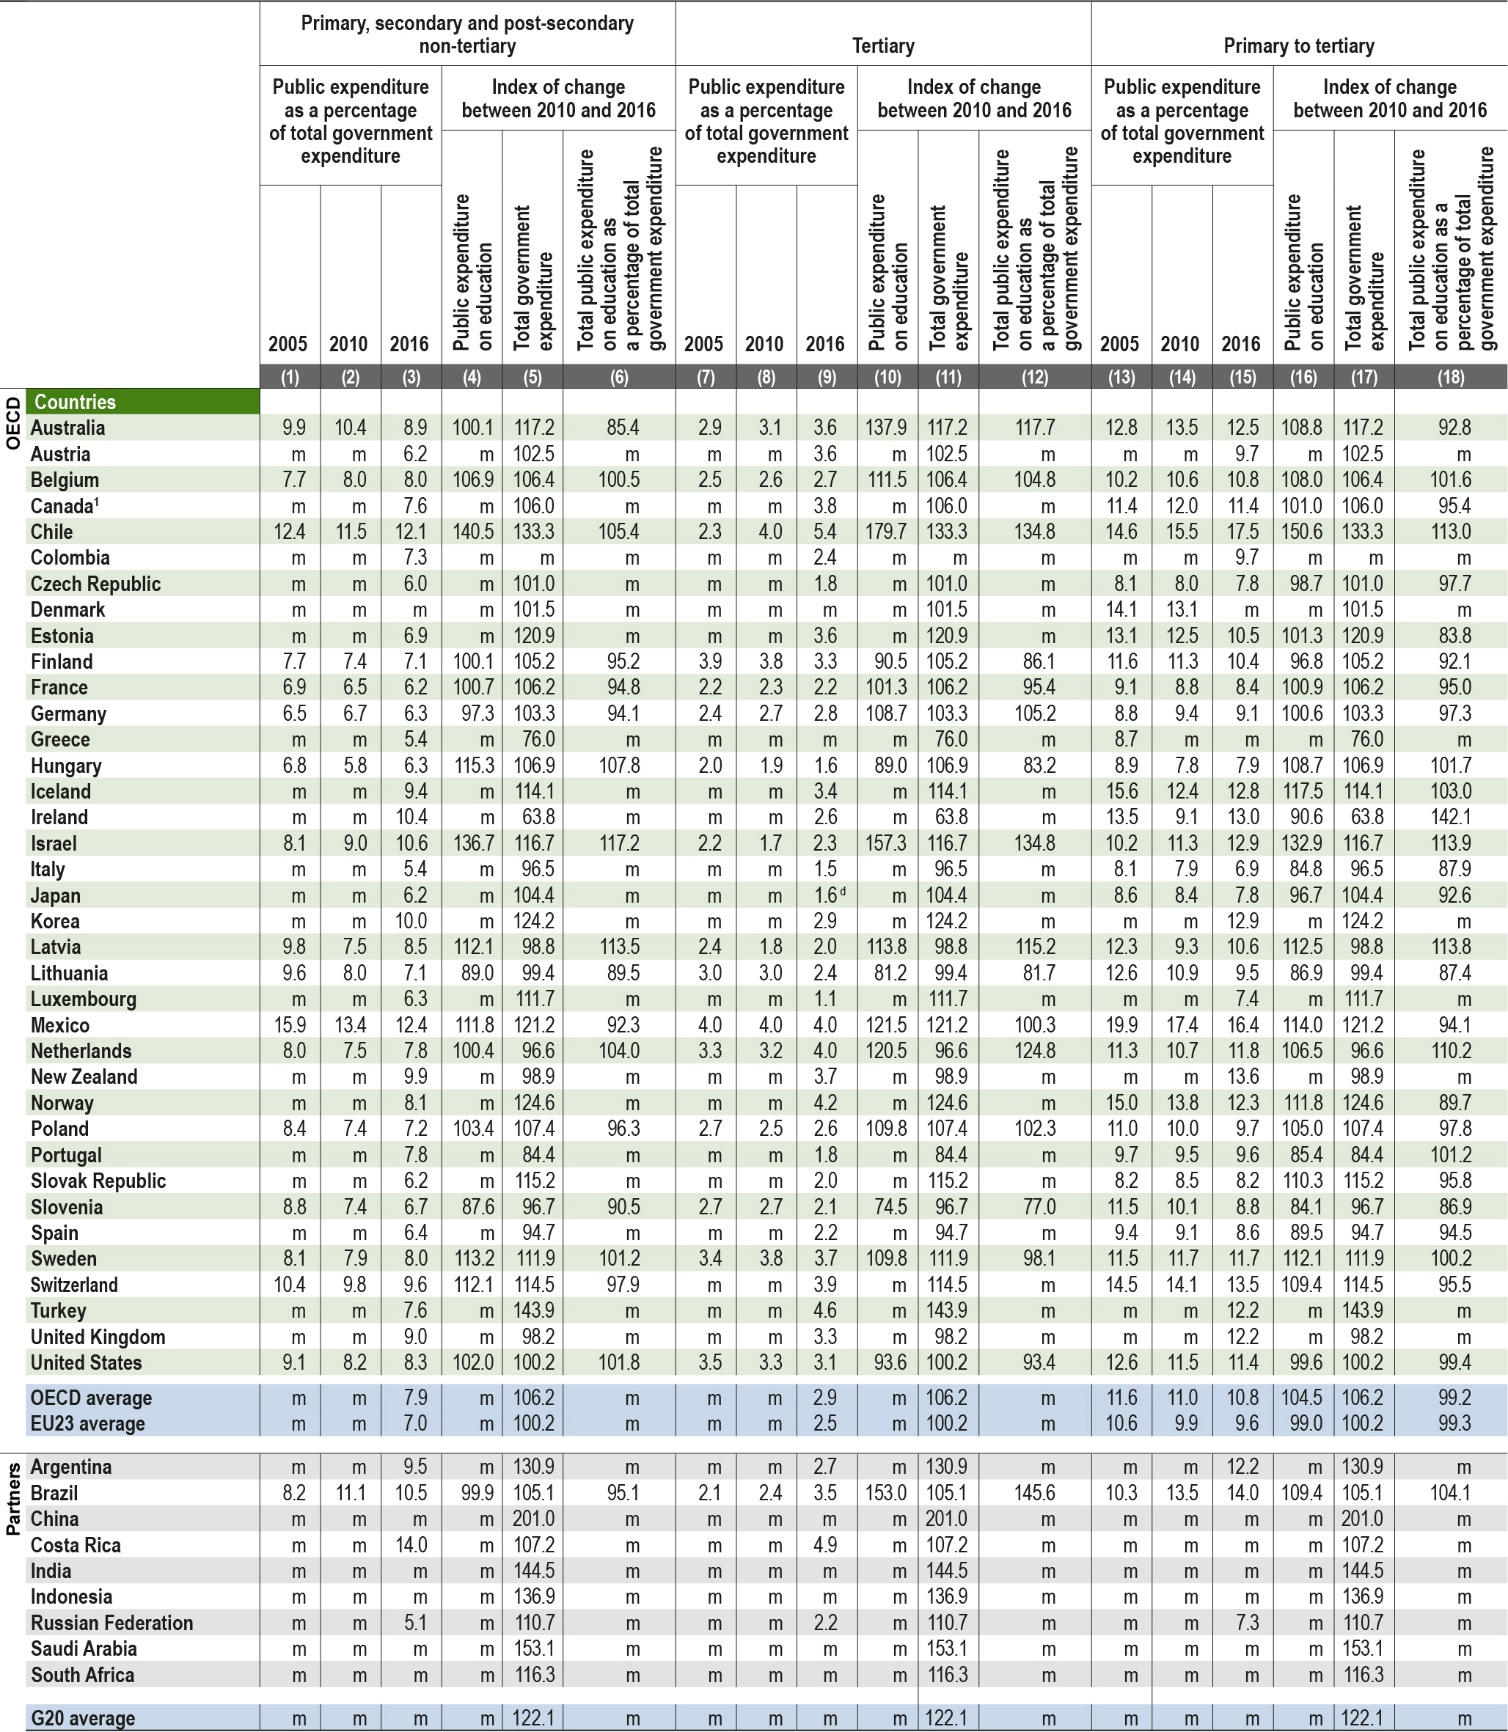
Between 2010 and 2016, the average share of total government expenditure devoted to government expenditure on primary to tertiary education remained relatively stable across OECD countries, at around 11%. In half of OECD countries, the share decreased over the same period.
-
OECD and partner countries spend more than twice as much on non-tertiary education (primary, secondary and post-secondary non-tertiary levels) as they do on tertiary education, mainly as a result of near-universal enrolment at lower levels.
-
The proportion of government expenditure devoted to primary to tertiary education fell between 2005 and 2016 in more than 70% of the countries with available data for both years. It remained stable in most other countries and increased in a number of countries, most notably in Chile and Israel, where the increase was just over 2.7 percentage points.
Analysis
Overall level of public resources invested in education
Countries differ in the share of total public expenditure they devote to education. In 2016, total public expenditure on primary to tertiary education as a percentage of total government expenditure for all services averaged 11% in OECD countries. However, this share varies across OECD and partner countries, ranging from around 7% in Italy to around 17% in Chile (Table C4.1 and Figure C4.1).
Overall, significant government funding is devoted to non-tertiary levels of education. In most countries, and on average across OECD countries, roughly three-quarters of the total public expenditure on primary to tertiary education (about 8% of total government expenditure) was devoted to non-tertiary education (Table C4.1). This is largely explained by the near-universal enrolment rates at non-tertiary levels of education (see Indicator B1), the demographic structure of the population, and the fact that in OECD countries, on average, the funding structure for tertiary education is more private than non-tertiary levels.
The total public expenditure devoted to tertiary education varies widely among countries. On average across OECD countries, total public expenditure on tertiary education amounts to 27% of total public expenditure from primary to tertiary education. Percentages range from 15%-20% in Ireland, Israel, Japan, Latvia, Luxembourg and Portugal to around 35% or more in Austria, Canada, Estonia, the Netherlands, Norway and Turkey (Table C4.1).
Total public expenditure on education includes direct expenditure on institutions (such as the operating costs of public schools), transfers to the non-educational private sector that are attributable to educational institutions, and public subsidies to households for living costs that are not spent in educational institutions. Public transfers and payments to the non-educational private sector for primary to tertiary education (such as public student loans, grants, scholarships and subsidies to private student loans) represent a small share of total government expenditure in OECD and partner countries, but significant differences are observed across countries (Figure C4.1). In 2016, this public expenditure represented less than 1% of total government expenditure and accounted for 8% of public expenditure on education, with the remaining 92% corresponding to direct public expenditure on education. However, the percentage varies by country: public transfers and payments to the non-educational private sector represent between 2% and 3% of total government expenditure in countries such as Australia, the Netherlands, New Zealand and the United Kingdom, and less than 0.3% in the Czech Republic, Luxembourg and the Russian Federation.
The relative size of public budgets must be taken into account when considering public spending on education as a share of total government expenditure. The share of total government expenditure as a proportion of GDP varies greatly among countries (Table C4.1 – web columns). In 2016, around 13% of countries with available data reported that total government expenditure on all services was more than 50% of GDP. A high share of total government expenditure devoted to public expenditure on education does not necessarily translate into a high share when compared to a country’s GDP. For example, Ireland allocates 13% of its total government expenditure to education (more than the OECD average of 11%), but total public expenditure on education as a share of GDP is relatively low (3.6% compared to the OECD average of 4.4%). This can be explained by Ireland’s relatively low total government expenditure as a share of GDP (28%).
Trends in public expenditure on education as a percentage of total government expenditure, 2005-16
Total public spending on primary to tertiary education decreased slightly across OECD countries between 2005 and 2016 (Table C4.3), falling below 11% of total government expenditure. Over this period, the share of total government expenditure on primary to tertiary education within total government expenditure decreased by 0.7 percentage points on average across OECD countries, and in more than 70% of countries with available data for both 2005 and 2016. The fall was especially substantial (around 3 percentage points) in Estonia, Iceland, Lithuania, Mexico, Norway and Slovenia, while Chile experienced the largest increase (almost 3 percentage points).
Total expenditure dropped slightly between 2005 and 2010, mainly due to the 2008 financial crisis. During this period, total public expenditure on primary to tertiary education as a percentage of total government expenditure decreased in two-thirds of OECD countries, and by 0.6 percentage points on average. Countries such as Iceland, Ireland, Latvia and Mexico were severely hit during this period and total public expenditure on primary to tertiary education as a percentage of total public expenditure fell by just over 2 percentage points.(Table C4.3).
A different tendency has been observed in the years following the crisis, between 2010 and 2016, probably due in part to countries facing less pressure to pursue fiscal consolidation (Table C4.3 and Figure C4.2). Despite the fact that public expenditure on primary to tertiary education increased over that period in a large number of countries, large increases were also observed in total government expenditure. Over this six-year period, about 30% of countries with available data increased the public expenditure on education as a share of total government expenditure, with Ireland showing the greatest increase (around 4 percentage points) while 75% of countries with available data increased total government expenditure for all goods and services. However, in about half of OECD and partner countries, the increase in public expenditure on education was lower than the increase in government spending overall. Notable examples are Estonia and Norway, where the relative increase in total government expenditure was between 10 and 20 percentage points higher than the increase in public expenditure on education (Table C4.3 and Figure C4.2).
1. Year of reference 2017
2. Primary education includes pre-primary programmes.
Countries are ranked in descending order of the change in total public expenditure on education as a percentage of total government expenditure.
Source: OECD/UIS/Eurostat (2019), Table C4.3. See Source section for more information and Annex 3 for notes (https://doi.org/10.1787/f8d7880d-en).
Sources of public funding invested in education
The division of responsibility for education funding between levels of government (central, regional and local) is an important factor in education policy. Indeed, important decisions regarding education funding are made at both the level of government where the funds originate and the level of government at which they are ultimately spent. At the initial level, decisions are made about the volume of resources allocated and any restrictions on how that money can be spent (see Box C4.1). At the final level of government education funding, additional restrictions may be attached to the funds, or this level of government may even pay directly for educational resources (e.g. teachers’ salaries).
There are generally four main approaches to the allocation of funds to schools:
-
1. Administrative discretion is based on an individual assessment of the amount of resources that each school needs.
-
2. Incremental costs takes into consideration historical expenditure to calculate the allocation for the following year. This can incorporate minor modifications to take into account specific changes (e.g. numbers, school facilities or input prices).
-
3. Bidding and bargaining involves schools responding to open competitions for additional funding offered via participation in a particular programme or making a case for additional resources.
-
4. Formula funding involves the use of objective criteria with universally applied rules to establish the amount of resources that each school is entitled to.
The distribution of funding on a discretional or incremental basis is rarely efficient or equitable and tends to be associated with low levels of budget transparency. Schools do not have any incentive to increase their efficiency nor reduce their expenditure. Both approaches are often combined, and mainly used in centralised systems. In contrast, the use of formula funding provides a high degree of transparency to the allocation system. Traditionally, formula funding relies on a mathematical formula taking into account four main groups of variables: 1) student numbers and grade levels; 2) needs; 3) curriculum or educational programmes; and 4) school characteristics (OECD, 2017[1]).
In some countries, education funding is centralised, while in others it is decentralised with funds transferred between levels of government. Complete centralisation can cause delays in decision-making. Decisions that are far removed from those affected also can fail to address changes in local needs and desired practices. Under complete decentralisation, however, units of government may differ in the level of educational resources they spend on students, due to either differences in priorities related to education or differences in their ability to raise education funds. Wide variations in education standards and resources can also lead to inequality of educational opportunities and insufficient attention being paid to long-term national requirements.
In recent years, many schools have become more autonomous and decentralised, as well as more accountable to students, parents and the wider public for their outcomes. The results of the OECD Programme for International Student Assessment (PISA) suggest that when autonomy and accountability are intelligently combined, they tend to be associated with better student performance (OECD, 2016[2]).
The levels of government responsible for funding education differ between levels of education. Typically, public funding is more centralised at the tertiary level than at lower levels of education. In 2016, on average across OECD countries, 58% of the public funds for non-tertiary education came from the central government before transfers to the various levels of government, compared to 87% of the funds for tertiary education (Table C4.2).
1. Year of reference 2017
2. Primary education includes pre-primary programmes.
Countries are ranked in descending order of the share of initial sources of funds from the central level of government.
Source: OECD/UIS/Eurostat (2019), Table C4.2. See Source section for more information and Annex 3 for notes (https://doi.org/10.1787/f8d7880d-en).
The division of responsibility for public funding in non-tertiary levels of education varies greatly among countries (Table C4.2 and Figure C4.3):
-
On average, central and regional governments are the main initial and final sources of funds in non-tertiary education. However, the central government is the only main initial source of funds and the only final purchaser of educational services in New Zealand. In countries such as Chile, Colombia, France, Greece, Hungary, Ireland, Israel, Italy, Luxembourg, the Netherlands, Portugal, Slovenia, Turkey and the United Kingdom, central government is the source of the majority of initial funds and the main final purchaser of educational goods and services.
-
In Austria, Estonia, Korea, Latvia, Lithuania, Mexico, Poland and the Slovak Republic, central government is the main initial source of funds, but regional and local authorities are the main final purchasers of educational services in non-tertiary education.
-
Regional governments are both the main initial source and the main final spender of education funds in Australia, Belgium, Germany, Spain and Switzerland. In Canada and Japan, regional governments are the predominant source of initial funds, but local authorities are the main final purchasers of educational services.
-
In Finland and Norway, local authorities are both the main initial source of funds and the main final purchasers of educational services. In the United States, both regional and local governments are the main initial sources of funds, but the local governments are the main final purchasers.
On average across OECD countries, more funds are transferred from central to regional and local levels of government for non-tertiary education than for tertiary education. This extends the scope for decentralisation at non-tertiary levels of education. On average across OECD countries, the share of public funds for non-tertiary education provided by the central government falls from 58% to 43% after transfers to other levels of government have been accounted for, while the share of local funds rises as a result from 25% to 42%. There is a great deal of variation in the sources of funds before and after transfers from central to lower levels of government. In Korea, Mexico, Poland and the Slovak Republic, the difference is more than 50 percentage points after transfers to regional and local governments, while in Australia, Austria, Chile, Estonia and Finland, the difference is between 25 and 40 percentage points. In Canada and the United States, where the regional level is mostly responsible for transferring funds to schools, the share of regional funding falls by 40 percentage points or more after transfers to local levels of government (Table C4.2 and Figure C4.3).
Tertiary education, however, is much more centralised than non-tertiary education, as the proportion of public funds coming from the central government is relatively large, both before and after transfers to lower levels of government (Table C4.2). On average across the OECD, the central government manages 87% of funds before transfers and this barely changes when intergovernmental transfers are taken into account. In most OECD and partner countries with data available, central government directly provides more than 60% of public funds in tertiary education; in 15 countries, central government is the only source of initial funding and there are no transfers to regional or local governments. In contrast, countries such as Belgium, Germany, Spain and Switzerland source over 60% of tertiary-level funding from regional governments with little or nothing transferred down to local governments. Local authorities typically do not have an important role in financing tertiary education, with the exception of the United States, where it generates and spend more than 10% of the funds.
Definitions
Intergovernmental transfers are transfers of funds designated for education from one level of government to another. They are defined as net transfers from a higher to a lower level of government. Initial funds refer to the funds before transfers between levels of government, while final funds refer to the funds after such transfers.
Public expenditure on education covers expenditure on educational institutions and expenditure outside educational institutions such as support for students’ living costs and other private expenditure outside institutions, in contrast to Indicators C1, C2 and C3, which focus only on spending on educational institutions. Public expenditure on education includes expenditure by all public entities, including the education ministry and other ministries, local and regional governments, and other public agencies. OECD countries differ in the ways in which they use public money for education. Public funds may flow directly to institutions or may be channelled to institutions via government programmes or via households. Public funds may be restricted to the purchase of educational services or may be used to support students’ living costs.
All government sources of expenditure on education, apart from international sources, can be classified under three levels of government: 1) central (national) government; 2) regional government (province, state, Bundesland, etc.); and 3) local government (municipality, district, commune, etc.). The terms “regional” and “local” apply to governments with responsibilities exercised within certain geographical subdivisions of a country. They do not apply to government bodies with roles defined in terms of responsibility for particular services, functions or categories of students that are not geographically circumscribed.
Total government expenditure corresponds to non-repayable current and capital expenditure on all functions (including education) of all levels of government (central, regional and local), including non-market producers (e.g. providing services and goods free of charge, or at prices that are not economically significant) that are controlled by government units, and social security funds. It does not include expenditure derived from public corporations, such as publicly owned banks, harbours and airports. It includes direct public expenditure on educational institutions (as defined above), as well as public support to households (e.g. scholarships and loans to students for tuition fees and student living costs) and to other private entities for education (e.g. subsidies to companies or labour organisations that operate apprenticeship programmes).
Methodology
Figures for total government expenditure and GDP have been taken from the OECD National Accounts Database (see Annex 2).
Public expenditure on education is expressed as a percentage of a country’s total government expenditure. The statistical concept of total government expenditure by function is defined by the National Accounts’ Classification of the Functions of Government (COFOG). There are strong links between the COFOG classification and the UNESCO, OECD and Eurostat (UOE) data collection, although the underlying statistical concepts differ to some extent (Eurostat (European Commission), 2011[3]).
Expenditure on debt servicing (e.g. interest payments) is included in total government expenditure, but it is excluded from public expenditure on education, because some countries cannot separate interest payments for education from those for other services. This means that public expenditure on education as a percentage of total government expenditure may be underestimated in countries in which interest payments represent a large proportion of total government expenditure on all services.
For more information please see the OECD Handbook for Internationally Comparative Education Statistics 2018 (OECD, 2018[4]) and Annex 3 for country-specific notes (https://doi.org/10.1787/f8d7880d-en).
Source
Data refer to the financial year 2016 (unless otherwise specified) and are based on the UOE data collection on education statistics administered by the OECD in 2018 (for details see Annex 3 at https://doi.org/10.1787/f8d7880d-en). Data from Argentina, the People’s Republic of China, India, Indonesia, Saudi Arabia and South Africa are from the UNESCO Institute of Statistics (UIS).
Note regarding data from Israel
The statistical data for Israel are supplied by and are under the responsibility of the relevant Israeli authorities. The use of such data by the OECD is without prejudice to the status of the Golan Heights, East Jerusalem and Israeli settlements in the West Bank under the terms of international law.
References
[3] Eurostat (European Commission) (2011), “Manual on sources and methods for the compilation of COFOG Statistics - EU Law and Publications”, Methodologies and Working papers, Eurostat, Luxembourg, https://doi.org/10.2785/16355.
[4] OECD (2018), OECD Handbook for Internationally Comparative Education Statistics 2018: Concepts, Standards, Definitions and Classifications, OECD Publishing, Paris, https://doi.org/10.1787/9789264304444-en.
[1] OECD (2017), The Funding of School Education: Connecting Resources and Learning, OECD Reviews of School Resources, OECD Publishing, Paris, https://dx.doi.org/10.1787/9789264276147-en.
[2] OECD (2016), PISA 2015 Results (Volume II): Policies and Practices for Successful Schools, PISA, OECD Publishing, Paris, https://doi.org/10.1787/9789264267510-en.
Table C4.1 Total public expenditure on education as a percentage of total government expenditure (2016)
Table C4.2 Share of sources of total public funds devoted to education (2016)
Table C4.3 Trends in total public expenditure on education as a percentage of total government expenditure (2005, 2010 and 2016)
Cut-off date for the data: 19 July 2019. Any updates on data can be found on line at https://doi.org/10.1787/eag-data-en. More breakdowns can also be found at http://stats.oecd.org/, Education at a Glance Database.
Statlink: https://doi.org/10.1787/888933981115
|
Table C4.1. Total public expenditure on education as a percentage of total government expenditure (2016)
|
|---|
|
By level of education
|
 |
|
Note: Public expenditure presented in this table includes both public transfers/payments to the non-educational private sector which are attributable to educational institutions and those to households for living costs, which are not spent in educational institutions. Therefore, the data presented here (before transfers) exceed those from public spending on institutions found in Indicators C1, C2 and C3. Data on public expenditure as a share of GDP (i.e. Columns 16 to 19) are available for consultation on line (see StatLink below). See Definitions and Methodology sections for more information. Data and more breakdowns available at http://stats.oecd.org/, Education at a Glance Database. |
|
1. Primary education includes pre-primary programmes. |
|
2. Year of reference 2017. |
|
Source: OECD/UIS/Eurostat (2019). See Source section for more information and Annex 3 for notes (https://doi.org/10.1787/f8d7880d-en). |
|
Please refer to the Reader’s Guide for information concerning symbols for missing data and abbreviations. |
|
Table C4.2. Share of sources of total public funds devoted to education (2016)
|
|---|
|
Before and after transfers, by level of education
|
 |
|
Note: Some levels of education are included with others. Refer to "x" code in Table C4.1 for details. See Definitions and Methodology sections for more information. Data and more breakdowns available at http://stats.oecd.org/, Education at a Glance Database. |
|
1. Primary education includes pre-primary programmes. |
|
2. Year of reference 2017. |
|
Source: OECD/UIS/Eurostat (2019). See Source section for more information and Annex 3 for notes (https://doi.org/10.1787/f8d7880d-en). |
|
Please refer to the Reader’s Guide for information concerning symbols for missing data and abbreviations. |
|
Table C4.3. Trends in total public expenditure on education as a percentage of total government expenditure (2005, 2010 and 2016)
|
|---|
|
Initial sources of funds, by level of education and by year
|
 |
|
Note: Public expenditure presented in this table includes both public transfers/payments to the non-educational private sector which are attributable to educational institutions and those to households for living costs, which are not spent in educational institutions. Therefore, the data presented here (before transfers) exceed those from public spending on institutions found in Indicators C1, C2 and C3. See Definitions and Methodology sections for more information. Data and more breakdowns available at http://stats.oecd.org/, Education at a Glance Database. |
|
1. Primary education includes pre-primary programmes. |
|
Source: OECD/UIS/Eurostat (2019). See Source section for more information and Annex 3 for notes (https://doi.org/10.1787/f8d7880d-en). |
|
Please refer to the Reader’s Guide for information concerning symbols for missing data and abbreviations. |
Metadata, Legal and Rights
https://doi.org/10.1787/f8d7880d-en
© OECD 2019
The use of this work, whether digital or print, is governed by the Terms and Conditions to be found at http://www.oecd.org/termsandconditions.