
5. Sugar
This chapter describes market developments and medium-term projections for world sugar markets for the period 2022-31. Projections cover consumption, production, trade and prices for sugar beet, sugar cane, sugar, molasses, and high-fructose corn syrup. The chapter concludes with a discussion of key risks and uncertainties which could have implications for world sugar markets over the next decade.
Higher per capita consumption in lower income countries against a continued decline in high income countries
Global sugar1 consumption is set to rebound for the second consecutive season (October 2021-September 2022, which is still estimated at the time we produce this Outlook), mainly underpinned by an economic recovery.
Over the coming decade, increased global sugar consumption is projected to continue thanks in particular to population growth in low-income countries, which is expected to drive growth (Figure 5.1). Urbanization and income gains, particularly in Asian and African countries, two regions where the per capita consumption level is comparatively lower, are likely to remain the key drivers of world sugar consumption from stronger demand for sugar-rich confectionery products and soft drinks. However, slowing global population growth over the next decade is expected to moderate increases in sugar consumption. In addition, in countries with a high level of per capita consumption, policies, public behaviour and business practices will likely continue to discourage sugar consumption because of health concerns. This will be most noticeable in high-income countries, mainly in North and Latin America, Europe and Oceania, where per capita consumption of caloric-rich sweeteners is expected to decline.
Overall, sugar is projected to remain the most consumed sweetener, accounting for around 80% of the global sweetener utilisation. Similarly, high fructose sweetener, mainly high fructose corn syrup2 (HFCS) is anticipated to maintain its position as the main alternative caloric sweetener after sugar, representing less than 10% share of total consumption, while the remaining proportion is represented by High Intensive Sweeteners (HIS), including saccharin, sucralose and aspartame, which are low-calorie or calorie-free.
World sugar production in 2021/22 is forecast to rebound after three years of decline, mainly as a result of favourable production prospects in India and Thailand, while in Brazil, the world’s largest producer, output is forecast to decline for the second consecutive season. Despite the year-on-year increase, world production is nevertheless expected to fall short of global consumption. As a result, global sugar inventories are anticipated to decline in 2021/22.
Assuming normal weather conditions, the production of sugar crops is foreseen to expand in the key producing countries. Sugarcane, which grows mainly in tropical and sub-tropical regions, will remain the main sugar crop, accounting for 87% of the aggregate output, with sugar beet making up the remainder. Productivity gains, including varietal improvement of crop plants, are expected to be the main drivers of production growth in India, Thailand and the European Union, as production area in these countries is projected to remain relatively stable. In Brazil, the increase is expected to come from both area expansion, due to remunerative prices, and yield improvements. In Africa, attractive policies determine procurement prices and increasing industrial demand are expected to boost plantings of sugar beet in Egypt, where efforts are also being made for the adoption of improved seed varieties. In South Africa, the second largest sugar producer in Africa, and Ethiopia, government support measures to the sector are expected to contribute to the increase in sugar production over the outlook period.
Over the next decade, an improvement in the sugar extraction rate is expected to increase sugar output, which will continue to compete with sugar crops used as feedstock for ethanol production. Brazil, whose processors are able to switch easily between sugar and ethanol production is foreseen to continue to allocate more sugarcane to ethanol production over time, but the projected fall in crude oil prices, in real terms, as well as the assumed expected depreciation of the Brazilian real will sustain higher production of sugar over the next decade. In India, the government continues to promote a national ethanol blending programme,3 which would reduce the availability of sugarcane for sugar production.
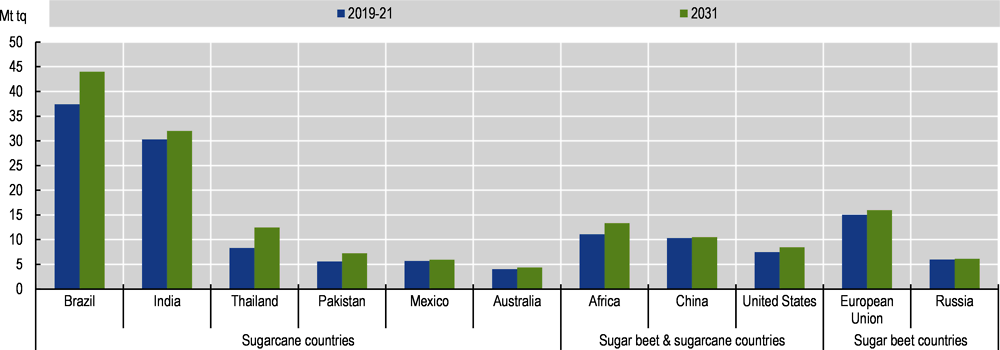
In 2031, Brazil and India are foreseen to account for about 23% and 17% of the world's total sugar output, respectively, with 44 Mt and 32 Mt produced. Elsewhere, the largest increases in production, in absolute terms and compared to the base period,4 are anticipated in Thailand (+ 4.1 Mt) and Pakistan (+ 1.7 Mt).
Source: OECD/FAO (2022), “OECD-FAO Agricultural Outlook”, OECD Agriculture statistics (database), https://doi.org/10.1787/agr-outl-data-en.
World trade in sugar is anticipated to increase by 1.3% p. a. over the next decade with shipments representing about 35% of global sugar production. Over 60% of the sugar traded globally will continue to be in the form of raw sugar from sugarcane, the remainder in the form of white (refined) sugar from sugarcane and sugar beet. Brazil will retain its position as the leading sugar exporter (up to 49% of world trade), followed by Thailand, Australia, and India. Imports are anticipated to remain less concentrated with the main increases, compared to the base period, projected in Asia and Africa, while the strongest declines in imports are foreseen in the European Union and the United States, reflecting a decline in domestic demand.
International sugar prices reached a four-year highs in 2021 underpinned by concerns over reduced sugar export availabilities in Brazil, amid a strengthening of global demand for sugar. However, in real terms, they are foreseen to trend downwards over the projection period, on account of productivity gains, slowing demand growth and declining crude oil prices5 making ethanol less competitive. The white sugar premium (the difference between white and raw sugar prices), which averaged USD 82/t during the base period, is projected to increase slightly in nominal terms to USD 87/t by 2031.
The impact of Russia’s war against Ukraine, the emergence of new COVID-19 variants and subsequent potential supply chain disruptions would alter the projections, especially in the first years. Over the outlook period, weather related production shortfalls (also related to climate change), crude oil price volatility, or increased crop competition would also cause variability or alternative trends in the supply and demand for sugar crops. The policy environment also creates some uncertainty as sugar remains a fairly regulated sector despite the efforts of some countries, including the European Union and Thailand, to deregulate it. Conversely, investments on research and development could create opportunities on the supply side.
After some declines in late 2021 and early 2022, international sugar prices rebounded sharply in March 2022, mainly reflecting expectations of a higher diversion of sugarcane to ethanol in Brazil due to higher international crude oil prices.
Early indications for 2021/22 point to a likely second consecutive season of a tight supply-demand balance in the sugar market. Although world sugar production is forecast to rebound after three years of decline, it is nevertheless expected to fall short of global consumption. The recovery in world sugar production in 2021/22 is largely based on expectations of production rebounds in the European Union and Thailand, coupled with favourable prospects in India. By contrast, production is expected to decline in the People’s Republic of China (hereafter “China”) and in Brazil, the world’s largest producer. Global economic growth is expected to bolster world consumption of sugar, which is set to increase for the second consecutive year after the COVID-19 related downturn in 2019/20. The forecast for world sugar trade in 2021/22 is around 60 million tonnes, slightly down from the estimated volume in 2020/21. This mainly reflects lower exports by Brazil and India, compared with their record sales in 2020/21. Global import demand is also anticipated lower in 2021/22 mainly on account of high import costs, with China and Indonesia continuing to lead as the largest buyers.
5.3.1. Consumption
Global sugar consumption growth driven by middle and low-income economies
Global sugar consumption is projected to continue growing at around 0.9% p.a. over the next ten years, reaching 188 Mt by 2031, driven by population and income growth. However, average per capita consumption at the global level should not change much, and remain close to 21.9 kg/cap. This reflects considerable variations between regions and countries, which are expected to persist over the next decade, with an increase in per capita consumption in middle and low-income economies expected to offset a decline in high-income countries (Figure 5.2). In general, in middle and low-income economies, the foreseen increase in caloric sweetener consumption is proportionately higher when incomes are lower. By contrast in high-income countries, where per capita sugar consumption has trended downwards in the past, intake is projected to decline further over the next decade reflecting consumers’ shift toward food with low sugar content. However, high income countries still record the highest level of per capita sugar consumption whose continuing decline is expected to be reflected at the global level by 2031.
The largest contributions to additional demand relative to the base period will be in Asia (71%) and Africa (31%). In these two sugar deficit regions, despite the continuous expansion over the past years, per capita consumption levels remain generally low compared to other regions, and the prospects for growth are high, given increasing urbanization, a growing middle class and young demographic. In Asia, a key driver of the growth rate is the higher indirect consumption for industrial purposes, including sugar-rich confectionery products and soft drinks, while in Africa the increase will be mainly underpinned by higher direct consumption, particularly in urban areas.
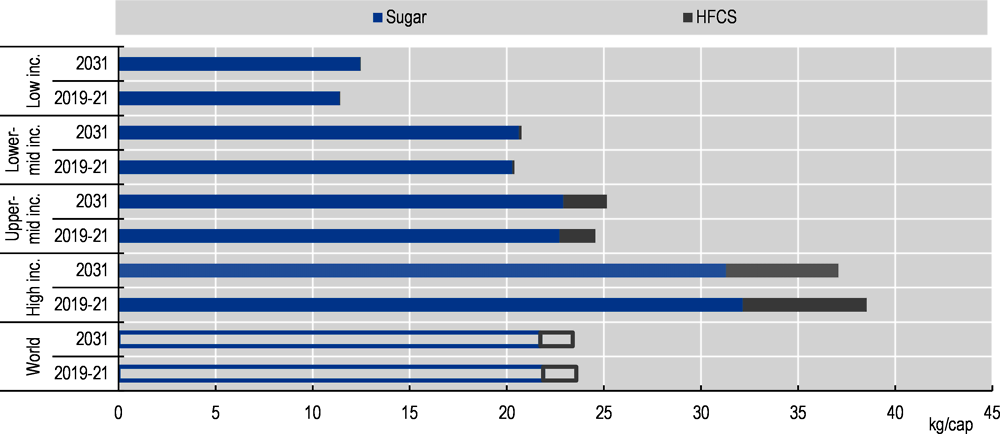
Note: data are expressed on a tel quel basis (tq).The 38 individual countries and 11 regional aggregates in the baseline are classified into the four income groups according to their respective per-capita income in 2018. The applied thresholds are: low: < USD 1 550, lower-middle: < USD 3 895, upper-middle: < USD 13 000, high: > USD 13 000.
Source: OECD/FAO (2022), “OECD-FAO Agricultural Outlook”, OECD Agriculture statistics (database), https://doi.org/10.1787/agr-outl-data-en.
In Asia, it is expected that India will provide the largest contribution to the overall increase in the level of sugar consumption, followed by China and Indonesia. This is based on population and income growth, and the expansion of the food and beverage industry. Per capita consumption in Asia is expected to grow by 0.6% p.a. over the next decade compared with 0.4% in the last decade. In Africa, the highest increases in total consumption are projected for Least Developed Sub-Saharan countries, which are foreseen to record the highest growth rate in per capita consumption over the next decade among African countries. By contrast, in South Africa, where sugar consumption has recorded significant declines in recent years amid government measures to discourage its use, per capita intake is projected to weaken further in the next decade. Despite the overall increase, both in Asia and Africa, average per capita consumption is projected to remain below the global average.
Over the coming decade, even if total daily carbohydrate intake in Asia and Africa remains higher than in the rest of the world (particularly Northeast and North Africa), simple carbohydrates (glucose and fructose from sugar, high fructose sweeteners, fruits and vegetables and lactose) will remain a small part of daily carbohydrate intake (Figure 5.3). In these two regions, in terms of carbohydrate intake, the increase in sugar consumption will not greatly affect the composition of the diet, as three quarters of carbohydrate consumption is from staple foods.
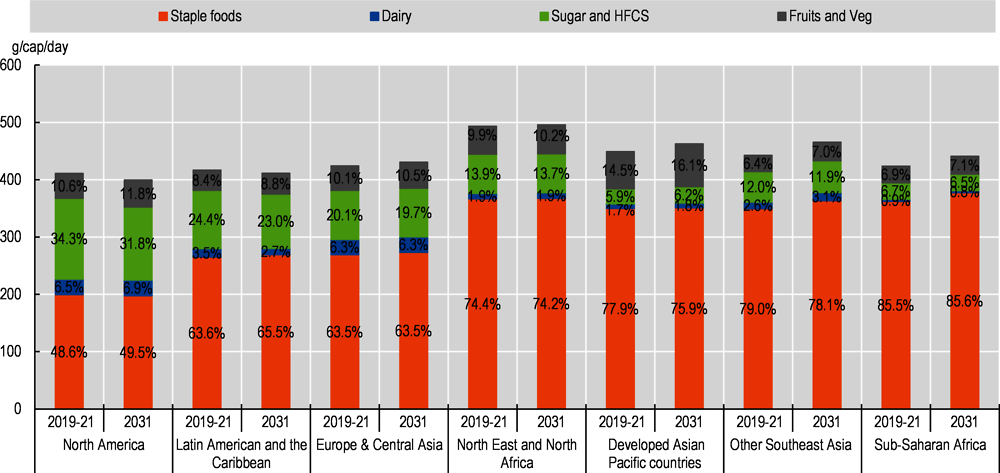
Note: Staple foods include cereals, roots and tubers, and pulses.
Source: OECD/FAO (2022), “OECD-FAO Agricultural Outlook”, OECD Agriculture statistics (database), https://doi.org/10.1787/agr-outl-data-en.
Downward trends will continue in high sugar consuming countries
In Latin America, the world’s largest supplier region, per capita sugar consumption has reached levels that raise concerns about the potential negative health effects. Some have introduced a sugar tax during the last decade (Chile, Ecuador, Mexico, Peru) to try to fight obesity. This has contributed to the relatively low regional growth, only 5% over the outlook period. Downward trends that have taken place will continue, albeit at a slower pace than in the past decade. In carbohydrates, this will result in a reduction of simple sugars in favour of starch-based sweeteners.
During the last decade, taxes on caloric sugary products were introduced in in some countries in an attempt to reduce sugar consumption. In addition, measures to limit the sale and/or the promotion of sugary drinks or sweet products to children under 18 years were taken, while some food companies have reduced portion sizes and the amount of caloric sweeteners in products. The overall intakes of caloric sweeteners from this regional aggregate is expected to decline further over the next ten years.
The United States is the country where the consumption of caloric sweeteners, including HFCS, is very high; caloric sweeteners represent the highest share of carbohydrates consumed per capita. It is also the country where, over the projection period, this share is projected to decrease the most in favour of greater consumption of fruit and vegetables. New Zealand, Australia, followed by Canada and countries in Western Europe are also expected to see a continued decline in their per capita sugar consumption, albeit at a slower pace than in the previous decade. In Russia, even if the level of per capita consumption is already high, it is not projected to change much as sugar is considered a staple food.
The High Fructose Corn Syrup market will remain dominated by a few players
HFCS is used primarily in beverages. Unlike sugar, it is a liquid product and less easily traded. Global consumption, will remain the domain of a limited group of countries; it is projected to grow by 0.6% p.a. or 1 Mt (dry weight) by 2031.
The biggest increase will occur in China, one of the few countries with low per capita sweetener consumption. As the world’s largest starch producer, China is projected to increase its supply of HFCS to meet growing domestic demand (3.1 kg/cap in 2031), although a lack of profitability is likely to dampen this growth. No much increase is foreseen in Japan and Korea with a consumption of about 6kg/cap. In the European Union, high fructose sweetener will still face competition from other sweeteners and will represent only 1.8 kg/cap in 2031 (compared to 1.2 kg/cap during the base period).
The United States and Mexico will remain the main consumers with respectively 14.4 and 10.1 kg per person. In the United States, the leading HFCS producer, a decline is foreseen as the potential greater health hazard of HFCS over sugar continues to be debated; the share of HFCS in total caloric sweetener consumption is expected to continue to decrease from 36% during the base period to 32% by 2031. In Mexico, government makes efforts to reduce caloric sweetener consumption and per capita HFCS consumption is expected to flatten over the next ten years. As a result of the weak demand, the United States is foreseen to record a production decline (-10%) of HFCS over the outlook period, reaching 6 Mt by 2031.
Globally, little change is expected in the distribution of the demand for sweeteners. 80% of the overall amount consumed will remain sugar and a bit less than 10% high fructose sweetener, the leading alternative product. The remainder will come from high-intensity (low-calorie) sweeteners, which are not covered in the Outlook.
5.3.2. Production
Given normal weather conditions, sugar production is foreseen to increase slightly over the outlook period, but a surge in input costs is likely to moderate the magnitude of the increase. Remunerative prices are nevertheless foreseen to be high enough to support investments and developments in the sector.
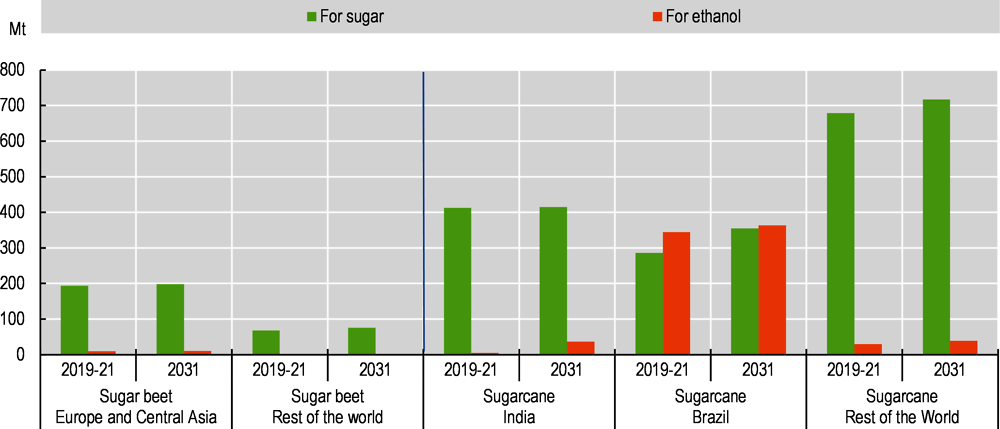
Sugarcane is the main (86%) sugar crop, used mainly to produce sugar but also as feedstock for ethanol production. In addition to sugar and ethanol, sugarcane can produce molasses, a thick juice. The residue from milling cane (bagasse) is used to supply energy (cogeneration feedstock for electricity). The sugar beet crop, which has two derivative products beet pulp and molasses, is used to produce a wide range of products, including food (sugar), feed, bio-based products for industry (pharmaceuticals, plastics, textiles and chemicals) and ethanol. Over the next ten years, the profitability of the two main sub-products of the sugar crops, sugar and ethanol, are projected to expand slightly, which will drive an increase in sugar crop production (Figure 5.4).
Increasing yields is the main driver of higher sugar production
Over the outlook period, global sugarcane production is projected to grow by 0.8% p.a. and reach 1 924 Mt by 2031 (+168 Mt), with Brazil and India anticipated to contribute 58% of the increase in global output volume (52% and 19%, respectively). This mainly reflects relative higher crop yields notably in Thailand, Australia, Pakistan, Mexico and India, while area expansion is only expected in Brazil. Prospects are less robust for sugar beet, where only the improvement in yields (+2.3%) will contribute to an increase in production globally. Sugar beet production is projected to reach 284 Mt by 2031, with a slower annual growth rate (0.2% p.a.) than during the past decade (0.9% p.a.) (Figure 5.4). Compared to the base period, an increase in production is expected in the United States (+5 Mt), Russia (+2.9 Mt), the European Union and Egypt (+1.2 Mt), Iran (+0.7 Mt), while contractions are projected in Ukraine (-1.6 Mt). Research and development of improved sugar varieties, with a focus on drought-resistant varieties, is ongoing and is expected to benefit overall productivity.
Source: OECD/FAO (2022), “OECD-FAO Agricultural Outlook”, OECD Agriculture statistics (database), https://doi.org/10.1787/agr-outl-data-en.
Brazil is the biggest sugarcane producing country, more than half of which is used to produce ethanol. Over the next ten years, some area expansion is foreseen, but considering the competition with other crops for land, the share of sugarcane in arable land (13%) will increase only slightly (+7%). A return to wetter climatic conditions should help to improve the yields, notably in the first years of the projections. In India, the growth in sugarcane production is projected to stem entirely from higher crop yields, as acreage is not expected to expand given competition from other agricultural crops. In Thailand, sugarcane production over the next decade is also expected to come mainly from higher yields. In recent years, lower returns compared to alternative crops, stricter government measures limiting burning practices during harvest and adverse weather conditions contributed to a decline in area, but over the next decade, area is therefore not projected to expand significantly. In China, despite the still recent wish of the authorities to support sugar production, increases in sugar crops production will be small as it will continue to face competition from other crops and increasing land and input costs.
Globally, given rising input costs, the expansion foreseen in sugar beet production over the outlook period will be low. Sugar beet area is expected to decline, because of higher fertiliser prices, but higher yields mean the crop will keep market share. This should notably be the case in the United States, where both sugar crops are cultivated with about 55% of sugar continuing to be produced from sugar beet. In the European Union, production growth is projected to be weak, due notably to a lack of alternatives to neonicotinoid insecticides and high input costs compare to other crops. In Egypt, remunerative procurement prices are expected to boost plantings of sugar beet, while efforts are also made for the adoption of improved seed varieties.
Over the outlook period, about 80% of the sugar crops will be used to produce sugar (78% in the case of sugarcane and 96% in the case of sugar beet) and 20% for ethanol. Brazil will continue to be the main producer of sugar and sugarcane-based ethanol, producing 37% of the world's sugarcane by 2031. Its sugarcane will be used for 24% of global sugar production and 83% of global sugarcane-based ethanol production (compared to 21% and 91% during the base period).
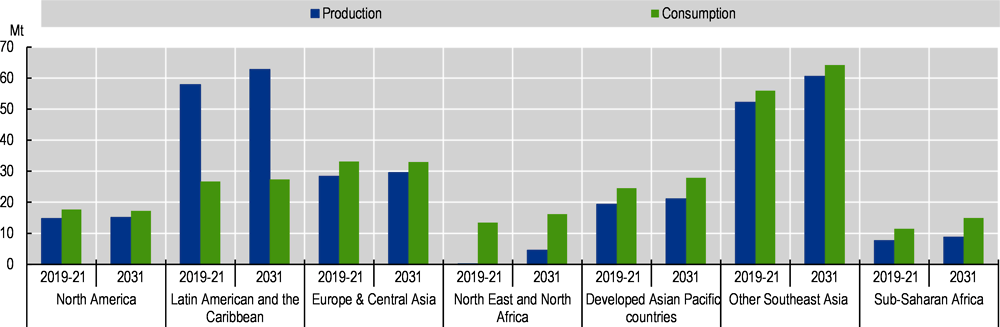
Global sugar production is expected to increase to 190 Mt by 2031. Most production increases are expected to occur in Asia and Latin America as well as Africa (Figure 5.5); those regions are projected to represent 73% of global sugar production by 2031 (compared to 72% in the base period) with the result that OECD countries will continue to lose market shares.
Note: data are expressed on a tel quel basis (tq)
Source: OECD/FAO (2022), “OECD-FAO Agricultural Outlook”, OECD Agriculture statistics (database), https://doi.org/10.1787/agr-outl-data-en.
Asia, the leading region, is projected to expand its share in global production from 38.6% during the base period to 39.2% by 2031. Thailand, the world’s third largest sugar producer, is foreseen to provide the largest share of the sugar supply after Brazil, increasing its sugar production by +4.1 Mt by 2031 compared to the base period. This significant production increase is in line with higher sugarcane production and with sugar extraction rates projected to remain at the high level of the past few years. In India, the world’s second largest sugar producer, the growth rate in sugar production is expected to be lower than in the past decade, reflecting a slower growth in sugarcane production and greater diversion to ethanol. In Latin America, Brazil which is also the world’s largest producer, has an industry that easily switches producing sugar for exports and producing ethanol for domestic use.6 Supported by profitable sugar export prices and rising oil prices at the start of the projection period, Brazil is expected to recover from a long financial crisis and some episodes of drought; compared to the base period, its sugar production is expected to increase by 6.6 Mt and the share of its cane production devoted to sugar production is expected to increase, but still remain slightly lower than that used for ethanol production (49% in 2031). Africa is expected to improve its share in the global market thanks to Egypt (+0.7 Mt) on account of the increasing industrial demand, but also in South Africa (+0.2 Mt) and other Sub-Saharan African countries, where government support measures are expected to contribute to the increase in sugar production over the next years.
Compared to the base period, production in OECD countries is foreseen to account for only 13% of the global increase. In 2031, the region will represent 22% of the global market, compared to 23% in the base period. Relative to the base period, the United States and the European Union are foreseen to increase the most with respectively +1 Mt and +0.9 Mt. Production in the United States will continue to benefit from several government policies that support the domestic industry including the Sugar Loan Program that supports prices paid to farmers; the Sugar Marketing Allotments that aim for domestic production to cover up to 85% of domestic consumption; the Feedstock Flexibility Program that diverts any sugar surplus to ethanol production, rather than sugar loan forfeitures to the USDA’s Commodity Credit Corporation; and trade barriers that limit imports to meet only domestic needs (through tariff rate quotas, regional agreements, and the Suspension Agreements on Sugar with Mexico). The European Union will maintain its position as the world’s third largest producer, taking advantage of improved techniques and a stagnation of sugar beet-based ethanol production.
Global sugar stocks, which increased during the COVID-19 pandemic, reached an all-time high stock-to-use ratio level, but are expected to decline in the early years of the projection period, before increasing such that the global stock-to-use ratio is foreseen to slowly return to its long-term level (45%).
5.3.3. Trade
Sugar to remain highly traded over the outlook period
Sugar will remain a highly traded product, with imports representing 35% of global consumption. Asia and Africa are expected to remain net-importing regions. However, in Africa, efforts to boost domestic production capacities will reduce its share of dependence on imports, which will still represent 67% of consumption in 2031, but down from 72% during the base period. Asia should not see big changes in terms of dependence and imports will continue to represent 41% of consumption. By 2031, Africa and Asia will account respectively for 26% and 59% of global imports.
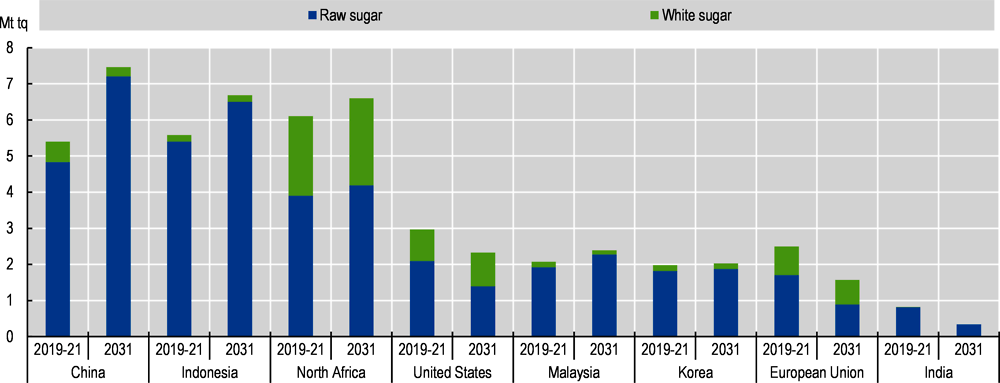
No major change is expected in the distribution of sugar imports between raw and refined. Most will continue to be raw sugar (63%) even though the share of white sugar imports that includes a premium will increase (Figure 5.6). In Asia, the share of imported white sugar will decline slightly compared to the base period, when unusually high imports were reported in some countries, while in Africa, it is expected to increase, mainly driven by LDC countries in Sub-Saharan Africa.
During the base period, North Africa, Indonesia and China were the leading importers (at 6.1 Mt, 5.6 Mt and 5.4 Mt), followed by the United States (3.0 Mt), the European Union (2.5 Mt), Malaysia (2.1 Mt) and Korea (2.0 Mt). Over the next decade, with a strong growth in consumption, China is projected to consolidate its position as the leading sugar importer by 2031 (7.5 Mt), followed by Indonesia (6.7 Mt), North Africa (6.6 Mt), the United States (2.3 Mt), Malaysia (2.4 Mt), and Korea (2.0 Mt). Although from a lower base, strong growth is expected in LDC Africa and Asia.
Sugar imports are expected to decline mainly in the European Union, the United States, India, Iran and South Africa, due to reduced demand. In the United States, traditionally a sugar-deficit country, policies will continue to foster domestic production and limit imports. Tariff rate quota (TRQ) allocations under WTO or free trade agreements (FTAs), as well as limited imports from Mexico due to the US Export Limit (set by the US Department of Commerce) will govern import flows. Given the relatively higher sugar prices in the United States, Mexico will continue to export its sugar primarily to fulfil United States needs. Mexico is expected to continue resorting to US HFCS to meet national demand for sweeteners. In the European Union, the region used to import raw sugar from countries with which it had preferential agreements, but the opportunities have become less attractive for exporting partner countries since 2017, when the abolition of quotas led to lower prices. EU sugar imports are projected to meet lower demand and decrease to 1.6 Mt by 2031.
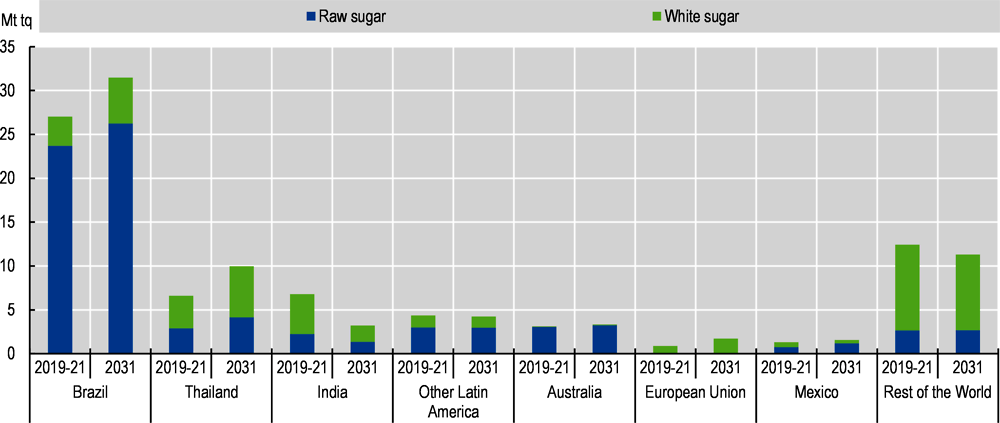
On the export side, sugar markets are projected to remain highly concentrated (Figure 5.7). Four main countries will continue to account for more than 84% of the market share for raw sugar by 2031: Brazil (64%), Thailand (10%), Australia (8%) and India (3%). For white sugar, Brazil (25%), Thailand (23%), India (6%) and the European Union (6%) will supply about 60% of the market.
Note: data are expressed on a tel quel basis (tq)
Source: OECD/FAO (2022), “OECD-FAO Agricultural Outlook”, OECD Agriculture statistics (database), https://doi.org/10.1787/agr-outl-data-en.
Note: data are expressed on a tel quel basis (tq)
Source: OECD/FAO (2022), “OECD-FAO Agricultural Outlook”, OECD Agriculture statistics (database), https://doi.org/10.1787/agr-outl-data-en.
Brazil will remain by far the leading exporter (49% in 2031) (Figure 5.7). Millers should benefit from attractive incentives to produce sugar for exports, while any continuing weakness of the country’s currency against the US dollar will improve sugar’s competitiveness. Favourable returns for sugarcane-based ethanol production will continue to play a key role, but the expected growth in sugarcane production for sugar is higher than for ethanol which frees up more sugar for exports. Brazilian sugar exports are expected to reach 33.5 Mt in 203, +6.4 Mt over the outlook period, mainly under the form of raw sugar as relatively little refined sugar is exported.
In Thailand, the world’s second largest sugar exporter, very little ethanol is produced directly from sugarcane (less than 2%) where molasses or cassava are used. By 2031, the share of sugar exports is expected to increase to 15% and reach nearly 10 Mt. This compares to a share of 11% and a volume of 6.6 Mt during the base period, which is due to the drop in production in 2019 and 2020. In India, the government’s continued efforts to promote ethanol is projected to contribute to a decline in sugar exports from the current record volumes. In Australia, another export-oriented producing country, sugar production is foreseen to be sustained by favourable prices and return to a slight upward trend for a few years but sugarcane production will be constrained by the availability of irrigated land with sugar exports continuing to account for about three quarters of production.
5.3.4. Prices
Prices expected to fall in real terms
With indications of a second consecutive season of a tight supply-demand balance, international sugar prices are expected to remain relatively high in the current season, following the surge in crude oil in the first quarter of 2022. Higher crude oil prices prompted mills in Brazil to increase the volume of sugarcane crushed for ethanol at the expense of sugar, providing upward pressure on sugar prices.
International sugar prices are expected to remain high in the short term, but to fall subsequently, driven improved production prospects (Figure 5.8). Nominal prices are projected to follow a moderate upward trend, as demand is foreseen to return to pre-COVID-19 pandemic levels while supply should easily meet demand, assuming little change in relative ethanol and sugar prices. However, price volatility may result from domestic policies and the dominance of few exporters over the next ten years.
Real prices are projected to fall from the current high levels and resume their long-term decline due to productivity gains from better yields and slower demand growth (Figure 5.2). Overall, real prices should fall below the average level of the last 20 years, when prices were under upward pressure due to competition from biofuels (ethanol).
The white sugar premium is projected to increase slightly in absolute nominal terms, with a slight increase of the share of white sugar exports in total trade.
Health concerns and developments in energy markets likely to predominate
In the short term, international sugar markets remain dependent on the developments of Russia’s aggression against Ukraine. While sugar markets are not directly impacted, Petrobras, the state-owned Brazilian petroleum industry, reacted to the changes in crude oil prices by raising its price of gasoline, which provide an incentive for millers to divert more cane to ethanol production and less for sugar. Global supply could also be impacted by a reduction in the supply of fertilisers, Russia and Belarus being two big exporters, which would have consequences on the expected growth in sugar crop yields. Changes in crude oil prices, a key element for the profitability of sugar crop-based ethanol production, remain a major source of uncertainty for the sector. In Brazil, and also increasingly in India, millers can easily prioritise sugar production over that of ethanol or vice versa.
On the demand side, the COVID-19 pandemic is still ongoing and new variants could disrupt the supply chain again. With currently volatile markets, the expected recovery in growth could be postponed, with some significant consequences on low-income countries where strongest growth is expected.
The Outlook assumes normal climatic conditions which gives favourable prospect for sugar crop production. But unfavourable weather events, such as from climate change, could have a marked impact on output and prices, considering the relatively high market concentration for export. Episodes of droughts could lead sugar cane growers to switch to alternative drought-resistant crops, given that sugar cane is water intensive. A change in the price ratio between crops could also influence planting decisions in favour of more profitable crops.
Significant government intervention persists in many countries, with the aim of protecting domestic production. There have been efforts to liberalise sugar markets, notably in the last decade (European Union, Thailand). In India, the recurrent use of export subsidies to free the market from excess sugar could have an impact on markets.
New investment in research and development in the sugar for alternative lower calorie sugar substitutes is strong given the increasing health concerns and could well result in disrupting the dynamics of the market. Similarly, on the supply side, new breeding techniques for sugar crops (gene editing) and new diversification opportunities for the sugar industry would open new opportunities for the sector (e.g. bioethanol, bioplastics and biogas).
Notes
← 1. See glossary for definition.
← 2. See glossary for definition.
← 3. For more information, see the chapter on biofuels.
← 4. The base period refers to the period October 2019 to September 2022, and therefore includes estimated numbers.
← 5. See https://openknowledge.worldbank.org/bitstream/handle/10986/36350/CMO-October-2021.pdf.
← 6. Brazil has a large fleet of hybrid vehicles running on E25.