
copy the linklink copied!2. Maintaining high employment
copy the linklink copied!Introduction
Norway has a well-functioning labour market. It delivers high quality employment to many people. A majority of jobs in Norway are secure, workers are well remunerated, and job strain is low. Norway’s socio-economic model, including highly coordinated wage bargaining, delivers a compressed wage distribution and low inequality in incomes and wealth. Continued prudent fiscal management, supported by oil wealth, will be able to fund high quality support and assistance to the less fortunate well into the future.
This favourable situation, however, faces some challenges. Norway has been experiencing a trend decline in employment rates among certain groups, in particular among the young and prime-age men. Immigrants and people with disabilities have poorer labour market outcomes than rest of the population. While Norway’s workers are highly skilled, OECD PISA scores for educational attainment indicate relative weakness, in particular given very high education expenditures.
Norway still faces comparatively high sick-leave absence and, despite some falls in older cohorts, the share of the working-age population on disability support remains large. The rising number of young and middle-aged on long-term disability benefit, many with a low probability of re-entering the labour market, are particularly worrisome. Relatively high school dropout rates are also of concern, in particular as opportunities for workers with low educational attainment are limited in the Norwegian labour market. School dropouts face unstable low-skill low-wage paths, and many are not searching for jobs.
The government and social partners are aware of the challenges. High employment and labour participation are core to Norway’s socio-economic model and its fiscal sustainability. Much policy effort has been focused on keeping them elevated. For instance, recent pension reform raised participation among older cohorts and many adjustments to sick-leave compensation and disability benefits have been made in an effort to facilitate return to work. Nevertheless, success in tackling the challenges in labour-market participation has only been partial, and further work is required.
Furthermore, Norway, as other OECD countries, faces the challenges brought by slowing productivity growth, new technologies, globalisation and the changing nature of work. Moreover, Norway faces challenges from the restructuring of the economy and impending fiscal restraint that the gradual decline in the importance of oil will bring. Successful structural shift will require workers to have the right incentives and the right skills for high levels of employment and job quality in the future.
The next section of this chapter describes the labour market and identifies its main strengths and weaknesses. The chapter then discusses the policy areas with substantial scope for gain from reforms: i) sick-leave compensation and disability support; ii) early retirement incentives in old-age pensions; iii) education and skills; and, iv) integration of immigrants.
copy the linklink copied!Key aspects of Norway’s labour market
The labour market is currently tightening and performs well overall
The labour market has tightened over the last two years, amid a strengthening mainland economy. After a period of stagnation in the wake of the 2014 oil-price shock, employment has started growing again, and the unemployment rate continues to fall (Figure 2.1). This recovery has occurred across all sectors of the economy and soft indicators suggest continuing solid employment growth in the immediate future (Norges Bank, 2019). Wage growth has picked up to above 3%, hours worked per employee are rising and more people are entering the labour market. The employment rate has risen too (Figure 2.1).

Source: OECD Economic Outlook (database) and OECD Main Economic Indicators (database).
Based on the OECD Jobs Strategy dashboard, the Norwegian labour market is one of the best performing in the OECD (OECD, 2018a and 2018b; see also Box 2.1). Norway is among the top countries on most measures, and above the OECD average in all of them bar one (gender income gap) where it is very close to the average (Figure 2.2). The employment rate is relatively high, although now behind top performers, and unemployment is low. Workers receive comparatively high wages and labour-market insecurity and job strain are very low. Furthermore, there is a high level of equality in incomes and opportunity, and disadvantaged groups have relatively easy access to jobs.
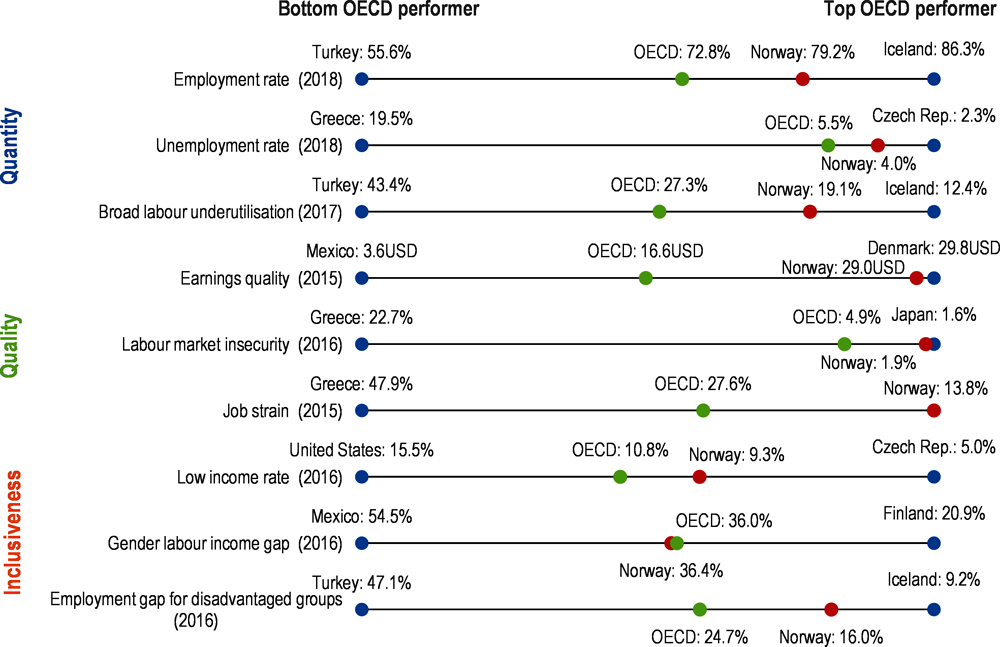
Note: Employment rate: share of working age population (20-64 years) in employment (%). Broad labour underutilisation: Share of inactive, unemployed or involuntary part-timers (15-64) in population (%), excluding youth (15-29) in education and not in employment (%). Earnings quality: Gross hourly earnings in PPP-adjusted USD adjusted for inequality. Labour market insecurity: Expected monetary loss associated with the risk of becoming unemployed as a share of previous earnings. Job strain: Percentage of workers in jobs with a combination of high job demands and few job resources to meet those demands. Low income rate: Share of working-age persons living with less than 50% of median equivalised household disposable income. Gender labour income gap: Difference between per capita annual earnings of men and women (% of per capita earnings of men). Employment gap for disadvantaged groups: Average difference in the prime age men's employment rate and the rates for five disadvantaged groups (mothers with children, youth who are not in full-time education or training, workers aged 55-64, non-natives, and persons with disabilities; % of the prime-age men's rate).
Source: OECD (2018), OECD Jobs Strategy https://www.oecd.org/employment/jobs-strategy/country/; OECD Employment database, www.oecd.org/employment/database; and OECD Income Distribution Database (IDD), http://oe.cd/idd.
The Norwegian labour market is also resilient (Figure 2.3), with capacity to absorb and adjust to economic shocks without large costs in terms of unemployment. Extensive use of active labour market policies for facilitating return to work among the unemployed are a key component. Norway’s workforce is highly skilled, strengthening adaptability to economic shocks as well as to structural shifts and technological change. Productivity growth has been close to the OECD average, and as in many other countries, it has undergone a marked slowdown (see Key Policy Insights). The level of output per worker (and GDP per capita), on the other hand, is very high in international comparison.

Notes: Resilience: average increase in unemployment rate over 3 years after a negative shock to GDP of 1% (2000-16); Labour productivity growth: annual average productivity growth (2012-18), measured in per worker terms. Share of low performing students: Share of 15-year-olds not in secondary school or scoring below Level 2 in PISA (%) (2015).
Source: OECD (2018), OECD Jobs Strategy https://www.oecd.org/employment/jobs-strategy/country/; OECD Productivity database and OECD Economic Outlook database.
The digital revolution, globalisation and demographic change are transforming labour markets. These deep and rapid transformations raise new challenges for policy makers. The new OECD Jobs Strategy, endorsed by OECD Ministers at their annual meeting in May and launched in December 2018, provides a coherent framework of detailed recommendations in a wide range of policy areas to help countries addressing these challenges. The new Jobs Strategy, in particular, goes beyond job quantity and considers job quality and inclusiveness as central policy priorities, while stressing the importance of resilience and adaptability for good economic and labour market performance in a changing world of work. The key message is that flexibility-enhancing policies in product and labour markets are necessary but not sufficient. Policies and institutions that protect workers, foster inclusiveness and allow workers and firms to make the most of ongoing changes are needed to promote good and sustainable outcomes. The OECD Jobs Strategy makes use of a data dashboard to assess the strengths and weaknesses of labour markets.
Two Jobs Strategy Implementation Notes have been prepared to support Norway with the implementation of the Jobs Strategy. These notes contain additional analytical work that accompany the analysis in this chapter on employment barriers (Fernandez et al., forthcoming) and wage inequality, job mobility and reallocation (Hijzen et al., forthcoming). More information on the implementation of the OECD Jobs Strategy can be found here: http://www.oecd.org/employment/jobs-strategy
Despite Norway’s overall impressive performance, there are areas of weakness and developments that pose challenges for the labour market and the “Nordic” model. The remainder of this section discusses these in more detail, following the structure of the OECD Jobs Strategy Dashboard.
Employment rates are high but have deteriorated over time
Norway has a high employment rate, more than 6 percentage points above the OECD average among those aged 20-64 years, but it used to be even higher. Some of the decrease in overall employment rates is due to population ageing and young people staying at school longer, but both the level and position relative to other countries have slid over the past decade (Figure 2.4). While Norway’s employment rate of 20-64 year olds has declined, it has increased in many other countries and is now higher in several countries. The recent tightening in Norway’s labour market has only brought a partial turnaround.

Source: OECD Employment database, www.oecd.org/employment/database .
The relative slide in employment rates has been most pronounced in prime-age cohorts. The employment rates of men aged between 25 and 54 decreased by about four percentage points between the peak in 2008 and 2018, and is now below the OECD average. For prime-age women, the rate fell by three percentage points in the same period, albeit from a high level, while it kept rising in many other countries (Figure 2.5). Employment rates also declined among youth, reflecting, in part, more time spent in education. Older cohorts show comparatively high employment rates that have risen further. It is nevertheless striking that despite pension reform and efforts to tackle issues in disability support, progress is slower than in many other countries (Figure 2.5).

Source: OECD Employment database, www.oecd.org/employment/database .
Good job quality and a compressed wage distribution make for an inclusive labour market
Job quality in Norway is among the best in the OECD (Figure 2.2). On earnings quality (as measured by gross hourly earnings in PPP, adjusted for inequality) and labour market insecurity (measured by expected monetary loss associated with the risk of becoming unemployed), Norway is among the top performers. Job strain (measured by the share of workers in jobs with a combination of high job demands and few job resources) is the lowest among OECD countries.
Norway’s labour market is typical of the Nordic model, with a tradition of tripartite agreements and a strong role for trade unions, which help attain low income inequality, mostly by compressing the wage distribution (Figure 2.6). The role of taxes and transfers in lowering inequality is also significant, although closer to the OECD average; with high employment rates and low wage inequality there is less need for ex post redistribution to achieve low inequality in incomes. The level of skills in the population is high and skills are quite equally distributed, with disadvantaged students less likely than in most other countries to underperform. Norway’s socio-economic model also delivers high equality of opportunity and income mobility – it is much more likely that someone from a low-income background reaches the average level of income than in most other OECD countries (OECD, 2018c).
Norway’s poverty rate – measured as the share of population with incomes below half of the median income - is low (Figure 2.7). Poverty rates are among the lowest in the OECD among the elderly (66 years and above), children (0-17 years) and adults (26-65 years). Low poverty rates among children and the elderly are particularly notable as in many other OECD countries these groups experience significantly higher risk of poverty than the rest of the population. However, the young (18-25 years) have poverty rates substantially above the OECD average. One explanation is that in Norway (as in some other countries such as Denmark and the Netherlands) a large proportion of tertiary-education students move out of their parents’ home into independent or shared accommodation, and are consequently included as separate households in census and survey data. Given that such students typically have above-average employment and earnings prospects, and often the financial support of parents, there may not be a substantive socio-economic problem.

Note: Income inequality measures are based on the distribution of the equivalised disposable household income. Income refer to cash income (excluding imputed components such as home production and imputed rents) regularly received over the year.
Source: OECD Employment database, www.oecd.org/employment/database; and OECD Income Distribution Database (IDD), http://oe.cd/idd .

Source: OECD Income Distribution Database (http://oe.cd/idd).
Employment rates of people with disabilities and non-natives could be higher
People with disabilities in Norway have almost 50 % lower employment rates than prime-age men, a gap significantly above the OECD average (Figure 2.8). Non-natives have nearly a 20 % gap, also large, although below the OECD average. In contrast, for other potentially disadvantaged groups, such as mothers with young children, youth (15-29 years) not in full-time education or training, and older workers, Norway is among top performers.

Note: Countries are sorted in ascending order of the employment gap (i.e. from best to worst performing). Number in parenthesis indicates the rank from best performing. For each group, the employment gap is the difference between the employment rate of prime-age men (aged 25-54 years) and that of the group, expressed as a percentage of the employment rate of prime-age men. Panel A: Mothers with young children refer to working-age mothers with at least one child aged 0 to 14 years. Panel B: Data refer to all foreign-born people with no regards to nationality. Panel C: In the case of youth, those that are in full-time education are excluded from the denominator of the employment rate. Panel D: Data refer to 2011 except for Norway (2016). Panel F: The overall indicator is a weighted average of the employment gaps for each group.
Source: OECD (2018), Good Jobs for All in a Changing World of Work: The OECD Jobs Strategy, https://doi.org/10.1787/9789264308817-en .
Norway has a relatively high gender labour income gap (Figure 2.9). On average, women aged 18-64 years receive 35 % lower labour income than men of the same age. Employment rates for women are high and the employment rate gap between men and women is far below the OECD average. Moreover, the gender earnings gap for full time employees (due to for example men and women working in different sectors and occupations) is small. Much of the total gender labour income gap therefore stems from the fact that women in Norway work shorter hours. Employed women work on average close to 15% fewer (usual weekly) hours than men. There is also a relatively high share of women that work part-time and a high share of those that work very short hours. Norwegian policy has long put a high priority on reducing gender gaps in the labour market and outcomes have been steadily improving over time. For example, Norway was an early mover in introducing statutory quotas for women on the boards of public limited companies. Nearly 45 % of board members are now women among large listed companies (OECD, 2018d).

Note: Gaps are computed as the difference of the relevant indicator for men and women expressed as a percentage of that of men. The Norway's rank from the best performing OECD country is indicated in parenthesis. OECD is an unweighted average in Panels A and B and a weighted average in Panels C and D.
Source: Gender labour income gap: OECD calculations based on the European Union Statistics on Income and Living Conditions (EU-SILC) for European countries; OECD Family database; and OECD Employment Database (www.oecd.org/employment/database).
Coordinated wage bargaining and labour migration help absorb shocks
Norway’s labour market adjusts well to economic shocks, which helps limit their impact on the unemployment rate. A highly coordinated wage bargaining system ensures that real wages are responsive to macro-economic conditions. It is characterised by a “pattern bargaining” system. A target wage increase is negotiated for the manufacturing sector highly exposed to foreign competition. This wage norm then serves as a benchmark for wage rises in other sectors of the economy and provides an effective instrument for wage moderation. The resilience of the labour market is also supported by a flexible labour supply through labour migration. Norway has for a long time been strongly integrated with other Nordic economies, and since 2004, the labour market has been open to flows from new countries in the European Economic Area (EEA). Labour migration is quite responsive to economic cycles and acts as a shock absorber (Figure 2.10).

Note: Net immigration is the amount by which the number of immigrants is greater than the number of emigrants. Labour immigration is the number of first-time immigrants with non- Nordic citizenship with labour as the reason for immigration.
Source: Statistics Norway and OECD Economic Outlook database.
However, similar to many other economies, Norway has undergone a marked slowdown in productivity (Figure 2.11) and wage growth. Helped in part by oil wealth and terms of trade gains over the decades, Norway has benefitted from steady gains in living standards. Low wage inequality in combination with strong wage coordination could limit wage differences between firms and consequently undermine the ability of high-performance firms to attract workers, reducing optimal reallocation of workers. While wage compression is associated with relatively low levels of job mobility between firms, there is no indication that this has hindered the ability of high performance firms to expand in Norway (Box 2.2; Hijzen et al., 2019). Looking forward, it will be important to ensure continued effective operation of wage coordination, including its ability to support productivity growth and competitiveness.

1. The ratio between the index of export prices and the index of import prices.
2. Unweighted average of 35 available OECD countries.
Source: OECD Economic Outlook (database).
Norway places a strong emphasis on the role of public institutions and the social partners for ensuring that productivity gains are broadly shared, resulting in very low levels of wage inequality and high employment rates. However, low levels of wage inequality have sometimes raised concerns about the flexibility of wages and their ability to support strong productivity growth. Wage compression could limit the ability of high-performance firms to attract new workers and hence undermine the efficiency of labour reallocation between low and high performance firms. This box summarises a number of insights from new OECD work on the role of job mobility for the efficiency of labour reallocation based on a comparison between Norway and the United States, a country where wage-setting is considered very flexible (Hijzen et al., forthcoming). The analysis distinguishes between two forms of job mobility: direct job-to-job movements between firms, which are more likely to be voluntary based on differences in pay, and movements in and out of private-sector employment (reflecting movements between employment in the private sector to employment in the public sector or joblessness). More specifically:
-
Job mobility is considerably lower in Norway than in the United States. Job-to-job mobility is about twice as high in the United States as in Norway, while mobility in and out of private-sector employment is about 50 % higher. The lower rate of job-to-job mobility in Norway may be related to the fact that wage differences between firms are relatively small, resulting in weak incentives for workers to move to higher-wage firms.
-
The speed of reallocation of workers from low to high-wage firms is higher in Norway than in the United States, despite lower overall job mobility. While in both Norway and the United States, job-to-job mobility is the main source of job reallocation from low to high-wage firms, the role of worker movements in and out of employment is fundamentally different. In Norway, employment growth through net employment mobility is stronger in high-wage than in low-wage firms, while in the United States, employment growth through net employment mobility hires is stronger in low-wage than in high wage firms as low-wage firms seek to mitigate the impact of worker poaching by high-wage firms by hiring jobless workers. Employment mobility therefore complements job-to-job mobility in reallocating workers from low to high-wage firms in Norway, but undermines it in the United States.
-
Efficient labour reallocation in Norway is likely to reflect in part the importance of employment and social policies for job matching. In Norway, out-of-work income support and job-search assistance policies (e.g. counselling, job brokering) assist those out of work in finding a suitable job that corresponds to their experience and qualifications, thereby increasing the likelihood of finding a job in a high-wage firm. In the United States, such policies are much less well developed. As a result, workers may be more inclined to accept job offers that do not match their experience and qualifications and rely more on-the-job search for finding a suitable job. The relatively high rate of job-to-job mobility from low to high-wage firms in Norway further suggests that the system of coordinated wage bargaining does not significantly undermine the efficiency of labour reallocation. Indeed, it suggests that the bargaining system allows sufficient space for further adaptation at the firm level to support healthy levels of job-to-job mobility between firms with significantly different levels of productivity.

Note: The figure shows net employment growth due to net job-to-job mobility (workers movements between firms in the private sector) and net employment mobility (worker movements between the private sector and the public sector or joblessness) for low paying, middle paying and high firms as well as all firms. Low-wage firms correspond to firms with average pay in the bottom quintile of the distribution, middle-wage firms to those offering average pay in the second and third quintiles of the distribution and high-wage firms to those offering average pay in the top two quintiles of the distribution. Results for the United States are averaged over the period 1998 to 2011 and for Norway over the period 1995 to 2015.
Source: Hijzen, Lillehagen and Zwysen (forthcoming).
Technology and globalisation bring change and require new skills
Norway also is being affected by the labour market challenges brought by new technologies, globalisation and changing world of work that will increasingly involve new skills and new tasks, creating demand for certain jobs, while reducing it in other areas. Similar to other OECD countries, these processes have increased polarisation into high-skill/high-paying jobs and low-skill/low-paying jobs, with a hollowing out of middle-skill jobs (Figure 2.13).
One driver of job polarisation is technology's differential impact across skills and occupations, crucially depending on type of tasks performed (Autor et al., 2006; Goos and Manning, 2007; and Goos et al., 2009; OECD, 2017a). In particular, information and communication technology (ICT) generally complements high-skill workers performing complex cognitive tasks, while middle-skill clerical and production jobs, characterised by “routine” tasks, can be more easily automated with ICT. Many low-skill jobs (e.g. catering, cleaning or delivery), on the other hand, involve non-routine manual tasks that have so far proven more difficult to automate.

Note: High-skilled occupations include jobs classified under the ISCO-88 major groups: legislators, senior officials, and managers (group 1), professionals (group 2), and technicians and associate professionals (group 3). Middle-skilled occupations include: clerks (group 4), craft and related trades workers (group 7), and plant and machine operators and assemblers (group 8). Low-skilled occupations include: service workers and shop and market sales workers (group 5), and elementary occupations (group 9).
Source: OECD (2017), "How technology and globalisation are transforming the labour market", in OECD Employment Outlook 2017, https://doi.org/10.1787/empl_outlook-2017-7-en.
Technological change and globalisation are ongoing and understanding which jobs and skills are likely to become obsolete as technology develops further is important. Recent OECD work, exploiting the Survey of Adult Skills (PIAAC), estimates that a substantial share of jobs across the OECD will be significantly changed by technology (Figure 2.14). This research (OECD, 2019a and 2017a; Arntz et al., 2016, Nedelkoska and Quintini, 2018) argues that jobs with the same occupational title often have considerable differences in tasks, which is essential to gauging jobs at risk. Nedelkoska and Quintini (2018) estimate that the share of jobs expected to be substantially changed by automation in Norway is about one third (Figure 2.14). This is substantial, but lower than in all other countries examined. One of the main reasons is that Norway already exhibits the highest levels of information and communication technology (ICT) task intensity and non-routine employment in the business sector among OECD countries (Figure 2.15).
As regards future skill requirements, rising routinisation and further expansion of ICT applications will increase demand for skills that are complementary to technology. As reported by Nedelkoska and Quintini (2018) occupations with high automatability will typically only require a low level of education, while the least automatable occupations will almost all require professional training and/or tertiary education. Compared to previous waves of technological progress, whereby technology replaced primarily middle-skilled jobs creating labour market polarisation, artificial intelligence puts more low-skilled jobs at risk. With the exception of some relatively low-skilled jobs – notably, personal care workers – Nedelkoska and Quintini (2018) report a monotonic decrease in the risk of automation as a function of educational attainment and skill levels. These developments are likely to put further pressure in the coming decades on workers with low and middle levels of education who have already seen declining employment trends in recent years (Figure 2.16).

Note: Jobs are at high risk of automation if the likelihood of their job being automated is at least 70%. Jobs at risk of significant change are those with the likelihood of their job being automated estimated at between 50 and 70%. Data for Belgium correspond to Flanders and data for the United Kingdom to England and Northern Ireland.
Source: OECD Employment Outlook 2019.
Ensuring that children and adults have access to education and training that delivers appropriate skills must therefore be a priority. Stronger core skills and readiness to learn – and not only ICT specialist skills - can ensure that individuals are able to adapt more easily in a world where jobs and tasks may change more often than they have in the past (OECD, 2016a and 2017b). In addition to ICT-specialist skills, there is increasing demand for ICT-generic skills that enable use of technologies for professional purposes and for ICT-complementary skills such as information processing, problem solving and communication. Foundation skills, digital literacy as well as social and emotional skills are important for effective use of technology.

Note: The “routine intensity of jobs” captures the degree of independence workers have to plan and organise their activities and time, as well as their freedom to decide what to do on the job and in what sequence. The “ICT task intensity of jobs” reflects the extent to which workers perform tasks ranging from simple use of the Internet to the use of Word or Excel software or a programming language. Data for Belgium refers to Flanders and for the United Kingdom to England and Northern Ireland.
Source: OECD (2017), OECD Science, Technology and Industry Scoreboard 2017: The digital transformation, https://doi.org/10.1787/9789264268821-en.

Source: OECD (2019), Education at a Glance database.
copy the linklink copied!Key policy areas for strengthening employment outcomes
This section focuses on the main policy levers to improve labour market policy and maintain high levels of employment in Norway. The priority policy areas are echoed in quantitative analysis conducted in OECD’s Faces of Joblessness project, that helps identify the most prevalent barriers to employment (see Box 2.3; Fernandez et al., forthcoming). In Norway, these are found to be health limitations (self-reported), low education, and high replacement incomes and non-labour incomes (Figure 2.17). Based on this, the policy discussion focuses on the following areas of policy: i) sick-leave compensation and disability support, ii) retirement-age incentives in old-age pensions, iii) education and training, and iv) immigrant integration. Reform in the first two areas essentially involves reorienting the incentives embedded in policy systems towards greater labour force participation of groups with health limitations and of older workers. Education and training has a crucial role from a forward-looking perspective in ensuring that Norwegian workers will remain well equipped for gainful employment in the changing world of work. Finally, immigration integration policy is key because there are groups of immigrants whose low education and skills do not match with the needs of Norwegian employers, preventing them from finding jobs.

Note: The population experiencing major employment difficulties is defined as those aged 18-64 that report to be long-term unemployed, inactive or to have a weak labour market attachment (an unstable job, restricted working hours or with near-zero earnings), excluding full-time students and those in compulsory military service. 19% of the working-age population experiences major labour market difficulties. The figure indicates the proportion of this population that faces each identified employment barrier. The bars do not sum to 100 as individuals can face multiple employment barriers.
Source: Fernandez, Hijzen, Pacifico and Thewissen (forthcoming). Calculations based on EU-SILC 2017.
This box uses the OECD’s Faces-of-Joblessness methodology to identify groups of individuals who experience major employment difficulties and face similar combinations of barriers (Fernandez et al., forthcoming). Major employment difficulties include long-term unemployment, inactivity or a weak labour market attachment (an unstable job, restricted working hours or near-zero earnings). Employment barriers may relate to either work readiness (low education, low work-related skills or no work experience), work availability (health limitations or care responsibilities) or work incentives (generous income-support benefits, high partner or non-labour income). Barriers on the demand-side are not considered. Statistical segmentation methods are used to identify groups of individuals who face a similar combination of employment barriers. The statistical portraits of the identified groups can then serve as a basis for people-centred policy interventions.
In the case of Norway, about one-fifth of the working-age population experiences major employment difficulties, which is substantial in absolute terms, but considerably lower than the OECD average of 30%. This group can be divided into six sub-groups who face broadly similar employment barriers: three for which health limitations tend to be a major issue and three others with low work-related qualifications (Figure 2.18). Each of these sub-groups requires different combinations of activation and policy support.
-
Groups with health limitations. In three groups, more than two thirds of the members receive sickness and disability benefits. Two of these groups generally consist of prime-age and older women who often also receive old-age benefits, and who are either high-educated part-time workers (Group 3) or inactive (Group 5). The third group mainly consists of prime-age low-educated inactive men (Group 2).
-
Groups with low work-related qualifications. Three other groups generally face low-education barriers, have high shares of migrants, and are generally relatively poor. Two groups mostly consist of young individuals, who are either working part-time and face relatively few barriers (Group 1) or, in a more limited number of cases, have never worked and have low work-related skills (Group 6). A third group comprises mostly prime-age women with childcare responsibilities (Group 4).

Source: Fernandez, Hijzen, Pacifico and Thewissen (forthcoming). Calculations based on EU-SILC 2017.
Reforming sickness and disability systems, next steps
Norway’s sickness and disability systems are a substantial channel for de facto early retirement among older cohorts but also increasing numbers of middle-aged and young people spend prolonged periods on health-related benefits. Norway is among a number of OECD countries facing this issue (Box 2.4). A background paper accompanying this chapter compares the situation in Norway with that in Sweden, the Netherlands and Switzerland (Hemmings and Prinz, 2019).
Starting several decades ago, a number of countries experienced a prolonged and substantial increase in long-term sick leave and in disability benefit recipiency, prompting analysis and policy measures. These trends, according to the OECD’s Breaking the Barriers project, partly reflected a behavioural response to policy reforms (often conducted in the 1990s) that reduced the generosity and accessibility to unemployment benefit, social assistance and early retirement. Labour redundancy through skill-biased technological change and economic shocks, such as the 2008 economic downturn, are also thought to have been a factor.
Outcomes have improved on some fronts in Norway but there is scope for much more. In international comparison (Figure 2.19), the incidence of sick leave and the numbers on disability support programmes remain high (in Norway this comprises a temporary disability support (“AAP”) and long-term Disability Benefit, see below). The numbers on Disability Benefit among pre-retirement cohorts have been falling, but still around one quarter of 55-67 year-olds are claimants (Figure 2.20). Furthermore, claimant levels among young and middle-aged cohorts are increasing, largely driven by a growth in claims based on mental ill health. This is an increasing concern, not only in Norway, that has yet to be tackled more forcefully (OECD, 2015). Sick-leave absence data indicate some decline up to around 2010 but little change since then (Figure 2.21).

Notes: Panel A: Norway data include recipients of the AAP benefit as well as the Disability Benefit;
Panel B: the number of days of sickness absences derived from the EU-labour force survey (LFS) (this includes Norway) are multiplied by a factor of 2 as it is estimated there is in general a 50% underestimation in LFS-reported sickness absences compared to administrative records and health surveys. The assumption is based on data confrontation for some countries (Switzerland, Germany and France) between LFS data and those from health surveys and administrative sources.
Source: OECD Disability Recipiency Database (unpublished), OECD Sickness Leave Database (unpublished).

Note: Latest data point, March 2019. The data do not include those on the temporary AAP benefit.
Source: Norwegian Labour and Welfare Administration (NAV).

1. Person-days lost due to own sickness (self-certified and doctor-certified) as a percentage of contractual person-days.
2. Persons temporarily absent from work for sickness during the whole survey week based on the Labour Force Survey (LFS). Per cent of employment.
Source: Statistics Norway.
Norway’s sick-leave system comprises mandatory compensation for those off work due to illness, funded by employers and the state (Table 2.1). Disability support is fully state funded and has two components: an initial time-limited benefit, the Work Assessment Allowance (AAP, Arbeidsavklaringspenger) and long-term disability support, the Disability Benefit (Uføretrygd). The AAP emphasises rehabilitation, aiming to limit numbers ending up permanently on the Disability Benefit. There is linkage between the sick leave and disability systems. Typically among middle-aged and older cohorts individuals transition from a prolonged period of sick leave into the AAP benefit and then onto Disability Benefit support. Among young cohorts transition directly into the AAP benefit is more common, as many young people receiving the AAP benefit have little to no work experience.
Norway’s still high rates of sickness absence and disability benefits do not reflect the health of the population, but rather a combination of structural factors and policy design. Core issues are generous benefit levels and relatively light eligibility conditions for starting and remaining on benefit, resulting in low rates of rehabilitation. Past reforms have endeavoured to re-orientate sickness and disability systems to better facilitate and encourage return to work. This has been a theme of reform in other countries too, including Sweden, the Netherlands and Switzerland, where outcomes have improved considerably (Box 2.5). Norway has had some success in outcomes. For instance, aside from reduced disability claims among pre-retirement cohorts, there has been some progress in encouraging partial return to work; around 20% of sick leave entails a partial return to work and a similar percentage of those receiving disability are in work. Reform to the AAP-scheme in 2018 seems to have reduced the number of AAP-claimants substantially, in particular due to stricter requirements for extending the duration of the benefit (Table 2.1). However, the much larger overall rates of sick leave and disability point to substantial scope for improved outcomes.
Sick-leave reform
Reform progress has been rather limited in sick leave compensation. To date, changes to sick-leave regulations have largely arisen from a series of agreements between the government, employers and unions (the Inclusive Working Life (IA) Agreements). The Agreements rely mostly on individual employer and sector-level actions to address sick leave. One advantage of this approach is that it potentially addresses the drivers of the substantial sectoral differences in the incidence of sick leave. For instance, there are above average levels of sick leave in some areas of public-sector employment, including health care, and in some areas of the private sector, for instance, construction.
However, so far the Agreements’ impact on the incidence of sick leave has been disappointing. A new four-year IA Agreement was struck in 2018. As for previous agreements, it includes a national quantitative target on reducing sick leave and national-level initiatives that support employer-level and sector-level efforts at preventing sickness absence (e.g. health and safety measures) and encouraging return to work among those absent. The instruments of the new Agreement aim to target the challenges more directly with more focus on work at the individual work place. This is encouraging, however the Agreement is unlikely to be sufficient in itself to bring about major changes in patterns of sick leave. The Agreement’s, reliance on individual employer and sector-level actions to address sick leave, without substantial reform to the sick-leave compensation rules themselves may be the key issue. Indeed, as per previous agreements, the latest contains a clause agreeing to no government-initiated changes to the sick-leave system while the agreement is in operation – a feature that the OECD questioned already in 2005, in its initial assessment of the first IA agreement (OECD, 2006).
Substantial change to the system of sick leave compensation must be a key ingredient to reducing absences in Norway. Incentive issues are important and past OECD assessment has drawn particular attention to the following:
-
Mandatory compensation remains at 100% of the previous wage throughout sick leave absence (which is up to one year). Elsewhere, mandatory sick leave compensation, even initially, is usually less than 100% and sometimes is reduced as sick leave progresses (Figure 2.22, OECD, 2010). Past OECD recommendations have suggested reducing Norway’s mandatory rate of compensation.
-
Employers fully fund the first 16 days of sick leave but there are no further mandatory funding responsibilities. However, all public-sector employers and some in the private sector voluntarily (or as part of firm level or sectoral agreements) make top-up payments to employees earning above the payment ceiling for state-funded compensation. A comparatively short period of obligatory employer funding is a feature of some other systems, for instance Sweden. This approach weakens employers’ incentives to engage in preventative measures or rehabilitation of those on prolonged sick leave. Past OECD recommendations have suggested extending employer funding

Note: The sickness benefit paid by the social protection system is calculated as a percentage of the gross (or in some cases the net) daily or monthly salary and varies between 50% and 100% thereof. Many countries apply an earnings ceiling to insurance coverage. The sickness benefit replacement rate varies most often according to the period of social contributions, the worker’s status (white versus blue/collar), the arrangements in collective agreements, and the type of sickness. The replacement rates do not take into account the supplementary compensation from employers, private insurance companies or mutual insurances.
Source: EC/European Social Policy Network (2016), Sick pay and sickness benefit schemes in the European Union, Background report for the Social Protection Committees, 17 October 2016. Based on MISSOC 2015.
Efforts to improve sickness leave and disability benefit systems are often being conducted on a more or less continuous basis. However, though not always apparent at the time, some phases of reform turn out to be particularly significant. The following have been identified as important for Sweden, the Netherlands and Switzerland (further details in Hemmings and Prinz, 2019):
Sweden, sickness leave reforms, 1990s. Reforms notably included introduction of a 14-day sick-pay period covered by the employer and substantial changes to compensation. Pre-reform the system replaced 100% of previous earnings for 90 days and 95% thereafter, with no time limit. There were two phases of reforms:
-
1993: introduction of a one-day waiting period (i.e. no payment on the first day of sickness absence), compensation was 75% of previous earnings in the next two days, 90% until day 90, 80% after day 90 and 70% after the first year of absence. This reform prompted a sharp drop in absence spells but also a small increase in the duration per spell (Johansson and Palme, 2004; Henrekson and Persson, 2004).
-
Late 1990s: partial reversal; sick-pay rates were increased 90% of the previous wage for the first year and set at 80% thereafter. This led to a significant rise in absence rates, especially longer-term absences (Hesslius and Persson, 2007). Overall, the cost of being absent significantly affected absence behaviour.
Sweden (mid 2000s). Starting around 2006, Sweden undertook another series of reforms to sickness and disability policies. These included the introduction of:
-
A sick-leave process in which a wider scope of jobs has to be considered over time.
-
A 2.5-year ceiling on the duration of sick leave compensation (previously there was no limit on duration). The limit on the duration was revoked again in 2016.
-
More stringent disability-pension entitlement criteria.
-
Introduction of guidelines on the recommended period of absence.
The Netherlands, sickness leave reforms (1990s). Major reform started in the early 1990s that led to the full privatisation of the previously publicly administrated and collectively financed sickness benefit scheme. This reform was largely responsible for drop in absence rates from 8.1% in 1992 to 4.6% in 1997. Notable components of the reform included:
-
A shift from uniform employer premiums to premiums reflecting firms’ absence rates.
-
Longer employer responsibility for payment of benefits, by 1996 employers were entirely responsible for sick pay (then 52-weeks maximum). An insurance market developed, where most small companies choose to insure their sick-pay liabilities.
The Netherlands, sickness leave reforms in 2002 and 2004. These reforms brought much more detailed regulation of the employers’ sickness management and reintegration responsibilities and extended the sick-pay period from one year to two years. Notably, insufficient reintegration efforts by the employer can make them responsible for up to a year’s additional sick leave compensation, thus prolonging the sick-pay period by another year.
The Netherlands, disability benefit reforms (early 2000s). Major reform to the disability system was agreed by the government and the social partners in 2003-04, and took effect in 2006. The reform notably: focused on recent entrants to disability, brought in entitlement reassessment for those aged under 45 years, and strengthened employer and employee incentives.
Switzerland, medical assessment reform (early 2000s). In 2004, as part of a revision of invalidity insurance law Switzerland established the Regional Medical Service (RAD, Regionaläzlichen Dienste). The RAD supports the disability insurance authority in assessing work capacity and thus benefit entitlement – a task previously carried out predominantly by the claimants’ general practitioners. A preliminary evaluation found the RAD system improved medical decisions, with more cooperation between physicians and a better alignment with the requirements of the disability insurance. However the reform did not reduce the time needed to take decisions.
Switzerland, disability benefit reform (2003-2016). Over this period, the government substantially altered disability insurance system through a series of reforms. Overall, the reforms:
-
Clarified and tightened the eligibility criteria for disability pensions.
-
Introduced a more fine-grained classification of disability.
-
Reduced implicit tax on earnings from employment while in receipt of a disability pension.
-
Improved the detection of people at risk of becoming disabled, including a new form of low-threshold application to disability insurance.
-
Set up early intervention measures to secure job retention or to support job search, including vocational training and active job placement.
-
Introduced substantial wage subsidies for employers hiring disability benefit claimants.
Source: Hemmings and Prinz (2019).
Sick-leave reform proposed by the initial report of the Employment Commission (Box 2.6) recommends:
-
A shift to a full-time equivalent approach to sick-leave compensation and duration. Any configuration of sick leave (full-time, part-time, and any mix of the two) would be possible within a total allowance of 12 months full-time equivalent with a maximum duration of 18 months.
-
Extended employer participation in funding sick-leave compensation. The period of full funding by employers would be reduced from 16 to 7 days. Thereafter the employer would pay a 10% co-payment on the first half of full-time compensation, and 25% for the second half. Thus, for instance, the co-payment for an employee on half-time sick leave would be equal to 5% of the previous salary and 17.5% in case of full-time sick leave (5% plus 12.5%).
-
A step-down in compensation paid to workers on sick leave to 80% of the previous wage after six months full-time equivalent (pro-rata adjustment for part-time absence), i.e. after a period of six months in the case of full-time sick leave, or for instance 12 months in the case of 50 % sick leave.
Implications of the step-down in compensation and the full-time equivalent approach are illustrated in Figure 2.23. Panel A shows the proposed compensation step-down for full-time absence, as in the current system those with long-term health problems transition to the AAP benefit after 12 months. Panel B illustrates how, under the full-time equivalent approach, someone could return to work half time after a 6-months absence and then remain on sick leave a further 12 months (thus using the full 12-month full-time allocation and terminating at the proposed 18-month limit). Income drops to 90% of previous earnings at 6 months (extended sick leave compensation, plus earnings), then to 83% at 18 months (disability support, plus earnings). The claimant receives the same total value of sick-leave compensation as for full-time absence—which would not be the case in the current system.

Note: This simulation shows the case for a worker with a wage below the benefit ceiling. AAP: Norway's Work Assessment Allowance (AAP, Arbeidsavklaringspenger).
Source: OECD’s calculation.
In 2018, the government commissioned an investigation of employment levels and related policies. This was primarily motivated by the trend declines in employment rates and labour-force participation seen among certain groups (see main text). The initial expert group, which unusually for Norway excluded union and employer representatives, produced a report in March 2019 (Arbeid og inntektssikring, ‘work and income support’). A second round of analysis, including representation from the social partners, is underway. A second report will be submitted in mid 2020.
The Commission report’s emphasis is on increasing the work orientation of policy, recognising that higher employment rates bring both social and economic benefits. The report’s overall capacities-motivation-opportunities framework is also advocated by OECD, including in the latest Jobs Strategy.
The policy recommendations of the Commission’s initial report focus heavily on sick-leave compensation and disability benefits. These are discussed quite extensively elsewhere in this chapter. The initial report also advocates lighter taxation on low income levels, increased use of wage subsidies, increased education options, greater entrepreneurial support for the unemployed and better training for immigrant refugees. Meanwhile it also suggests stronger activity requirements for some benefits and longer job probationary periods. In addition, it is recommended that the benefit-services provider, NAV, be given more resources for claimant follow-up and for research into policy effectiveness.
The initial report also proposes measures to encourage employers to retain or hire those aged 70 plus. In 2015 the age limit of certain elements of dismissal protection (part of the Work Environment Act) was raised from 70 to 72 years. In response, many firms introduced mandatory company age limits at age 70, suggesting significant concern among employers that the extension of dismissal protection may mean retaining workers with deteriorating performance. The Commission proposes banning company age limits and reverting to an age limit of 70 for the Work Environment Act, which in combination should boost employment among those over 70 as well as older workers below the age limit.
The Commission’s proposal for employer funding implies lower compensation costs for short absence (which accounts for the vast majority of sick-leave spells) but higher costs for long absence, thus in principle incentivising employers to address prevention and rehabilitation in cases of long-term sickness absence. The lower cost of shorter absence is illustrated in Figure 2.24, Panel A, which suggests that for full-time absence, sick-leave compensation costs for employers will be less than the current system until around the seventh week of absence. Figure 2.24 Panel A also illustrates how the proposal makes partial return to work attractive for employers. In the case of an absent employee normally earning the national average wage, a 20% return to work (e.g. 1 day in a 5-day working week) reduces the employer’s cost of sick leave by about NOK 5 000 over a three-month absence.
The higher employer costs of long-term absence are illustrated in Panels B and C of Figure 2.24. For an employee on the national average wage the accumulated cost would be around NOK 90 000 or NOK 140 000 for 12 months absence, depending on whether the employer continues to tops up the 80% mandatory compensation after six months. For high-earners (Panel C), when earnings are well in excess of the ceiling on mandatory compensation, the implications of the proposed system are less significant if top-ups remain in place.
Reducing the generosity of sick-leave compensation and extending employer funding are very welcome directions for policy, and should be retained as key elements of the reform. Ensuring impact from the reform would be helped by.
-
Early step-down in compensation. Step-down in compensation after 6 months, as described in the central recommendation of the Commission, is comparatively late; step down much earlier or even from the initial day of absence would be more effective. This is echoed in the details of the Commission’s report. Data from a number of OECD countries show that a return to work is very unlikely after a period of sickness absence of 5-6 months (OECD, 2015).
-
Limitations on top-up payments (also suggested in the Commission’s report). For reduced compensation (at any stage) to influence patterns of sick leave, a limit on top-up payments should be considered. Given many employers already top-up compensation for employees earning above the ceiling for mandatory compensation, it seems likely that topping-up the 80% compensation would also become common, unless banned or dissuaded by a penalty (as is the case, for instance, in the Netherlands and Sweden).
Ensuring positive impact from strengthening employer and employee financial incentives may require auxiliary measures:
-
Further measures to intensify management efforts, particularly in certain sectors. Greater, opportunities and incentives for employers to facilitate and motivate preventative actions and return to work may be required. At present, employers have some avenues for engagement, for instance in the formulation of obligatory return-to-work plans (see Table 2.1). However, more steps may be needed. The proposed full-time equivalent system may prove useful, allowing employers to offer more attractive return-to-work options than at present. A sectoral approach to intensifying management attention to sick leave could also be taken, particularly in public-sector employment where government can more directly influence management.
-
Further checks against adverse selection. Current sick-leave regulation includes a possibility for employers to apply for state funding for employees with increased probability for being sick (long-term or chronical diseases and sickness related to pregnancy). However, further measures may be required if the reforms prompt a reluctance to employ those at risk of ill health. The Netherlands, for instance, introduced a ban on health testing of job applicants and an exemption of employer co-payments for workers hired while on sick leave or on disability benefit (for further details see de Wind and Pronk, 2018).
-
Additional mechanisms against the risk of heavy sick-leave compensation bills for individual employers. The Commission’s proposal claims to be calibrated such that, in aggregate, the burden of mandated sick-leave compensation cost remains roughly the same between employers and the government (i.e. it aims to be fiscally neutral, based on assumptions about the impact of reform). However, the cost impact among individual employers will vary widely depending on the profile of sick-leave absence among their employees. Sick-leave regulation currently allows small companies to ensure against sick pay during the first 16 calender days (specifically, the company’s total salary bill must not exceed 40 times the ‘basic amount’ of the welfare system, which implies a wage bill of below around NOK 4 million, i.e. around EUR 400 thousand). However, more steps may be required. Several OECD countries, including Austria and Germany for example, have mechanisms that compensate excessive sick-pay costs for small businesses. In Austria, a subsidy that partially covers the cost of sick-leave pay is available for employers with fewer than 50 employees. In Germany, employers with fewer than 30 employees pay a compulsory contribution to a fund that reimburses between 40% and 80% of sick-leave wage costs.

Note: Microsimulations based on the parameters of the proposal and current systems. Each line shows the cumulative employer sick leave compensation cost over the duration of absence. Top-up results from employers voluntarily paying additional sick-leave compensation to bring it to 100% of previous (reference) wage. Top-ups arise when the employee earns more than the ceiling for mandatory sick-leave compensation or when, as proposed by the Employment Commission, compensation is less than 100% of previous earnings after six months of full-time sick leave (or equivalent).
Source: OECD calculations.
Disability benefit reform
Past policy actions have endeavoured to re-orientate disability support so that it better facilitates and encourages a return to work. This has been a theme of reform in other countries too, including Sweden, the Netherlands and Switzerland. Past reforms in Norway have included the consolidation in 2010 of time-limited schemes into the AAP benefit and the separation of the Disability Benefit from the old-age pension system, which has notably resulted in the Benefit being taxed in the same way as wage income (Table 2.1). Recent reform to the AAP benefit has included a shortening of the standard length of the AAP benefit and tighter conditions on extensions.
As described above, the falls in disability claimant rates among pre-retirement cohorts suggest a degree of success from reforms. However, there is considerable scope for further reduction in this age group and worrying growth in the share of young and middle-aged Norwegians claiming a disability benefit. Among these groups, entering the system ‘directly’, i.e. without first passing through the sick leave system, is more common than in other age groups. This underscores that the AAP has an important role in rehabilitation.
Critical weaknesses in the disability benefit system lie in the rules and processes determining benefit eligibility. A need for stricter application of rules as well as stronger criteria and processing has been identified; specifically, limiting access to Disability Benefit through wider exclusion criteria and stronger treatment and rehabilitation requirements (OECD, 2013). Some of the Employment Commission’s recommendations on disability support suggest tougher criteria along these lines, which is welcome. In particular, it suggests reducing AAP payments for younger cohorts and for individuals living at home. The government has proposed lower minimum benefits for AAP-recipients under 25 years in the budget for 2020, and more funding for follow-up of these recipients more closely. Stricter eligibility is also recommended by the Employment Commission for those entering AAP directly. Such measures could have impact, depending on specific policy design.
Early intervention should also be a theme of adjustment and reform to disability benefit (and indeed sick-leave too) looking forward. International evidence underscores that the chances of return-to-work and the effectiveness of rehabilitation measures decline steeply the longer individuals remain off work (OECD, 2010; 2015). Early intervention also should, for instance, be a feature of mechanisms such as targeted (and time limited) wage subsidies to encourage employers to hire those receiving health-related benefits. Norway makes comparatively less use of such subsidies, especially compared with its Nordic neighbours. The Commission’s report also proposes “health adjusted wages” (Box 2.7), which aim to encourage employers to offer work to those on Disability Benefit. The scheme has some merit, but making it available only to those on the Disability Benefit means the scheme will apply typically to those who have been out of work for a prolonged period. Unfortunately, in this instance applying the scheme earlier risks compromising the AAP system, which strongly focuses on getting individuals back to regular work
One proposal by the Employment Commission is for “health-adjusted pay” in which employers would be permitted to pay reduced wages when employing those receiving Disability Benefit on the basis that ill health is compromising the worker’s productivity. This approach has parallels in other OECD countries. In Australia, under the “supported wage system” employers can pay a productivity wage (with a complex assessment to determine the workers’ level of productivity). A government inquiry (Australian Human Rights Commission, 2012) provided a broadly positive assessment of the scheme but saw room for improvement, including in program administration and in monitoring the impact of support removal. In Denmark’s flex-job scheme workers can move from a regular job to a partially subsidised job, to compensate for reduced productivity. In Norway, a health-adjusted wage scheme would strengthen employer interest in taking on those on Disability Benefit. It also avoids (direct) new fiscal commitment by government (as would be the case with a more typical wage subsidy to employers). Given the scheme’s experimental nature, it is proposed that it initially applies only to certain groups, including younger cohorts.
Prima facie, making the scheme available at an earlier stage, for instance as part of the AAP benefit, would make it more effective. However, this would risk compromising the central goal of the AAP benefit, which is to promote a return to ordinary work on ordinary conditions.
As regards other aspects of the scheme, the Employment Commission’s report only partially fleshes out the details and acknowledges that a number of questions arise. How the scheme treats and motivates claimants will be critical. For instance, if participation in the scheme is to be voluntary, the reduced wage has to be sufficiently attractive for the claimant. The process for determining the wage adjustment (by social-security administration, or otherwise) will also be important.
Major medical-assessment reform for sick leave and disability claims could reduce take-up of benefits
Reform to the medical assessment procedure in both sick leave and disability support has long featured in OECD recommendations for reform in Norway. Throughout the sick-leave and disability benefit application process, medical assessment is still predominately carried out by the claimant’s own general practitioner, making the system vulnerable to assessments biased in favour of the claimants interests. There have been several initiatives aimed at strengthening co-operation and co-ordination between health rehabilitation and active labour market policies. Some of these are promising, such as the “Centres for Work Coping” (Box 2.8). However, the schemes are yet to involve large numbers of those on health-related benefits. For greater impact, such schemes (if proven successful) need to be rolled out.
Deeper reform to medical assessment procedure may be needed, including medical assessment by practitioners other than the person’s own doctor. A trial requiring the claimant to obtain a second opinion to a general practitioner did not have significant impact. This could be due to the specific design of the trial. Effective reform of medical assessment may require changes that, for instance see input of medical practitioners selected (or contracted) by the employer or the public employment service. Switzerland offers an interesting example in this regard as it introduced regional medical services that can overrule the decision of a claimant’s general practitioner. This reform, introduced in 2004, has helped the country considerably in bringing the number of new disability benefit claims down (OECD, 2006; OECD, 2014).
Systemised co-ordination between employment and health services can help improve rehabilitation. Several initiatives focus on this issue. One measure provided by the public employment service is "Individual placement and support", which focusses on helping people with mental disorders and drug problems return to work. “Health in Work” seeks to ensure health promotion and preventive information at the workplace. A third example are the “Centres for Work Coping” (Senter for Jobbmestring) operated by the public employment services.
The Centres offer cognitive behavioural therapy and specialist employment services to people with mild-to-moderate mental disorders who are either still in work, on sick leave, or inactive (OECD, 2015). The services are currently established in seven of Norway’s 19 counties. A randomised controlled trial found positive impact in terms of work participation, depression and anxiety, and health-related quality of life after 12 and 18 months (Reme et al., 2015). A follow-up study found positive impact in terms of income, work participation and reliance on welfare benefit 10 to 46 months after the intervention (Øverland et al, 2018).
Specific measures to address work absence due to mental ill health are required
In Norway, as in a number of other countries, mental illness has increasingly been a cause of employee absence, and a reason why some individuals remain out of work for prolonged periods. Resolving the problems in the sick leave and disability systems along the lines described above will help address mental health concerns, in particular by prompting greater employer interest in preventative steps to avoid absence. However, people facing mental health challenges are not only found among those on sickness or disability benefit but also among those still working and those on other benefits, such as unemployment benefit and social assistance. Therefore, as underscored in the OECD’s Mental Health and Work project (OECD, 2015) broader steps are required with a focus on early identification and service integration. A more in-depth assessment for Norway (OECD, 2013) recommends also strengthening early intervention through the provision of additional services directed at mental illness by the Employment Support Services of NAV.
Getting incentives right in retirement-age choices
Government reforms have widened retirement-age choice and reduced biases
Norway’s pension system (see Box 2.9 and Table 2.2) for most individuals allows retirement as early as 62 years while also permitting considerably later retirement. A central thrust of major reforms, one implemented in 2011 and one agreed on in 2018, has been to bring a more actuarially neutral trade-off between the age of retirement and pension income, and to reduce previously strong biases towards retiring early. In particular:
-
For the state-funded earnings-linked pension, reform in 2011 brought:
-
A retirement-age range of 62 to 75 years for the state-funded earnings-linked pension accompanied by actuarially-adjusted pension payouts.
-
Systematic updating over time of the life-expectancy assumptions used calculating an individuals pension pay-out to reflect further increase in longevity. Thus, over time individuals will be nudged towards later retirement as the pay out at a given retirement age will be diminished. Thus, ceteris paribus, only by retiring later individuals will be able to reach the same level of pay out as preceding generations of retirees.
-
-
For the second pillar of the pension system (see Table 2.2), reforms to the occupational pensions and the supplementary ‘AFP’ early retirement pensions will also strengthen actuarial neutrality and reduce biases towards early retirement.
The increased emphasis on providing a wide range of possibility on retirement age with corresponding actuarially based pay out adjustment is broadly welcome and should be preserved as a central feature of the pension system. However, the approach is not without challenges.
Norway’s pension system includes a substantial first pillar comprising a state-funded pension that provides earnings-linked pensions and a safety net pension. This is supplemented by second-pillar occupational pensions (historically, predominantly defined-benefit pensions, today almost all defined-contribution in the private sector). The occupational pensions in the private sector have widely varying importance in individuals’ retirement incomes. Many workplaces adopt the 2%-of-salary mandatory minimum contribution rate, while in other workplaces the contributions are considerably higher. In the public sector, an agreement has been reached to replace the defined benefit occupational pensions which aimed at specific compensation level, with a system that gives a net supplement to the state-funded old-age pension that increases with age of retirement (more actuarially neutral). Second-pillar pensions are supplemented by a separate collectively bargained system (‘AFP’) for workers covered by collectively bargained schemes. The AFP system has recently been joined by a new scheme for early retirement set up by unions and employers (sliterordningen). Third pillar pensions - individual voluntary pension products - play a comparatively small role.
There has been a shift away from focus on a specific retirement age in the pension system. A flexible retirement age ranging from 62 to 75 has been implemented throughout the pension system. However, some components of the system are still centred on age 67. For instance, this is the age when the safety net pension commences
Addressing tensions from retirement-age choice and pay out adjustment
One risk of providing a wide range of options on retirement age, with corresponding pay out adjustment, is that tensions over fairness may arise. The pension system is fair in that each retirement age is financially equivalent in terms of the expected value of the total pension received over the remaining lifetime. However, fairness issues in a different dimension arise from the actuarial adjustment. Given the correlation between earnings and life expectancy, high earners are disproportionately rewarded for delaying retirement because the pay-out calculation is based on a lower life expectancy than theirs (i.e. actuarial adjustment may be regressive). In addition, high earners are more likely to be in occupations where it is feasible to continue working into later life, further driving regressivity.
Concern about regressivity has been exemplified in a small-scale early retirement scheme agreed in 2018 between unions and employers The sliterordningen scheme will provide annual top-up retirement payments (to age 80) for those retiring between the age 62 and 64 years, thus (re)introducing actuarial bias towards early retirement (Box 2.10). Regressivity concerns could however be tackled differently. For instance, the accumulation of pension entitlements to the state-funded earnings-linked pension could be made more progressive through the contribution rate. Tensions over fairness can also be amplified if choices on retirement age are not well informed. Information and education campaigns can help along with higher default or recommended retirement ages to help guide decision making.
When fully phased in (which will be around 2025) sliterordningen will provide 25% of the standard national-insurance amount (“G”) to 62 year olds, two-thirds of this to 63 year olds (i.e. 16.7% G) and one third of this (i.e. 8.3% G) to 64 year-olds. Based on the 2019 annual value of G (NOK 99 858), these translate to pay outs worth around 25 000, 17 000 and 8 500 NOK per year (or around EUR 2 500, 1 700 and 850), respectively.
Sliterordningen will incentivise retirement in the range of 62 to 64 years, and affect the marginal incentives within that range. When the state-pension reform is fully phased in (which happens for those born in 1963 onwards) the annual pension gain for those retiring at 63 years instead of 62 years is around 13% of G, the sliterordningen pay out reduces this gap by 8.3% G, therefore roughly halving the financial incentive to postpone retirement.
Linking age dimensions to longevity should be explored
Reforms have factored increasing longevity into actuarial calculation but not age-dimensions of the system. Thus, the age range for the main state pension is set to remain at 62 to 75 years and access to the safety net pension will remain at 67 years. A common approach is to update such parameters periodically on a discretionary basis. However, an increasing number of countries (including Denmark, Finland and Sweden) have hard-wired linkage between the retirement-age parameters in their pension systems and life expectancy through regular technical updates. Linking age-parameters to life expectancy does not have to be on a one-for-one basis. Potential advantages of this approach include:
-
Greater certainty and smoother adjustment for households’ decision-making and planning around pensions compared with discretionary updating of age parameters.
-
Less risk of poverty in retirement (and perhaps also reduced tensions over fairness), because a coordinated actuarial adjustment of both the pay-out calculation and the lowest permissible retirement age can prevent declines (relative to wages) in pension pay outs for early retirees. Gradual increase in age parameters also helps prevent a build-up of constraint on choice at the upper bound of the retirement-age range.
Adjustment in pension provisions for those on disability benefits is required
Co-ordination between the state pension system and other benefits (see earlier sections) implies a trade-off between work incentives and fair pensions to unhealthy individuals. Norway faces a particularly difficult issue regarding retirement for those on disability benefits (either the AAP or the Disability Benefit). Under the reformed pension system, those on benefits transition to an old-age pension at age 67. Retiring early via Disability Benefit (typically preceded by sick leave and AAP benefit) is for many of those considering retirement far more attractive financially than retiring via the options offered by the old-age pension system.
Opportunity has arisen to tackle this issue. Under the system of life-expectancy adjustment in the new pension system, the pension pay out to ex disability benefit recipients will decline over time. This is because, unlike other retirees, such individuals cannot postpone retirement to offset the impact of adjustment. A scheme that compensates for about half of the effect of life-expectancy adjustment has been in operation. At present there is no provision for those born in 1954 or later. Given the case for eroding the overall attractiveness of early retirement via disability benefits, re-introduction of this compensation could be postponed for a while, thus bringing a phase of more rapid erosion of the pension payout to ex disability benefit recipients. Once the pension has adjusted to a more appropriate level, the compensation scheme can be reactivated.
Special occupational retirement-age rules ("særaldersgrenser") remain unreformed
Similar to many countries, certain occupational groups have special provisions for retirement. In Norway these job-specific retirement-age rules (særaldersgrenser) are embedded in the public sector occupational pension system, with the largest groups being police, national defence and nurses. Around 20% of state employees fall under these special rules, 30% in municipalities. As also highlighted by the Employment Commission, these special provisions have seen little or no change for a long time. For instance, the retirement age legislation for the police dates back to 1938 and for the armed forces back in the 19th century. Notably the pensions still include:
-
Mandatory retirement ages (mainly between 60 and 65 years), which have not been revised since the 1990s.
-
Provisions allowing retirement three years prior to the mandatory retirement age if the sum of working years and the persons age exceeds 85 years, without adjustment of the annual pension.
Such blanket early retirement rules for certain professions are inappropriate. Reflecting the changing nature of work in these professions, for many jobs and tasks there is today no reason for rules that force early retirement. Also, there are more channels for individuals to transition away from functions where physical capacity is important, while remaining within the profession.
Mainstream pension reform has highlighted the disadvantages of the special retirement rules. Similar to the ex-Disability Benefit pensioners, a fixed retirement age does not fit well with life-expectancy adjustment as individuals cannot respond through later retirement (life-expectancy adjustment will apply from age 67 for those under job-specific retirement-age rules).
Education and Skills for High Employment
Ensuring solid skills across the entire population is becoming increasingly important in Norway as advances in technology, enhanced global competition, and the changing structure of work are shifting skill demands. Broadly, higher levels of skills will be required but there are specific dimensions. For instance, transversal skills, such as the ability to communicate, work in teams, lead, solve problems, self-organise, and digital skills are becoming more important in the labour market (OECD, 2017c and 2016b). Education and training need tuning to employers’ needs, to provide relevant skills in a timely fashion and ensure continued high levels of employment. Relevant and high level skills, in turn, foster productivity growth and innovation in the economy.
There is room for improving skills in Norway
Norway’s performance in international tests of learning and skills shows a mixed picture. There has been some progress in PISA scores in recent years across the three areas tested (reading, mathematics and science), but Norway largely remains around the OECD average (Figure 2.25). In the PIAAC tests of adult skills, Norway’s scores for all adults are above average in reading and numeracy, albeit lagging behind high performers such as Finland. Norway’s youth (16-24), on the other hand, score below the OECD average in PIAAC. These mixed outcomes are particularly concerning given that spending on education, which is predominantly public in Norway, is one of the highest in the (Figure 2.26).

Source: OECD, PISA 2000-2018 Databases; and OECD (2018), Higher Education in Norway: Labour Market Relevance and Outcomes, Higher Education, OECD Publishing, Paris, https://doi.org/10.1787/9789264301757-en.
Early school leaving, especially among VET (Vocational Education and Training) students, is another challenge for Norway. Almost all youth that have completed compulsory education enrol in upper-secondary school, but completion rates are low. Close to 20% of 25-34 year-olds have not attained an upper-secondary qualification, which is above the OECD average and nearly twice as high as in best performing countries (Figure 2.27).

Source: OECD Education Statistics: PISA: Programme for International Student Assessment; and OECD (2019), Education spending (indicator). https://doi.org/10.1787/ca274bac-en (Accessed on 10 July 2019).

Source: OECD (2018), Education at a Glance 2018: OECD Indicators, OECD Publishing, Paris, https://doi.org/10.1787/eag-2018-en.
Nevertheless, Norwegian education and learning have many qualities and successes. Generous public funding brings universal access and equity throughout much of the education system. Norway has close to universal enrolment of 3-year olds into early childhood education and care (ECEC) (Figure 2.28). This plays a beneficial role in children’s wellbeing and cognitive and social-emotional development and can form a good foundation for lifelong learning (OECD, 2017d, 2017e and 2018e). According to PISA results, schools across Norway tend to be of consistent quality (OECD, 2016c), which helps promote equality of opportunity and income mobility. The likelihood of disadvantaged students performing poorly compared to other students is lower than in other countries (Figure 2.29).

Source: OECD (2019), "Education Database: Enrolment by age", OECD Education Statistics (database), https://doi.org/10.1787/71c07338-en (accessed on 9 October 2019).

Note: A socio-economically disadvantaged student is a student in the bottom quarter of the distribution of the PISA index of economic, social and cultural status (ESCS) within his or her each country/economy.
Source: PISA 2015 Results (Volume I): Excellence and Equity in Education.
Norway has a flexible education system, where students can switch relatively easily between general and VET paths in upper secondary and tertiary education. Likewise, a lifelong learning culture and flexibility offer plenty of opportunities for learning, including returning to education later in life. This flexibility and a relatively strong labour market contribute to low rates of NEET youth (Not in Education, Employed or Training), which is among the lowest in the OECD (Figure 2.30), despite high non-completion rates of upper secondary education discussed above. Furthermore, participation of adults in education and training is high (Figure 2.31), including from those with low education and skills (OECD, 2016c and 2019b). The share of adults with low skills is small (Figure 2.32).

Source: OECD (2018), Education at a Glance Database, http://stats.oecd.org.

Source: Education at a glance, Table C6.1a. See Source section for more information and Annex 3 for notes. (www.oecd.org/education/education-at-a-glance-19991487.htm).

Source: Building Skills for All in Australia. Policy Insights from the Survey of Adult Skills (PIAAC 2012 and 2015).
Reform efforts in schools are ongoing
As indicated by the average PISA test results, there is room for improvement in basic skills. Solid basic skills can equip workers with adaptability later in life, where they will likely be faced with a change of employer, a job or occupation. Sound basic skills can also help individuals acquire new skills later in life.
The authorities are aware of the challenges that education and training faces, and together with stakeholders efforts are continuously made to modernise the system at all levels and make it more relevant for the workplace. Primary and secondary education reforms currently include a major curriculum overhaul starting in 2020 (the previous major review was in 2006). The overhaul focuses on reducing the curriculum overload, encouraging more in-depth learning and greater clarity on expected pupil progression. It also aims for more systematic curriculum renewal in the future, with a higher degree of stakeholder involvement, which could boost the labour-market relevance of skills learned. A reform is also underway to improve teaching and school management. A programme has been rolled out that increases support for teachers’ continued education and introduces requirement for a 5-year master’s-level degree for new entrants to the profession.
Boys’ lower performance in schools is a concern
As for many other advanced economies, girls are increasingly outperforming boys in academic performance at school. In Norway’s schools, the evidence suggests girls are outperforming boys, on average, across all subjects except physical education (Figure 2.33), with the gender gap especially large in language skills. More boys than girls are receiving additional educational support – approximately 70% of pupils receiving special needs education in primary and lower secondary education are boys (National Commission on Gender Equality in Education, 2019). Attitudes between boys and girls also differ, with fewer boys reporting that trying hard at school is important. In addition, fewer boys have ambitious academic and career expectations according to an OECD working paper (Borgonovi et al., 2018).
As grades from primary and lower secondary school are used to select students into upper secondary education, boys are more likely to have lower acceptance rates to schools for which there is high demand. Boys also have a lower chance of studying the subject of their choice. This contributes to boys having lower educational attainment – boys are significantly less likely to attain upper secondary or tertiary education (Figure 2.34). This can have far-reaching consequences, in particular as the labour markets will increasingly reward the highly qualified and highly educated workers

Note: Marks are awarded on a scale from 1 to 6, where mark 6 indicates that the pupil holds exceptionally high competence, and 1 indicates that the pupil has attained little competence in the subject.
Source: Statistics Norway.
In recognition of the problem, the government established a commission on gender equality in education in 2017 that submitted a report in early 2019. Several factors are thought to explain the gender gap - different resilience to disadvantaged circumstances, teacher-pupil interaction and teacher gender, different cognitive profiles, different cognitive development over time and different self-regulation. However, the evidence has yet to point conclusively as to which of these are the most significant.
The OECD – Borgonovi et al. (2018) – focuses on research and policy experience from selected OECD countries, and presents policy options across three policy levels - the classroom, the school and the education system. In the classroom, teachers can help improve the learning outcomes by motivating and supporting all students and adapting teaching to the needs of both boys and girls. Providing teachers with tools and guidance on how to adapt their teaching strategies to the needs of low achieving boys has proven to be effective in improving boys’ earning outcomes.
School level practices and policies can intensify efforts to identify and help students at risk of dropping out - often boys - as a key component of national strategy to improve completion rates in upper secondary education (more on this below). Many who drop out have low learning achievement and are disengaged from school. Norway runs quite comprehensive early intervention programmes in schools that target pupils who lag behind in reading, writing or mathematics. The pupils are offered intensive and adapted training/teaching/education for a limited period. However, it would appear that problems remain, despite these efforts.

Note: Panel A: Countries are ranked in descending order of female completion rate (for true cohort, by the theoretical duration). Data cover upper secondary general programme only for Latvia; and for England, successful completion and achievement of two-year GCSE programmes.
Source: OECD (2017), Education at a Glance 2017, http:/www.oecd.org/education/education-at-a-glance-19991487.htm; and OECD Education at a Glance database.
Finally, national government could work on the transition from early childhood education to primary school so that it better suits the different development of boys and girls. Furthermore, government should also incentivise evidence building on the gender gap and its causes, dissemination of findings and information, and promote policies to reduce the gap. Also, importantly, policy levers are not only within schooling itself – better outcomes could also be achieved by engaging parents, for example by encouraging them to read more with their children, in particular with boys.
Tackling high drop-out in vocational education
Technological change and rising global competition reinforce the importance of skill-based education. Vocational education is the key channel for providing skills for those that do not enter into degree-level education and is key for providing employers with ready-to-go skills for many types of work. Assessment of Norway’s vocational education was part of an OECD Investing In Youth study (OECD, 2018f).
Vocational training in Norway is provided mostly by upper-secondary schools. The schools are the responsibility of county-level government and are inclusive in that students have the right to attend for three years, irrespective of previous schooling performance (the students are generally aged 16 to 19). Practically all students completing compulsory education enrol in upper-secondary courses and it is a national policy that all students attain an upper-secondary diploma. Within each school, there are two tracks, an academic (“general”) stream that principally channels students into degree-level tertiary education and a vocational stream. Apprenticeship courses are a central pillar of this latter stream, and most courses are structured on a 2+2 basis; i.e. two years of full-time study is followed by two years of training and work experience with an employer. Students can easily switch between the general and vocational streams.
Yet, non-completion of vocational-education courses has long been a policy concern. As seen above, a high number of Norwegians do not complete upper secondary education. While this can be partly explained by Norway’s tight labour market and ample job opportunities, there is a risk that early leavers are putting themselves onto a trajectory of low-paid, unstable and unfulfilling jobs for the longer term. This is particularly worrying, as leaving school early is concentrated among those with poor grades from previous schooling, whose parents have weak educational attainment and young migrants. For example, non-completion is particularly high in restaurant and food processing programmes, where students typically have poor grades from lower-secondary school and many have special needs (Norwegian Directorate for Education and Training, 2017; Cedefop, 2017). Some of the early school leavers also end up being NEET, out of employment and education, with even worse prospects for the future (OECD, 2018f).
Shortages in the two-year apprentice placements with employers are a key problem, contributing to dropout. In January 2018, out of 28 900 applicants for apprenticeship only 20 800 (72%) found a placement (Haukås and Skjervheim, 2018). County authorities are required to offer one year of practical school-based training, equivalent to apprenticeship training, to those who do not find a placement. However, these courses are unpopular because of their short duration and lack of work-based training (Mogstad Aspoy and Nyen, 2015). Many failing to get an apprenticeship placement drop out of education. In contrast, most of those who receive apprenticeship placements complete their VET training - nine out of ten passed their final exam in 2015‒16 (Norwegian Directorate for Education and Training, 2017).
The current Social Contract for VET (covering the period 2016-20), aims to make VET more attractive and to reduce dropout rates. One goal is to ensure a placement for all apprenticeship applicants. The initiative builds on the previous Social contract for VET (2011-15) that had some success. The scheme comprises a range of measures including raising the cash bonus for businesses taking on apprentices. In addition, there are requirements for public procurement contractors to run apprenticeship programmes (EACEA, 2019; Cedefop, 2018). A website helps young people find employers that offer apprenticeship places.
As discussed in the OECD Investing In Youth study (OECD, 2018f), relatively high apprenticeship wages are one factor dissuading employers from offering placements. The wages are set as part of collective agreements. According to calculations in OECD (2018f), first-year apprentices cost around 12% of an experienced worker salary (after taking account of government subsidy) but this rises to 57% in the second year due to the increase in the regulated wage. Apprentice wages in Germany and Switzerland start at roughly the same relative cost (15%) but only increase to 18-27% of the skilled worker wage. This would suggest flattening the apprentice wage as a policy measure. However as the wage is set through collective bargaining, government has limited influence. To ensure higher completion rates, Norway could also pay part of the bonus to employers who train apprentices - subsidies to training firms are already quite generous - conditional upon a successful graduation of their apprentices, as is done in Australia (Kuczera, 2017).
The shortage of apprenticeships may however reflect the lack of suitable candidates. In Norway VET provision is largely driven by student choice. All students that complete compulsory education are entitled to a place in one of their three preferred VET programmes. The late start of apprenticeship training - in year three - means that students choose their vocational pathway before beginning to look for an apprenticeship. The extent to which businesses can steer youth towards occupations that they require through offering to train them is therefore limited, weakening the link between skills needs in the labour market and training followed in school. In Austria for example, apprentices choose a specific occupation from day one, and must find a placement with an employer before starting their course. VET programmes in Norway should therefore offer earlier and deeper specialisation for students in specific occupations. In certain trades, a more specialised VET and greater flexibility on how apprenticeships are scheduled (i.e. alternative arrangements to the currently predominant 2+2 approach) could better suit both students and employers.
Making higher education more relevant for the labour market
University graduates in Norway enjoy high employment rates and few are unemployed, but labour market outcomes vary by field of study (Figure 2.35). Given technological change, demographic shifts and resulting changes in skills needs, the labour-market relevance of the content and length of degree courses are frequently the subject of debate. A government white paper on these issues is in the pipeline (with release of the final report due in 2020). Norway’s higher education has been discussed in previous OECD Surveys (OECD, 2018g and 2016d). Higher education in Norway (OECD, 2018h) looks at the sector from the perspective of labour-market relevance.

Source: OECD (2018), Higher Education in Norway: Labour Market Relevance and Outcomes, Higher Education, OECD Publishing, Paris, https://doi.org/10.1787/9789264301757-en.
Enrolment in tertiary education in Norway is encouraged by generous financial support for students. Generally, there are no tuition fees and students receive loans and grants to cover living expenses. Students can combine study and part-time work without reduction in the financial support up to a ceiling. This level of financial support may be weakening the link between career considerations and the choice of field of study and the intensity of study. Students in Norway tend to be older on graduation than those in other countries (OECD, 2018g). While there is little appetite in Norway for a substantial downgrade in student support, there is nevertheless room for policy action.
The previous Survey suggests, for instance, altering living-expenses support for students so that it incentivises students to complete their studies on time, in addition to the existing financial incentives through the student loan scheme for those who complete their programmes within the prescribed time. To better match the skills of graduates with labour-market demands, students could be steered towards certain fields of study, occupations or regions via incentives in student financial assistance. This approach is used to an extent already. Debt relief on student loans is provided to graduates working in certain areas of northern Norway, medical practitioners in certain regions and some specialised teachers. Starting in 2025, primary teachers will also be included (OECD, 2018g). The authorities should monitor and evaluate the effectiveness of such financial incentives and expand them if proven effective.
A significant number of students change programmes and institutions throughout their studies, often delaying the completion of their programme. Better student support can help. Higher education institutions are required to enter into study contracts with students to monitor their progress and help them make good choices. An evaluation (Nordhagen et al., 2016), however, has found shortfalls in student support: many institutions were only checking student progress once a year and often letting students fall far behind in their studies before intervening. To better motivate higher education institutions for timely graduation of their students, the government could also put a greater weight on graduation rates in the formula for performance based funding.
Welcome progress is being made to improve the quality of teaching and courses in higher education. The 2003 Quality Reforms in Higher Education and the 2017 White Paper on the Quality Culture in Higher Education emphasise innovative teaching and learning approaches and aim to put teaching more centre stage. As discussed in the OECD review (OECD, 2018h), more effective teaching practices that enhance labour market relevance and outcomes are required. This means more widespread and effective use of student-centred, active learning approaches. Also, a greater focus on key transversal skills is required. The OECD review also recommends more learning via work placements, especially for humanities. The public sector should take a lead in this regard, offering more placements to higher education students outside the health and education sectors, where such practice is already well established.
Improving choices in education with career advice and better information
Better information and career guidance can help students choose a programme where they are likely to succeed and subsequently find a fulfilling job. The Norwegian Strategy for Skills Policy 2017-2021 stresses the importance of career guidance that provides coherent advice that draws on knowledge of the labour market and current and future skills needs (Figure 2.36). Furthermore, career counselling needs to start early to reduce dropout rates and poor choices in later stages. Through the Strategy, a Future Skills Needs Committee has also been established to assess and anticipate skill needs.
In Norway, all secondary-school students are entitled to career guidance. However, no specific background or qualification is required for guidance counsellors. Career guidance at schools is supported by a follow-up career guidance service for 16-21 year-olds who are not in education. However, despite the availability of career guidance services at school and beyond, only one in three students in higher education state that they are aware of the labour market opportunities available (Kantardjiev & Haakstad, 2017). To improve career guidance, Skills Norway has developed a new quality framework for career guidance to increase professionalism of guidance counsellors. Furthermore, Skills Norway is to establish a national e-guidance centre staffed by professional career guidance counsellors.
As regards higher education there is a government website with information on the types of jobs in which graduates from a certain field of study typically work, the number of people working in those occupations, the anticipated number of jobs in the future (based on projections of Statistics Norway), and the median earnings for a given occupation. However, there is no information regarding the performance of individual institutions or information on anticipated skills needs (OECD, 2018h). Following the recommendations in the White Paper on Quality Culture in Higher Education the government is planning to develop an improved web portal. It is important to ensure that the site is user friendly, and that students are aware of it.

Note: Skills shortages occur when the skills sought by employers are not available in the pool of potential recruits, whereas skills surpluses occur when the supply of certain skills is higher than the demand for them. The OECD Skill Needs Indicators measure the degree of shortage (positive values) and surpluses (negative values) for a range of dimensions, such as Skills, Abilities, and Knowledge areas. Results are presented on a scale that ranges between -1 and +1. The maximum value reflects the strongest shortage observed across OECD (31) countries and skills dimensions.
Source: OECD Skill needs database.
Skills reform for lifelong learning
With longer working lives and ongoing change in skills needs, lifelong learning is becoming increasingly important. As seen above, Norwegian adults take up training more than their counterparts in other OECD countries. There is considerable policy support for individuals to take up adult learning. After having worked for three years, adults have the right to up to three years of unpaid leave to pursue studies. Adult learners are also eligible for student loans and grants with an upper age limit of 65 years. Providers have also responded well to the demand for adult learning. Vocational colleges and higher education institutions offer a variety of short-cycle courses (continuing education) and in many VET programs work experiences can count towards completing qualifications. Admission in higher education institution recognises prior learning and work experience
The Norwegian government will present a white paper on a skills reform to the Parliament in 2020. The goal is to further promote learning throughout life and to provide workers with updated skills. As a first step, the government in cooperation with social partners is establishing programs for training that target sectors and industries where there is the greatest need for upskilling or reskilling. The government is also funding the development of short, flexible courses - that can be combined with full-time work - for advanced digital skills such as cyber security, artificial intelligence and the internet of things. These courses will be designed in cooperation between businesses and universities, and vocational education institutions (Norwegian Ministry of Education and Research, 2019).
Raising employment rates of immigrants
Norway has long been a net immigration country (Figure 2.37). The 2004 and 2007 enlargements of the common European labour market triggered large inflows of labour migrants from Central and Eastern Europe. Subsequently, during the refugee crisis in 2015, similar to many other European countries, Norway absorbed higher inflows of asylum seekers. Meanwhile, due to economic downturn following the 2014 oil-price drop, the inflow of economic migrants abated. An increasing share of recent immigrants are now from less developed countries, having arrived as refugees, while past immigration mostly comprised of economic migrants, family members and students (Nordic Council of Ministers, 2019; Figure 2.38). Immigration is changing Norway’s demographic composition and an increasing share of residents are foreign born (Figure 2.39).

Note: Net migration is the difference between the number of immigrants and the number of emigrants.
Source: Eurostat.
The substantial immigration of recent years, particularly from non-EEA countries, sparked a renewed policy focus on the complex issue of immigrant integration, where Norway, like many other countries, faces challenges. Immigration can bring substantial benefits in terms of meeting demand for workers and skills, but it may also make labour market conditions more difficult for people with similar skills. There have been some cases in Norway of employers hiring migrant workers outside collective agreements.
While natives have one of the highest employment rates among the OECD countries, foreign born are close to the OECD average (Figure 2.40). Unemployment rates are also significantly higher for immigrants, and foreign born are much more likely to be long-term unemployed than natives (OECD, 2018i). The changing composition of the immigrant population is also influencing integration. Education and skills of immigrants are considerably lower than that of the rest of the population (Figure 2.41). With the rising share of immigrants from less developed countries, the gap is rising. This is compounded by the comparatively small number of jobs suited to those with low education and skills in the Norwegian labour market (Figure 2.42). In addition, the compressed wage distribution implies that workers at the low end of the wage range are relatively expensive and therefore have to be relatively productive. Limited Norwegian languages skills can be another barrier to employment for many immigrants. As a result of these factors, the unemployment rate of immigrants with low education at 17.4% is almost 5 percentage points above the OECD average (Figure 2.43; OECD, 2018i).

Note: Gross flow of immigrants by reasons for immigration.
Source: Statistics Norway.
Worryingly, labour-market attachment among some immigrant groups appears to weaken over time, even among those that have had a job in the past. Research shows that in Norway immigrants from less developed countries work in firms more prone to bankruptcy and lay-offs. Compared to native workers they are also much less likely to find new employment once displaced (Bratsberg et al., 2018a). Studies tracking cohorts of refugee immigrants find that in the first five years after arriving in Norway employment rates rise, but then decline for the next 10-15 years. The falling employment rates are echoed in increasing dependency on social welfare. The decline in employment rates may reflect that some immigrant groups struggle to remain in employment once the support from integration programmes wanes (Bratsberg et al., 2017). However, the relative generosity of social benefits also lowers work incentives for low-skill low-educated workers (Bratsberg et al., 2018b).

Source: Nordic Statistics and OECD (2018), Indicators of Immigrant Integration 2018: Settling In.

Source: OECD (2018), Indicators of Immigrant Integration 2018: Settling In.

Note: Low educational attainment means less than primary and lower secondary education (levels 0-2 of ISCED11); Middle: upper secondary and post-secondary non-tertiary education (levels 3 and 4 of ISCED11); and High: Tertiary education (levels 5-8 of ISCED11).
Source: Eurostat.

Note: Elementary occupations are defined in the ILO's International Standard of Classification of Occupations (ISCO). The occupations consist of simple and routine tasks which mainly require the use of hand-held tools and often some physical effort. The skills required correspond to primary education (around five years).
Source: Eurostat.

Source: OECD (2018), Indicators of Immigrant Integration 2018: Settling In.
Given Norway’s small market for low-skill workers, and the seeming deterioration of labour market attachment in the long term, the policy focus should be on skills and with greater attention to long-term outcomes. Integration policy needs to align financial incentives (for immigrants, employers and with respect to social benefits), education and training, and societal integration for the whole immigrant family so that high employment is sustained. There should be focus on equipping immigrants with general skills that can help them change jobs and/or upskill. Targeted activation services should be offered to those unemployed, while welfare support should be linked to activation requirements to prevent labour force drop out.
Considerable effort has gone into upskilling and integrating newly arrived immigrants in Norway, at both the state and local-government level. Municipalities receive central-government grants to offer labour immigrants, family immigrants and refugees free-of-charge courses (Norwegian Language Training and Social Studies and Introduction Programme). In the Introduction programme – targeted at refugees and family migrants - an individualised plan is developed based on previous education and experience. The programme lasts 2-3 years and includes language training, courses in civic orientation and labour market activities. Participation is a prerequisite for permanent residence status and among the eligibility conditions for welfare benefits. Other targeted programmes are available for various vulnerable groups of immigrants.
Immigrant integration is an area where comprehensive success in outcomes is difficult to achieve and programmes can be costly. Strengthening the evidence base on the impact of programmes can substantially improve policymaking given the often limited and mixed results from existing studies (Nordic Council of Ministers, 2019). In addition, relatively little use is made of cost-benefit analyses of various education and labour market programmes, due to poor data on programme costs.
The Introduction programme includes different types of labour market activities such as work practice, subsidized employment and labour market training. Review of the evidence by the Nordic Council of Ministers (2019) identifies private-sector employment subsidies as the most effective measure in promoting regular employment - suggesting that work experience is key. Furthermore, it reports positive impact on employment from language training and labour market training. Job search assistance also has positive effects.
Work experience has been the focus of recent policy. In 2018, the government launched a new integration strategy for 2019–2022 - Integration through education and competence – which focuses heavily on labour market measures. The strategy focuses on occupational training – for trades where there is labour demand – together with Norwegian language skills. This approach could be pursued further. In particular, subsidised apprenticeship-type programs for immigrants could be introduced to ensure work experience leads to qualification. Initially, worker compensation could be primarily covered by the subsidy, but with gained experience and skill, wages could be raised and increasingly covered by the employer.
As reported above, immigrants with low education and skills are more likely than native workers to lose their jobs, and many end up on welfare. Targeted follow-up and support by activation services for laid-off immigrant workers could help them in their job search and in identifying reskilling needs. Reducing the financial attractiveness of remaining on welfare benefits may bring some positive marginal impact in employment, but risks reduced programme participation and increased poverty among immigrant households, as many benefit receivers will still stay outside employment (Bratsberg et al., 2018b). An alternative is to introduce stricter activation requirements for receiving benefits. Overall improvements to sickness and disability systems - as discussed earlier in the chapter - would likely temper the reliance on these benefits for immigrants alongside the rest of the population.
The assessment and recognition of qualifications and the validation of skills is an important tool for strengthening immigrants’ labour-market integration. According to the OECD International Migration Outlook 2018 (OECD, 2018j), recognition of qualifications has the highest yield when undertaken early in the integration process. Many skilled immigrants, including in Norway, work in jobs for which they are overqualified, wasting their potential and earning salaries below the level they could earn. This could be overcome by reducing uncertainty for employers on foreign qualifications and experience. In Norway, recognition of foreign vocational qualifications is administered by the Norwegian Agency for Quality Assurance in Education (NOKUT) in collaboration with the social partners. In addition, there are bridging courses for those trained as nurses and teachers in their country of origin. Bridging courses have also been developed for refugees with science or technology qualifications (Norwegian Ministries, 2019).
Recognition of previous training can be a particular challenge for refugees, who frequently have no proof of their qualifications. To overcome these difficulties, several international initiatives took place in 2017, such as the EU Skills Profile Tool for Third-Country Nationals and a new pilot project developed by the Council of Europe, granting European Qualifications Passports for Refugees. The project is based on a recognition methodology developed by the NOKUT. Validation of informally acquired skills is also important for migrants who lack formal qualifications. Germany’s public employment service has developed a smart “My Skills” tool that captures competences in 30 different professional areas (OECD, 2018j). This can help immigrants in finding a suitable job or suggest a need for targeted further training.
Bibliography
Arntz, M., T. Gregory and U. Zierahn (2016), “The Risk of Automation for Jobs in OECD Countries: A Comparative Analysis”, OECD Social, Employment and Migration Working Papers, No. 189, OECD Publishing, Paris.
Australian Human Rights Commission (2012), National Inquiry on Employment and Disability. 2012.
Autor, D., L. Katz and M. Kearney (2006), “The Polarization of the U.S. Labor Market”, American Economic Review, Vol. 96, No. 2, pp. 189-194.
Borgonovi, F., Ferrara, A., and Maghnouj, S. (2018), The gender gap in educational outcomes in Norway, OECD Education Working Papers, No. 183.
Bratsberg, B., Raaum, O., and Røed, K. (2018a), Job Loss and Immigrant Labor Market Performance, Economica, vol 85(337), 124-151.
Bratsberg, B., Raaum, O., and Røed, K. (2018b), Immigrant Responses to Social Insurance Generosity, IZA Discussion paper No. 11482, April 2018.
Bratsberg, B., Raaum, O., and Røed, K. (2017), Immigrant Labor Market Integration across Admission Classes, chapter Nordic Economic Policy Review: Labour Market Integration in the Nordic Countries, 17-54.
Cedefop (2018). Developments in vocational education and training policy in 2015-17: Norway. Cedefop monitoring and analysis of VET policies.
Cedefop (2017), Leaving education early: putting vocational education and training in centre stage – Norway.
De Wind, E. and C. Pronk (2018), International Labour and Compliance Handbook: Labour and Employment Compliance in the Netherlands, International Bar Association, Wolters Kluwer.
EACEA (2019), EACEA National Policies Platform- Norway. 3.5 Traineeships and apprenticeships.
Fernandez, R., Hijzen, A., Pacifico, D., and Thewissen, S. (forthcoming), Identifying and addressing employment barriers in Belgium and Norway: Implementing the OECD Jobs Strategy.
Fernandez, R., Immervoll, H., Pacidico, D., and Thévenot, C. (2016), "Faces of Joblessness: Characterising Employment Barriers to Inform Policy", OECD Social, Employment and Migration Working Papers, No. 192, OECD Publishing, Paris.
Goos, M. and A. Manning (2007), “Lousy and Lovely Jobs: The Rising Polarization of Work in Britain”, Review of Economics and Statistics, Vol. 89, No. 1, pp. 118-133.
Goos, M., A. Manning and A. Salomons (2009), “Job Polarization in Europe”, American Economic Review, pp. 58-63.
Hemmings, P. and Prinz C. (2019), Sickness, Disability and Employment: comparing data and policy in Norway with that in Sweden, the Netherlands and Switzerland, OECD Economics Department Working Paper, forthcoming.
Haukås, M. and Skjervheim, K. (2018). Vocational education and training in Europe – Norway. Cedefop ReferNet VET in Europe reports.
Hijzen, A., Lillehagen, M. E., and Zwysen, W. (forthcoming), Job mobility, reallocation and wage growth: A tale of two countries.
Kantardjiev, K. and J. Haakstad (2017), Working Life Relevance in Norwegian discipline-oriented programmes; Knowledge status and student perceptions, Paper presented at the 39th Annual EAIR Forum 2017, 3-6 September 2017, Porto, Portugal.
Kuczera, M. (2017), Incentives for apprenticeship, OECD Education Working Papers No. 152.
Mogstad Aspøy, T. and Nyen, T. (2015), Godt, men ikke for godt – Evaluering av forsterket alternativ Vg3 for elever som ikke får læreplass [Good, but not too good – an evaluation of the reinforced alternativeVG3 for students who did not secure an apprenticeship], FAFO-report 2015:46.
National Commission on Gender Equality in Education (2019), The Male Disadvantage in Educational Achievement and Attainment, Background Note. Oslo, May 2019.
Nedelkoska, L. and G. Quintini (2018), Automation, skills use and training, OECD Social, Employment and Migration Working Papers, No. 202, OECD Publishing, Paris.
Nordhagen, I.C.; M. Dahle and Ø. Skjervheim (2016), Utdanningsplaner − et virkemiddel for gjennomføring?, Report 2016/08, ideas2evidence.
Nordic Council of Ministers (2019), Integrating Immigrants into the Nordic Labour Markets. Copenhagen: Nordisk Ministerrad, 2019.
Norges Bank (2019), Monetary Policy Report with financial stability assessment, 1/19.
Norwegian Directorate for Education and Training (2017), The Education Mirror, 2017.
Norwegian Ministries (2019), Immigration and Integration 2017–2018, Report for Norway to the OECD.
Norwegian Ministry of Education and Research (2019), Updates on policy initiatives in primary and secondary education and degree-level education. Presentation given during the OECD mission to Norway (Skoklefald, G., Farstad, H., and Rødder, A.), February 2019.
OECD (2019a), OECD Employment Outlook 2019. The Future of Work. OECD Publishing, Paris.
OECD (2019b), Making adult learning systems future ready for all, Chapter 6 in the OECD Employment Outlook 2019. OECD Publishing, Paris.
OECD (2018a), Good jobs for all in Changing World of Work. OECD Jobs Strategy.
OECD (2018b), How does Norway compare? OECD Jobs Strategy.
OECD (2018c), A Broken Social Elevator? How to Promote Social Mobility, OECD Publishing, Paris.
OECD (2018d), OECD Economic Surveys: Norway 2018, OECD Publishing, Paris.
OECD (2018e), Starting Strong. Engaging Young Children. Lessons from research about quality in early childhood education and care, OECD Publishing, Paris.
OECD (2018f), Investing in Youth: Norway, OECD Publishing, Paris.
OECD (2018g), OECD Economic Surveys: Norway 2018, OECD Publishing, Paris.
OECD (2018h), Higher Education in Norway: Labour Market Relevance and Outcomes, OECD Publishing, Paris.
OECD (2018i), Settling In 2018. Indicators of Immigrant Integration, OECD Publishing.
OECD (2018j), International Migration Outlook 2018, OECD Publishing.
OECD (2017a), "How technology and globalisation are transforming the labour market", Chapter 3, Employment Outlook 2017.
OECD (2017b), OECD Skills Outlook 2017: Skills and Global Value Chains, OECD Publishing, Paris.
OECD (2017c), OECD Skills Outlook 2017: Skills and Global Value Chains, OECD Publishing, Paris.
OECD (2017d), Education at a Glance 2017, OECD Indicators. OECD Publishing, Paris.
OECD (2017e), Starting Strong 2017: Key OECD Indicators on Early Childhood Education and Care, OECD Publishing, Paris.
OECD (2016a), Skills for a Digital World: 2016 Ministerial Meeting on the Digital Economy Background Report, OECD Digital Economy Papers, No. 250, OECD Publishing, Paris.
OECD (2016b), “Skills for a Digital World: 2016 Ministerial Meeting on the Digital Economy Background Report”, OECD Digital Economy Papers, No. 250, OECD Publishing, Paris.
OECD (2016c), PISA 2015 Results (Volume I): Excellence and Equity in Education, PISA, OECD Publishing, Paris.
OECD (2016d), OECD Economic Surveys: Norway 2016, OECD Publishing, Paris.
OECD (2015), Fit Mind, Fit Job: from evidence to Practice in Mental Health and Work, OECD Publishing, Paris.
OECD (2013), Mental Health and Work: Norway, OECD Publishing, Paris.
OECD (2014), Mental Health and Work: Switzerland, OECD Publishing, Paris.
OECD (2010), Sickness, Disability and Work: Breaking the Barriers: A synthesis of findings across OECD Countries, OECD Publishing Paris.
OECD (2006), Sickness, Disability and Work: Breaking the Barriers (Vol 1), Norway, Poland and Switzerland, OECD Publishing, Paris.
Øverland, S., A.L. Grasdal, S.E. Reme, (2018), “Long-term effects on income and sickness benefits after work-focused cognitive-behavioural therapy and individual job support: a pragmatic, multicentre, randomised controlled trial”, Occupational & Environmental Medicine 75(10): 703-708.
Reme, S.E., A.L. Grasdal, C. Løvvik, S.A. Lie, S. Øverland, (2015), Work-focused cognitive-behavioural therapy and individual job support to increase work participation in common mental disorders: A randomised controlled multicentre trial, Occupational & Environmental Medicine 72(10): 745-752.
Metadata, Legal and Rights
https://doi.org/10.1787/c217a266-en
© OECD 2019
The use of this work, whether digital or print, is governed by the Terms and Conditions to be found at http://www.oecd.org/termsandconditions.
