
7. Immigrant background and student performance
This chapter examines the mathematics and reading performance of students with an immigrant background in PISA-participating countries and economies. It investigates who these students are and how their circumstances (i.e. socio-economic status and linguistic background) relate to their performance in mathematics and reading. The chapter also explores performance gap trends in terms of immigrant background.
For Australia, Canada, Denmark, Hong Kong (China), Ireland, Jamaica, Latvia, the Netherlands, New Zealand, Panama, the United Kingdom and the United States, caution is required when interpreting estimates as one or more PISA sampling standards were not met (see Reader’s Guide, Annexes A2 and A4).
Immigrant students scored higher in mathematics than non-immigrant students in eight countries/economies before accounting for students’ backgrounds; in 17 countries/economies once students’ socio-economic status had been accounted for; and in 16 countries/economies once students’ socio-economic status and the language they speak at home had been accounted for. Non-immigrant students scored higher in mathematics than immigrant students in 22 countries/economies but only in eight once students’ socio-economic status and the language they speak at home had been accounted for. Similar relationships are observed between students' immigrant backgrounds and performance in reading.
Disparities in mathematics performance by immigrant background did not change between 2018 and 2022 in most countries/economies with comparable PISA data. The mathematics performance gap shifted in favour of immigrant students in Canada*, Kazakhstan and the United Kingdom*. In Canada*, the gap was not significant in 2018 but immigrant students outperformed their non-immigrant peers in mathematics in 2022. In Kazakhstan and the United Kingdom*, a gap in favour of non-immigrants in PISA 2018 narrowed into a statistically insignificant gap in 2022. By contrast, in Saudi Arabia the performance gap in favour of non-immigrant students narrowed by 15 percentage points because non-immigrant students’ performance improved and immigrant students did not change between 2018 and 2022.
The share of socio-economically disadvantaged students is greater among immigrant than non-immigrant students on average across OECD countries and in 28 countries and economies (not counting countries/economies with less than 5% of immigrant students). In eight countries and economies, however, it is greater among non-immigrant students (Brunei Darussalam, Malta, Montenegro, Qatar, Saudi Arabia, Serbia, Singapore and the United Arab Emirates). In another four countries and economies, the share of disadvantaged students is not statistically significantly different by immigration background.
The share of immigrant students has remained predominantly stable in most PISA-participating countries since 2012 but increased in 20 countries/economies and declined in five. On average across OECD countries, the share of 15-year-old students with an immigrant background is 13%. In 21 of the 81 countries and economies in PISA 2022, the share of immigrant students is higher than 15% and in 11 of them it is higher than 25%. In 40 countries and economies, students with an immigrant background comprise less than 5% of the 15-year-old student population.
A fair education system gives students with an immigrant background an equal opportunity to thrive at school and realise their full learning potential. This chapter examines the extent to which the countries and economies that participated in PISA 2022 ensure that all students are on a level playing field regardless of their immigrant backgrounds.
Overall, results in this chapter show that non-immigrant students tend to outperform immigrant students in all PISA subjects in most (but not all) countries. However, this gap in performance in favour of non-immigrant students can be explained to a large extent by the socio-economic and linguistic barriers that immigrant students face. Once socio-economic status and language spoken at home are taken into account in the analysis, it turns out that immigrant students outperform non-immigrant students in more countries/economies than where the opposite is true. What’s more, there are countries/economies that combine large shares of students with an immigrant background and high average levels of performance (Canada*, Hong Kong [China]*, Macao [China] and Switzerland). This finding goes against the common misconception that the more immigrant students there are, the lower performance is. PISA results show that it remains a challenge for education systems to create school environments that are accepting of diversity, multiculturalism and immigrant students1.
PISA defines immigrant students as students whose mother and father were both born in a country/economy other than that where the student took the PISA test. Non-immigrant students are students who have at least one parent born in the country of assessment.
Education systems around the world vary greatly in terms of how large their immigrant student population is (Figure I.7.1). In about half of the countries and economies in PISA 2022 (40 out of 80), the share of 15-year-old students with an immigrant background is small (less than 5%). But in 20 countries and economies, the share of immigrant students is higher than 15%; in 11 countries and economies it is higher than 25%; and in Macao (China), Qatar and the United Arab Emirates more than half of students have an immigrant background. On average across OECD countries, 13% of students have an immigrant background.
Students with an immigrant background can be distinguished between first- and second-generation immigrants. First-generation immigrants are students born outside the country of assessment and whose parents were also born outside the country of assessment. Second-generation students are students born in the country of assessment but whose parent(s) were born outside the country of assessment.
The share of second-generation immigrants is 8% and the share of first-generation immigrants 5% on average across OECD countries in PISA 2022 (Figure I.7.1). In 36 countries and economies there are more second-generation than first-generation immigrant students although in most cases the difference in the share of second- and first-generation immigrant students is small (i.e. five percentage points or fewer)2. The share of second-generation immigrant students is more than 10 percentage points more than the share of first-generation immigrant students only in the United States*, Macao (China) and Hong Kong (China)* (in ascending order).
By contrast, there are more first- than second-generation immigrant students in 20 countries and economies but only in Chile, Malta, Qatar, Singapore and the United Arab Emirates is the share of first-generation immigrant students larger by more than 5%.
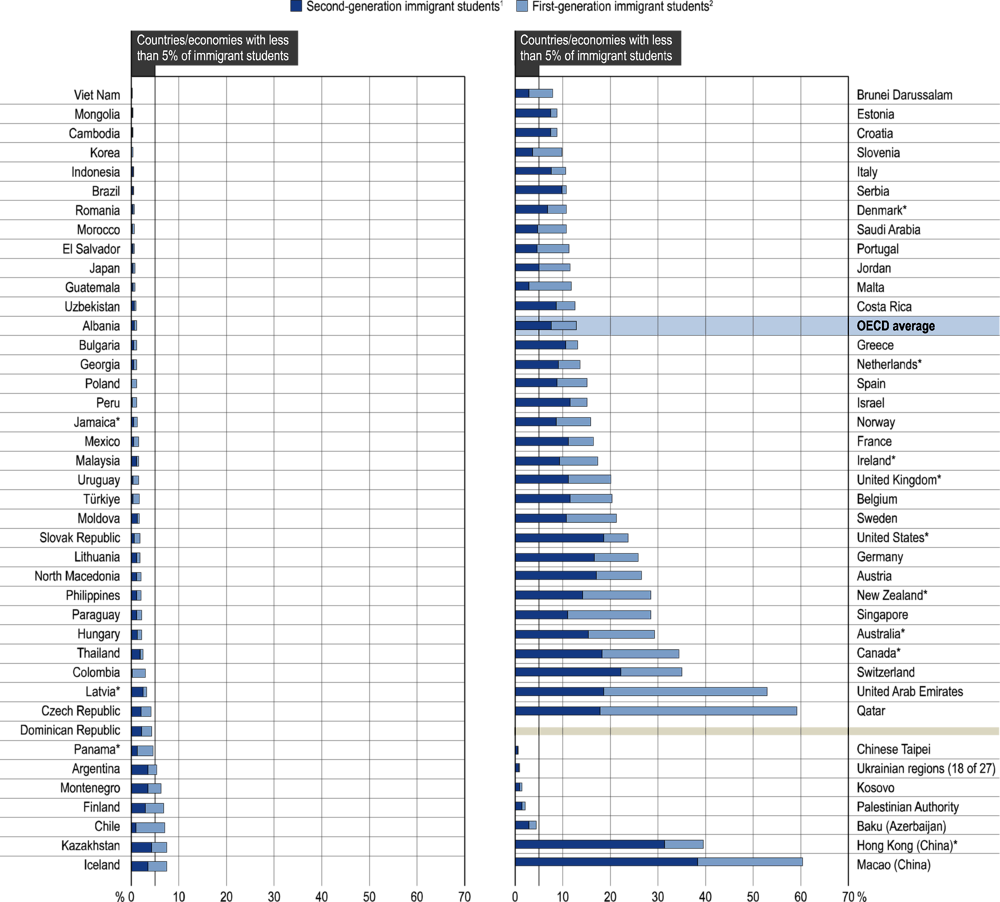
1. Second-generation immigrant students are those born in the country of assessment but whose parent(s) were born in another country.
2. First-generation immigrant students are those born outside the country of assessment and whose parents were also born in another country.
Countries and economies are ranked in ascending order of the share of students with an immigrant background.
Source: OECD, PISA 2022 Database, Table I.B1.7.1
Figure I.7.2 shows that the percentage of immigrant students has remained stable in most PISA-participating countries since 2012. Only countries where more than 5% of students have an immigrant background in 2022 are represented in the figure.
Between PISA 2018 and 2022, the percentage of immigrant students increased on average across OECD countries and in 11 out of 40 countries/economies included in Figure I.7.2. However, in most of these countries/economies the margin of increase was small – between one and four percentage points.
In Portugal, where the share of immigrant students saw the largest increase, the share of immigrant students was 7% in PISA 2018 and 11% in PISA 2022 (a four percentage-point increase).
When considering changes over the last decade (i.e. between 2012 and 2022), 23 out of 40 countries with more than 5% of students participating in PISA 2022 show increases in their share of students with an immigrant background. The share of immigrant students increased in this period by between 10 and 12 percentage points in Austria, Germany, Singapore and Switzerland. In these four countries, the increase in immigrant students is due to an increase in the share of both first- and second-generation immigrant students.
The share of immigrant students has rarely declined among PISA-participating countries. Between 2018 and 2022, it declined in only three countries/economies (Estonia, Macao [China], the United Arab Emirates) and never by more than three percentage points. Between 2012 and 2022, the share of immigrant students declined in five countries (Croatia, Israel, Jordan, Kazakhstan and Macao [China]) and never by more than nine percentage points.
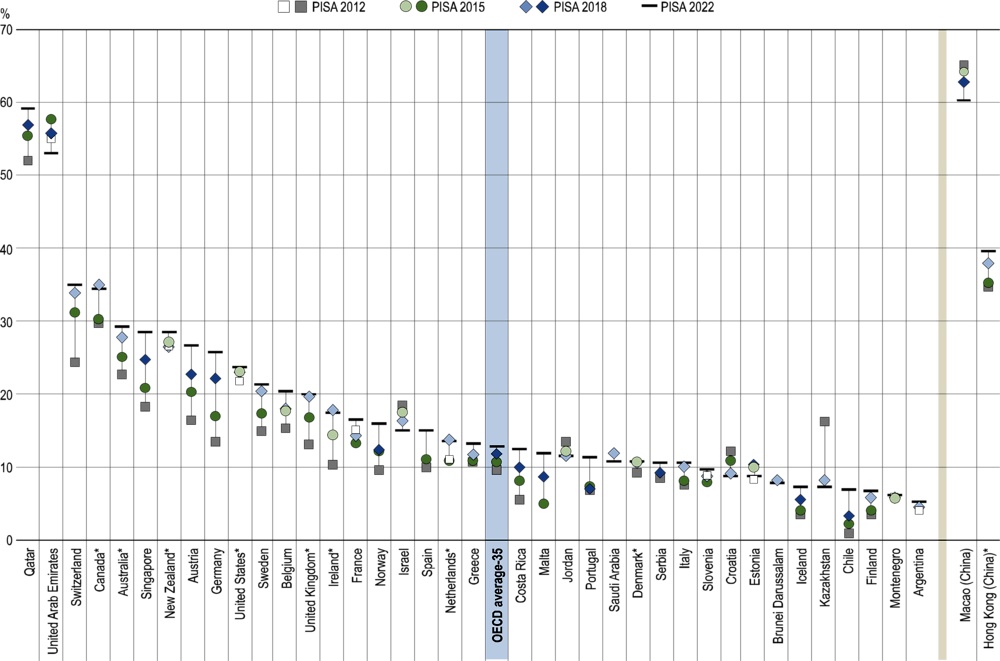
Notes: Statistically significant differences in the share of immigrant students between PISA 2022 and previous cycles are shown in a darker tone (see Annex A3).
Countries/Economies where less than 5% of students have an immigrant background in 2022 are not represented in the figure.
Countries and economies are ranked in descending order of the share of immigrant students in 2022.
Source: OECD, PISA 2022 Database, Tables I.B1.7.1, I.B1.7.2, I.B1.7.3 and I.B1.7.4
Immigrant students and socio-economic status3
Students with an immigrant background typically have a more disadvantaged socio-economic profile than non-immigrant students4.
As shown in Figure I.7.3, the share of disadvantaged students is almost 37% among immigrant students and 22% among non-immigrant students on average across OECD countries. In Greece, Norway and Slovenia the difference in the share of disadvantaged students by immigration background is the largest among countries and economies in PISA 2022 (more than 35 percentage points more among immigrant students).
There are, however, eight countries and economies where the opposite is observed. The largest differences are found in Qatar, Singapore and the United Arab Emirates, where the share of disadvantaged students is greater among non-immigrant than immigrant students by more than 10 percentage points.
In another four countries, the share of disadvantaged students is not statistically significantly different by immigration background.
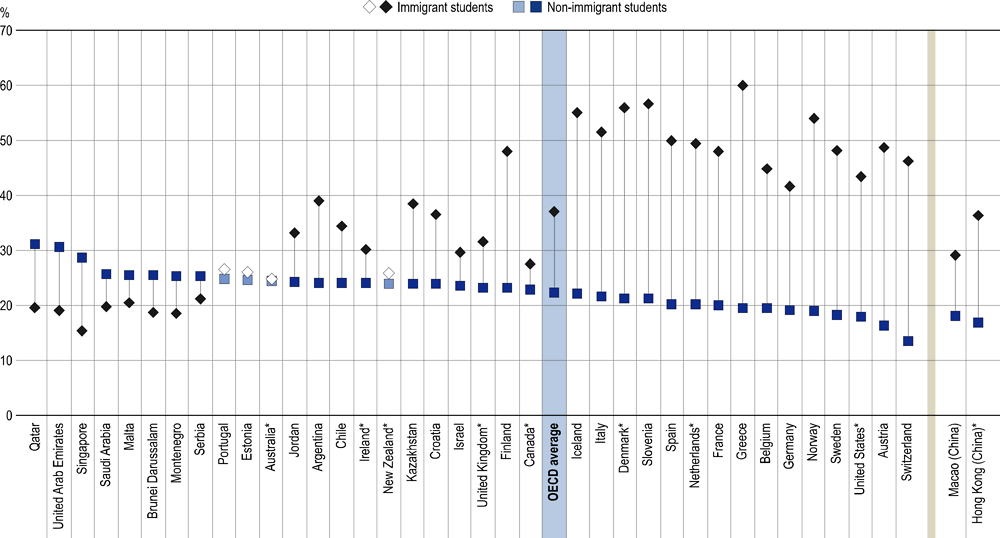
Notes: Statistically significant differences in share of disadvantaged students are shown in a darker tone (see Annex A3).
Countries/Economies where less than 5% of students have an immigrant background are not represented in the figure.
Socio-economic status is measured by the PISA index of economic, social and cultural status.
Countries and economies are ranked in descending order of the share of disadvantaged students among non-immigrant students.
Source: OECD, PISA 2022 Database, Table I.B1.7.5.
Immigrant students and language spoken at home
This section5 shows that most students with an immigrant background speak a language at home that is different from the language in which they took the PISA assessment. This is truer for first-generation than second-generation immigrants. There are also many countries where the share of students with an immigrant background who speak a different language at home has increased over the last decade and in recent years. This is important for policy and educators because lower proficiency in the language spoken at school can hinder immigrant students from fully integrating. This language barrier can be particularly hard to overcome for first-generation immigrant students who were born (and in some cases completed part of their education) in countries where the language is different from that of the host country.
In 2022 and earlier assessments, PISA asked students what language they spoke at home most of the time. On average across OECD countries in PISA 2022, 11% of all students (regardless of their immigrant background) speak a language at home that is different from the language in which they took the PISA assessment (Table I.B1.7.9). This proportion is greater among immigrant students than non-immigrant students on average across OECD countries (47 percentage points difference) and in 62 out of 77 countries/economies with available data (i.e. this latter count includes countries/economies with less than 5% of immigrant students). This difference ranged from two percentage points in Jordan to 84 percentage points in Iceland.
Among first-generation immigrant students, the percentage of students who mainly speak another language at home is 62% on average across OECD countries whereas it is 44% among second-generation immigrant students (Table I.B1.7.9). In the Czech Republic, Iceland, Morocco, and Slovenia, more than 90% of first-generation immigrant students reported that they mainly speak another language at home. In Brunei Darussalam, Austria, Finland and Iceland, more than 70% of second-generation immigrant students mainly speak another language at home.
In terms of changes over time, the share of immigrant students who mainly speak another language at home has not changed between PISA 2018 and 2022 in 24 out of 39 countries/economies included in Figure I.7.4 (i.e. only countries/economies with at least 5% of students with an immigrant background in 2022). It has increased in 12 countries/economies and decreased in three (Costa Rica, Macao [China] and Serbia).
When considering long-term trends between 2012 and 2022, the share of immigrant students who mainly spoke another language at home did not change in 16 out of 37 countries/economies with available data. It increased in 18 countries/economies and decreased in three (Estonia, Qatar and Singapore).
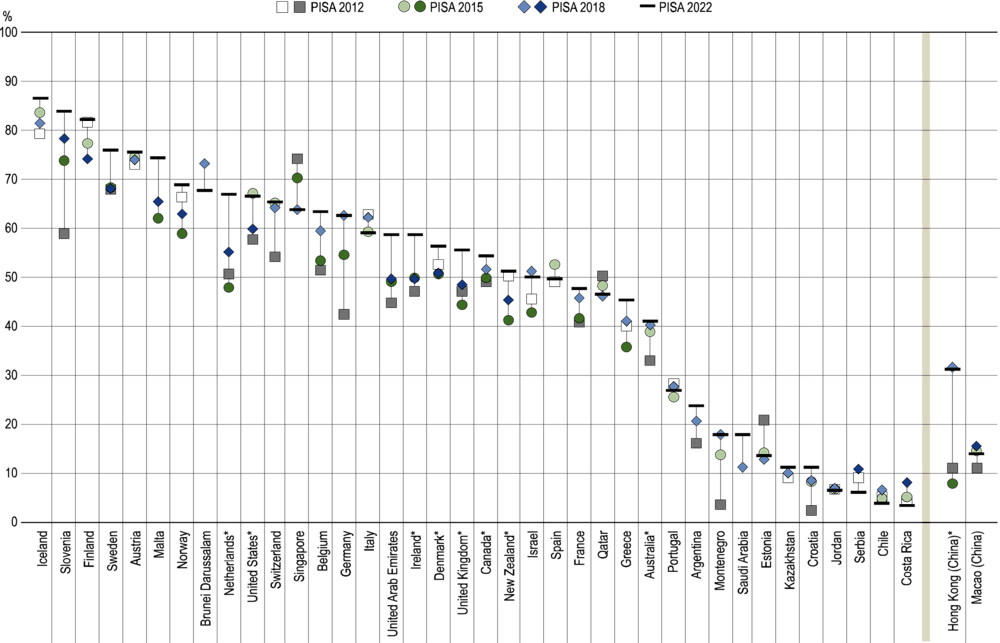
Notes: Statistically significant differences in the share of immigrant students who do not speak the language of assessment at home between PISA 2022 and previous cycles are shown in a darker tone (see Annex A3).
Countries/Economies where less than 5% of students have an immigrant background in 2022 are not represented in the figure.
Countries and economies are ranked in descending order of the share of immigrant students who do not speak the language of assessment at home in 2022.
Source: OECD, PISA 2022 Database, Tables I.B1.7.9, I.B1.7.10, I.B1.7.11 and I.B1.7.12.
First-generation immigrant students and age at arrival
First-generation immigrants who take the PISA test arrive in the host country at different ages. Some arrive in their early childhood, that is, by age 5 or before (“early arrivers” as they will be referred to in this chapter). Others arrive as late as age 12 or later (these will be referred to as “late arrivers”). Early arrivers are immigrant students who started primary school and completed most of their compulsory education in their host country. Late arrivers completed several years of schooling before moving to their host country. Late arrivers are more likely to face language barriers and experience disruption because they must adapt to a different education system (Cerna, Brussino and Mezzanotte, 2021[1]).
On average across OECD countries in PISA 2022, the percentage of first-generation immigrant students who arrived at their host country/economy at or before age 5 (early arrivers) is 34%; 29% arrived after age 12 (late arrivers) (Table I.B1.7.13). There is, however, wide variation in these percentages, as shown in Figure I.7.5. For example, in Greece and Kazakhstan, the share of early arrivers is as high 60% and the share of late arrivers as low as roughly 15%. By contrast, in Chile and Portugal the share of early arrivers is as low as roughly 15% and the share of late arrivers as high as more than half of all first-generation immigrant students.
In Chile, only 1% of students had an immigrant background in PISA 2012; this percentage has increased slowly but persistently across PISA assessments, reaching 7% in PISA 2022. Most immigrant students in Chile are, therefore, first-generation immigrants. Back in PISA 2012, a little less than half of first-generation immigrant students arrived in Chile between the ages of 6 and 11 (“mid-arrivers”). But a gradual increase in the share of late arrivers along with a decrease in the share of early arrivers has been happening in Chile since 2012. In PISA 2022, 52% of first-generation immigrants are later arrivers, 36% are mid-arrivers and 12% are early arrivers in Chile. These trends in the composition of immigrant students occur in the larger context of recent immigration trends in Chile, which has seen large influxes of newcomers, including asylum seekers, from Latin American countries (especially Colombia, Haiti and Venezuela)6.
Between PISA 2018 and PISA 2022, the composition of first-generation immigrants remained stable in most of the 39 countries/economies with available data included in Figure I.7.5. In 28 countries/economies, the share of early arrivers did not change in this period; similarly, in 24 countries/economies the share of late arrivers did not change. However, in countries where this composition has changed over time, the predominant trend is a decline in early and late arrivers, and an increase in mid-arrivers, i.e. those who arrived at ages 6-11 (Table I.B1.7.15).
Between PISA 2012 and 2022, the share of early arrivers decreased in 12 out of 41 countries/economies with available data and increased in eight (Table I.B1.7.16). In the same period, the share of late arrivers increased in 13 countries/economies and decreased in seven.
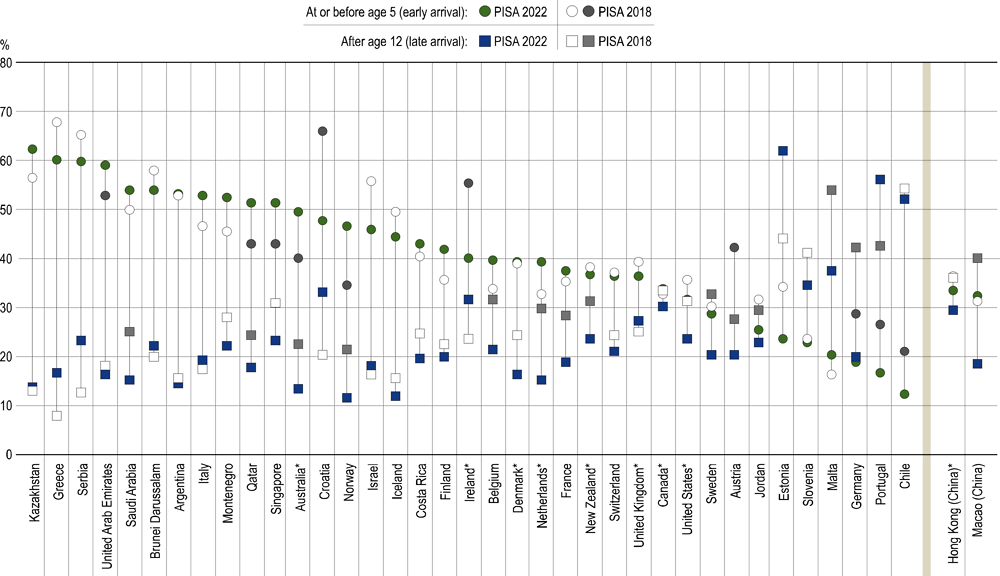
Notes: Statistically significant differences in the share of immigrant students who arrived at or before the age of 5 or after age 12 between PISA 2018 and PISA 2022 are shown in a darker tone (see Annex A3).
Countries/Economies where less than 5% of students have an immigrant background in 2022 are not represented in the figure.
Countries and economies are ranked in descending order of the share of immigrant students who arrived at or before the age of 5 in 2022.
Source: OECD, PISA 2022 Database, Tables I.B1.7.13, I.B1.7.14 and I.B1.7.15.
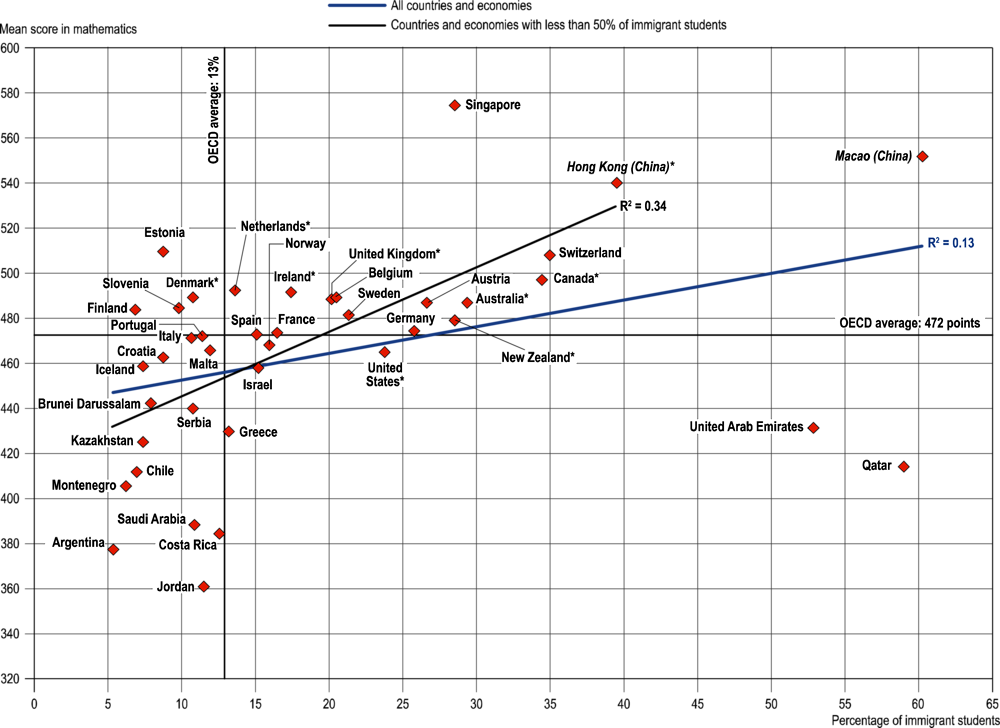
PISA 2022 provides no bases for the claim that larger proportions of students with an immigrant background are related to poor education outcomes in host countries.
Figure I.7.6 shows a positive relationship between the share of immigrant students and mean performance in mathematics in PISA 2022, meaning that the greater the share of immigrant students the higher the country’s mean performance in mathematics in PISA 2022. Among countries that have between five and 15 percent of immigrant students there is wide variation in mean performance; for example, Croatia and Estonia have similar shares of immigrant students (about nine percent) but very different mean performances in mathematics (463 points in Croatia and 510 in Estonia). However, among countries/economies where the share of immigrant students is between 15% and 40% the correlation is much stronger: Canada*, Hong Kong (China)* and Switzerland are examples of countries/economies that receive many immigrant students and have strong performances.
Macao (China), Qatar and the United Arab Emirates are outliers in the sense that their share of immigrant students is much higher (i.e. more than 50% of the student population) than that of all other PISA-participating countries/economies. Each should be examined in its own context (i.e. social demographic profile of immigrant population, immigration policies, educational policies towards immigrant, etc). Macao (China) has one of the highest levels of mathematics performance; by contrast, Qatar and the United Arab Emirates performed below the OECD average in mathematics.
These results should be interpreted carefully because they do not consider national income, which is correlated with both mean performance7 and the share of immigrant students8. After accounting for national income, the correlation between the share of immigrant students and mean performance in mathematics in PISA 2022 becomes very weak or close to zero9.
The relationship between immigrant background and student performance must also be examined by looking at differences between immigrant and non-immigrant students within countries. Figure I.7.7 and Figure I.7.8 show disparities by immigrant background in student performance in mathematics and reading, respectively.
Because differences in student performance by immigrant background are related to differences in the socio-economic status and linguistic background of immigrant and non-immigrant students, accounting for these students’ backgrounds is important. As shown in the analyses below, net differences (i.e. after accounting) in mathematics performance by immigrant background are typically smaller than raw differences (i.e. before accounting), meaning there is less of a performance gap between immigrant and non-immigrant students when comparing these two groups of students with similar socio-economic status and home language. This shows that policies that tackle the socio-economic and linguistic barriers immigrant students face can boost immigrant student performance. This, and improving attitudes towards immigrants in their host countries, and making schools more welcoming of diversity and multiculturalism can boost outcomes for immigrant students even more (Buchmann and Parrado, 2006[2]; Marks, 2005[3]; Portes and Zhou, 1993[4]; Feliciano, 2020[5]).
Figure I.7.7 shows disparities in student performance in mathematics related to immigrant background (hereafter, this will be referred to as the “immigration gap” in student performance). On average across OECD countries, non-immigrant students scored 29 score points more than immigrant students in mathematics before accounting for students’ backgrounds. Once student socio-economic status was taken into account, however, the immigration gap in mathematics performance in favour of non-immigrant students narrows to 15 points. Furthermore, after student socio-economic status and language spoken at home were accounted for, the score-point difference in favour of non-immigrant students narrows even further to a mere five points on average across OECD countries (Figure I.7.7).
Before accounting for students’ backgrounds, non-immigrant students outperformed immigrant students in mathematics in 22 out of the 39 countries/economies included in Figure I.7.7; immigrant students outperformed non-immigrant students in nine countries/economies (Australia*, Brunei Darussalam, Canada*, New Zealand*, Qatar, Saudi Arabia, Singapore and the United Arab Emirates); and the difference between immigrant and non-immigrant students in mathematics performance is not significant in nine countries/economies (Argentina, Jordan, Kazakhstan, Macao [China], Malta, Montenegro, Serbia, the United Kingdom* and the United States*).
After accounting for students’ socio-economic status, however, non-immigrant students scored higher in mathematics than immigrant students in 17 countries/economies but immigrant students scored higher than non-immigrant did in 14 countries/economies.
Socio-economic status alone accounts for more than half of the gap in mathematics performance in favour of non-immigrant students in several countries/economies; in France, Greece, Norway, Spain and Switzerland, student socio-economic status accounts for more than 60% of the immigration gap in mathematics. In Spain, where 15% of students have an immigrant background in PISA 2022, non-immigrant students scored 32 score points more than immigrant students in mathematics before accounting for student socio-economic status but only seven points more once it was accounted for. In four countries and economies (Croatia, Ireland*, Israel and Italy), non-immigrant students outperformed immigrant students in mathematics before accounting for other variables but after accounting for student socio-economic status the net score-point difference turned out to be not statistically significant.
After accounting for students’ socio-economic status and language spoken at home, immigrant students scored higher in mathematics than non-immigrant students in 16 countries/economies while non-immigrant students scored higher in mathematics than immigrant students in only eight countries/economies. The difference between immigrant and non-immigrant students is not significant in 15 countries/economies after accounting for students’ socio-economic status and language spoken at home.
In seven European countries (Austria, Belgium, Finland, Germany, the Netherlands*, Slovenia and Sweden), the gap in mathematics performance by immigration background before accounting for other variables is the largest: non-immigrant students scored, on average, over 55 score points more than immigrant students. This large gap can be explained in part by socio-economic differences: in these countries, the share of disadvantaged students is at least 20 percentage points more among immigrant than non-immigrant students (see Figure I.7.3). Accounting for socio-economic status, however, reduces the immigration gap by more than half in Austria, Belgium, the Netherlands* and Slovenia; and by more than a third in Finland, Germany and Sweden. For example, in the Netherlands*, the immigration gap is 58 points before and 27 after accounting for student socio-economic status; in Slovenia non-immigrant students scored 60 points more than immigrant students before accounting for other variables but only 29 points more after accounting for student socio-economic status. In Finland, non-immigrant students scored 64 points more than immigrant students before accounting for other variables and 42 points more after accounting for student socio-economic status. The remaining gap in performance can be explained to a large extent by language barriers. In these seven countries, between 60% and 85% of immigrant students do not speak the language of assessment at home (see Figure I.7.4). After accounting for socio-economic status and language spoken at home, the immigration gap in mathematics performance becomes not significant in Austria, Germany, the Netherlands* and Slovenia but remains stubbornly large in Finland (29 score-point difference), Sweden (27 points) and Belgium (17 points).
In the United States*, where one in four students have an immigrant background in PISA 2022, immigrant and non-immigrant students did not perform significantly different in mathematics before accounting for other variables. However, after student socio-economic status was accounted for immigrant students outperformed non-immigrant students by 16 score points. Furthermore, after accounting socio-economic status and language spoken at home, immigrant students in the United States* outperformed non-immigrant students by 28 score points. This finding suggests that dismantling the social and linguistic barriers immigrant students face could lead to significant performance gains among these students.
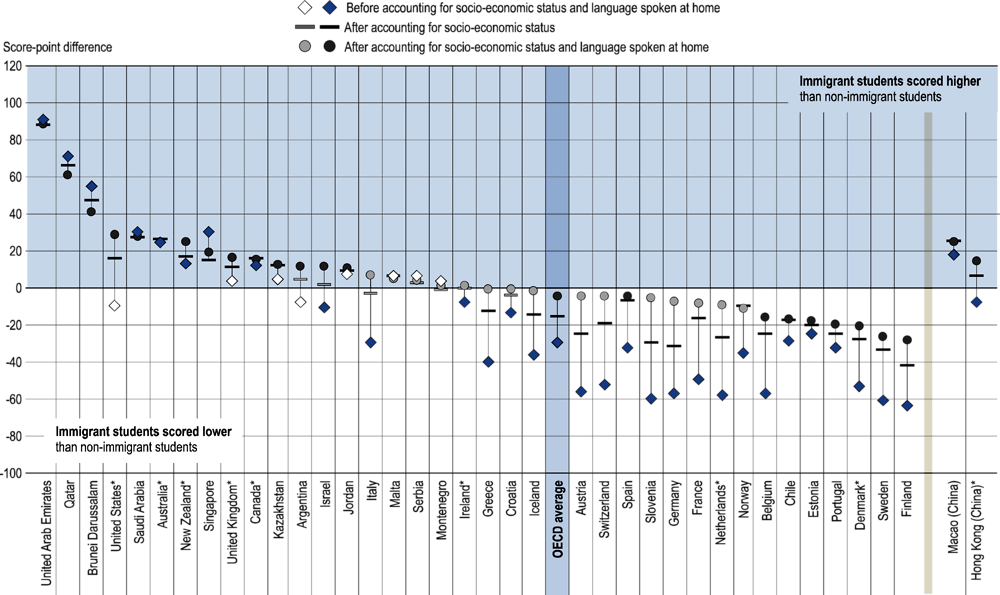
Notes: Statistically significant differences in mathematics performance are shown in a darker tone (see Annex A3).
Countries/Economies where less than 5% of students have an immigrant background are not represented in the figure.
Socio-economic status is measured by the PISA index of economic, social and cultural status.
Countries and economies are ranked in descending order of the gap in mathematics performance related to immigrant background, after accounting for students' socio-economic status and language spoken at home.
Source: OECD, PISA 2022 Database, Table I.B1.7.52.
In reading, similar patterns were found as those observed in mathematics. On average across OECD countries, non-immigrant students outperformed immigrant students in reading by 39 score points before accounting for other factors, by 25 after accounting for student socio-economic status, and by nine points after accounting for student socio-economic status and language spoken at home (Figure I.7.8).
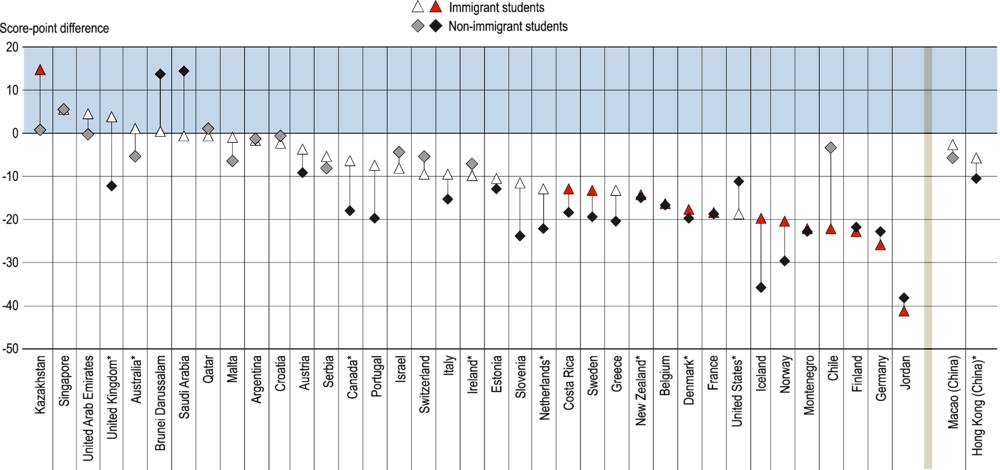
Before accounting for students’ backgrounds, immigrant students scored higher in reading than non-immigrant students in eight countries and economies, and non-immigrant students scored higher than immigrant students in 22 countries and economies and on average across OECD countries. The difference between immigrant and non-immigrant students in reading performance is not significant in nine countries/economies before accounting for other factors.
After accounting for student socio-economic status, immigrant students scored higher than non-immigrant students in reading in 10 countries and economies while non-immigrant students scored higher than immigrant students in 18 countries and economies and on average across OECD countries. The difference between immigrant and non-immigrant students in reading performance is not significant in 11 countries/economies after accounting for student socio-economic status.
After accounting for student socio-economic status and language spoken at home, immigrant students scored higher than non-immigrant students in reading in 13 countries and economies while non-immigrant students scored higher than immigrant students in only nine countries and economies, and on average across OECD countries. The difference between immigrant and non-immigrant students in reading performance is not significant in 17 countries/economies after accounting for student socio-economic status and language spoken at home.
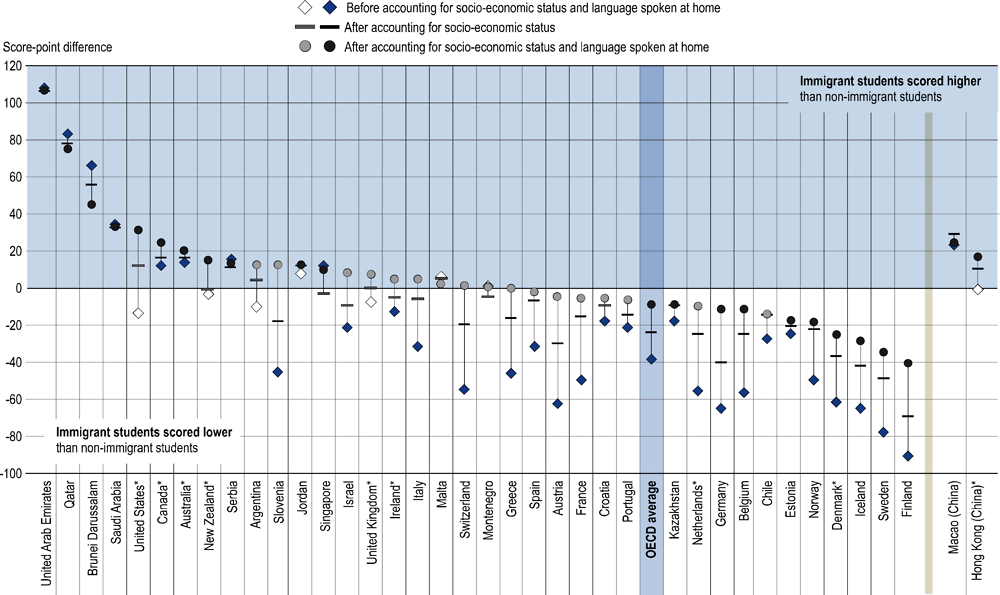
Notes: Statistically significant differences in reading performance are shown in a darker tone (see Annex A3).
Countries/Economies where less than 5% of students have an immigrant background are not represented in the figure.
Countries and economies are ranked in descending order of the gap in reading performance related to immigrant background, after accounting for students' socio-economic status and language spoken at home.
Source: OECD, PISA 2022 Database, Table I.B1.7.57.
Between PISA 2018 and PISA 2022, disparities in mathematics performance shifted in favour of immigrant students in three countries (among countries with more than 5% of immigrant students in PISA 2022): Canada*, Kazakhstan and the United Kingdom* (Figure I.7.9).
In Kazakhstan, a gap in mathematics performance of nine points in favour of non-immigrants in PISA 2018 became non-significant in PISA 2022 due to the improved performance of immigrant students (no change among non-immigrants). In Canada* and the United Kingdom*, a significant decline in non-immigrant students’ performance coincided with no change in immigrant student performance between PISA 2018 and 2022. As a result, in the United Kingdom*, a gap of 14 points in favour of non-immigrant students in PISA 2018 narrowed into a statistically insignificant gap in 2022. In Canada*, the gap in mathematics performance in terms of immigrant background was not significant in PISA 2018 but immigrant students outperformed their non-immigrant peers in mathematics by 12 score points in PISA 2022.
In the same period, disparities in mathematics performance shifted in favour of non-immigrants only in Saudi Arabia. There, non-immigrant students’ performance improved and immigrant students did not change, and, as a result, the performance gap in favour of immigrant students narrowed by 15 score points. In all other countries/economies with comparable PISA data, the gap in mathematics performance by immigration background did not change between 2018 and 2022.
Notes: Statistically significant differences between PISA 2018 and PISA 2022 are shown in a darker tone (see Annex A3).
Countries/Economies where less than 5% of students have an immigrant background in 2022 are not represented in the figure.
Countries and economies are ranked in descending order of the difference in mathematics performance of immigrant students between 2018 and 2022.
Source: OECD, PISA 2022 Database, Table I.B1.7.19.
Figure I.7.10 displays trends in the immigration gap in mathematics performance since 2012 after accounting for socio-economic status and language spoken at home (i.e. “net” performance gap). These trends need to be interpreted in the context of changes in the amount and profile of the immigrant population of different countries/economies, as described above in sections about changes in the socio-economic status, language background and age of arrival of immigrant students.
Between PISA 2012 and 2022, the net performance gap in mathematics changed in ways that favoured immigrant students in the following countries/economies:
In four countries/economies (Belgium, Finland, Portugal and Spain), a very large net performance gap in favour of non-immigrant students in PISA 2012 narrowed. For example, in Belgium the net performance gap in mathematics in favour of non-immigrant students was 46 score points in PISA 2012 but 17 points in PISA 2022.
In four countries/economies (France, Greece, Italy and Switzerland), a very large net performance gap in favour of non-immigrant students in PISA 2012 narrowed so much that differences between immigrant and non-immigrant students became statistically insignificant in PISA 2022.
In Argentina, a net performance gap in favour of non-immigrant students in PISA 2012 shifted in favour of immigrant students in PISA 2022.
In Canada*, Kazakhstan and the United Kingdom*, a net performance gap that was not significant in PISA 2012 became a net performance gap in favour of immigrant students in PISA 2022.
In the United Arab Emirates, a very large net performance gap in favour of non-immigrant students in PISA 2012 became even larger in PISA 2022.
In Montenegro and Qatar, the net performance gap in mathematics changed between 2012 and 2022 in ways that favoured non-immigrant students. In the remaining 21 countries/economies shown in Figure I.7.10, the net performance gap in mathematics did not change between 2012 and 2022.
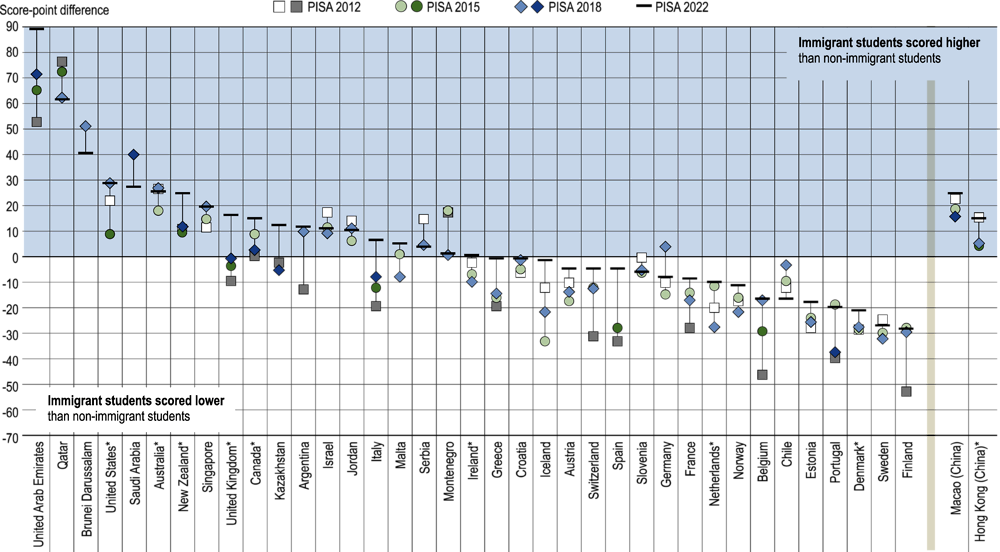
Notes: Statistically significant changes between PISA 2022 and previous cycles in the difference in mathematics performance between non-immigrant and immigrant students are shown in a darker tone (see Annex A3).
Countries/Economies where less than 5% of students have an immigrant background in 2022 are not represented in the figure.
Socio-economic status is measured by the PISA index of economic, social and cultural status.
Countries and economies are ranked in descending order of the score-point difference between immigrant and non-immigrant students in 2022.
Source: OECD, PISA 2022 Database, Table I.B1.7.53.
References
[6] Alarcón-Leiva, J. and C. Gotelli-Alvial (2021), “Migración de estudiantes internacionales a Chile: Desafíos de la nueva educación pública”, Education Policy Analysis Archives, Vol. 29/January - July, p. 68, https://doi.org/10.14507/epaa.29.6261.
[2] Buchmann, C. and E. Parrado (2006), “Educational achievement of immigrant-origin and native students: A comparative analysis informed by institutional theory”, International Perspectives on Education and Society, Vol. 7, pp. 335-366, https://doi.org/10.1016/s1479-3679(06)07014-9.
[1] Cerna, L., O. Brussino and C. Mezzanotte (2021), “The resilience of students with an immigrant background: An update with PISA 2018”, OECD Education Working Papers, No. 261, OECD Publishing, Paris, https://doi.org/10.1787/e119e91a-en.
[5] Feliciano, C. (2020), “Immigrant Selectivity Effects on Health, Labor Market, and Educational Outcomes”, Annual Review of Sociology, Vol. 46/1, pp. 315-334, https://doi.org/10.1146/annurev-soc-121919-054639.
[3] Marks, G. (2005), “Accounting for immigrant non-immigrant differences in reading and mathematics in twenty countries”, Ethnic and Racial Studies, Vol. 28/5, pp. 925-946, https://doi.org/10.1080/01419870500158943.
[7] Mera-Lemp, M., M. Bilbao and N. Basabe (2020), “School Satisfaction in Immigrant and Chilean Students: The Role of Prejudice and Cultural Self-Efficacy”, Frontiers in Psychology, Vol. 11, https://doi.org/10.3389/fpsyg.2020.613585.
[8] OECD (2022), International Migration Outlook 2022, OECD Publishing, Paris, https://doi.org/10.1787/30fe16d2-en.
[9] OECD (Forthcoming), PISA 2022 Technical Report, PISA, OECD Publishing, Paris.
[4] Portes, A. and M. Zhou (1993), “The New Second Generation: Segmented Assimilation and Its Variants”, The Annals of the American Academy of Political and Social Science, Vol. 530, pp. 74–96.
Notes
← 1. In sections examining student performance by immigration background, the focus on the chapter is mathematics and reading. Results for science are not discussed to avoid repetition but data tables with results for science are available in Annex B1.
← 2. Table I.B1.7.1 includes information about the statistical significance of the difference between first-generation and second-generation immigrant students.
← 3. In the following sections, the figures show results only for the 42 countries/economies (out of 81 with available data) where more than 5% of students have an immigrant background. This restriction ensures sample sizes robust enough to disaggregate the data not only by immigration background but also by socio-economic status, language spoken a home and age of arrival at the country of assessment. Also, this restriction serves to focus the analysis on educational systems where learning disparities by immigration background affect a larger share of the population. Estimates are available for all countries in online tables included in Annex B1.
← 4. Student socio-economic status in PISA is measured through the PISA index of Economic, Social and Cultural Status (ESCS). Lower values in the index signal lower socio-economic standing and higher values signal higher socio-economic standing. Socio-economically disadvantaged students are defined as students in the bottom quarter of the distribution of ESCS in their countries/economies. Socio-economically advantaged students are defined as students in the top quarter of ESCS in their countries/economies.
← 5. Insufficient experience in the language of assessment is one of the criteria allowed by PISA for exclusion of students within sampled schools. More specifically, exclusion is allowed for the following group: “Students with insufficient experience in the language of assessment: these are students who need to meet all of the following criteria: i) are not native speakers of the assessment language(s), ii) have limited proficiency in the assessment language(s), and iii) have received less than one year of instruction in the assessment language(s)” (OECD, Forthcoming[9]). Efforts were made to ensure that exclusions, if they were necessary, were minimised according to the PISA Technical Standards. Thus, when interpreting results in this section, consider that countries/economies can exclude from the PISA sample students who do not speak language of assessment at home if they meet the criteria described above.
← 6. For more information about immigration trends and policies in Chile, see Alarcón-Leiva and Gotelli-Alvial (2021[6]), Mera-Lemp, Bilbao and Basabe (2020[7]) and OECD (2022[8]).
← 7. The relationship between national income (as measured by per capita GDP) and student performance is examined in chapter 4. Countries with higher national incomes tend to score higher in PISA; the relationship is not linear and it flattens at higher levels of per capita GDP (see Figure I.4.13).
← 8. Across 81 countries/economies that took part in PISA 2022, the correlation between share of immigrant students and per capita GDP is positive and strong (r = 0.72). To ensure that outliers were not driving the findings, the correlation was conducted again without countries where the share of immigrant students is much higher than that of all other PISA-participating countries/economies (Macao [China], Qatar and the United Arab Emirates). Across the 78 countries/economies where the share of immigrant students is lower than 40%, the correlation coefficient between the share of immigrant students and per capita GDP is similar (correlation coefficient = 0.69). Source: OECD, PISA 2022 Database, Tables I.B1.7.1 and I.B3.2.1.
← 9. The partial correlation coefficient between the share of immigrant students and mean performance in mathematics after accounting for per capita GDP is negative and weak (r = -0.15) across the 81 countries/economies that took part in PISA 2022. However, correlation is driven by the three countries where the share of immigrant students is much higher than that of all other PISA-participating countries/economies (Macao [China], Qatar and the United Arab Emirates). Across the 78 countries/economies where the share of immigrant students is lower than 40%, the partial correlation coefficient between the share of immigrant students and mean performance in mathematics after accounting for per capita GDP is close to zero (r = -0.02). Source: OECD, PISA 2022 Database, Tables I.B1.2.1, I.B1.7.1. and I.B3.2.1.