This chapter analyses different aspects that can impact student achievement and attitudes towards learning, both inside and outside of school. These include school resources, students’ relationships with teachers and families, and school climate, as reported in PISA 2025. School resources mainly focus on digital resources and student use of AI for schoolwork, while human, material and time-related resources available for learning are also covered. Relationships with teachers and families are analysed through support from teachers, parents or guardians for student learning, and the involvement of parents or guardians in school activities. School climate is examined through three key dimensions: disciplinary climate, bullying and cyberbullying, and school attendance and truancy. The chapter also explores changes over time in these dimensions of school and home life, where trend data are available, and their associations with student performance and attitudes towards learning.
PISA 2025 Results (Volume I)

Abstract
School resources
PISA 2025 data shed light on how students' learning outcomes are related to school resources, policies and practices, including the use of digital devices and tools such as artificial intelligence (AI) chatbots, and homework supports.
Digital resources
School principals’ concerns about the shortage of digital resources slightly decreased compared to 2022, on average across OECD countries, consistent with the continued increase in computer availability observed in 31 education systems with available data.
Using digital devices to enhance teaching and learning continues to be a challenge, as principals in OECD countries reported lower levels of preparedness for digital learning than in 2022. This partially reverses the improvements observed between 2018 and 2022.
Student use of digital tools
Time spent using digital devices both inside and out of school has slightly declined since 2022. On average across OECD countries, students reported spending 1.7 hours per day using digital devices at school for learning activities and 1.1 hours per day for leisure while at school.
Moderate use of digital devices for learning at school is associated with higher science performance than both no use and very high use, on average across OECD countries. However, use for leisure at school for longer than one hour per day is consistently associated with lower science performance.
Using digital devices during lesson time can distract students from learning without appropriate management. On average across OECD countries, 28% of students reported that their peers are distracted by the use of digital devices during most or every science lesson. In B-S-J-Z (China), Japan and Korea, fewer than 10% of students reported such distraction. Students who reported using digital devices more frequently in their lessons are more likely to report digital distraction in their lessons.
Schools implementing cell phone bans or subject-specific guidelines on the use of digital devices in school tend to show lower levels of distraction by digital devices in science lessons and less time spent on digital devices for leisure at school. However, the relationship between these policies and science performance is unclear: students enrolled in schools with such policies tend to have similar or lower scores in science than their peers in most countries and economies.
The use of AI for schoolwork is widespread in most countries and economies, but regular use (i.e. almost daily) was reported by only one out of five students on average across OECD countries.
The relationship of AI use with science performance is complex: non-users of AI chatbots for specific schoolwork tasks outperform their peers in most countries and economies. AI use for a more general purpose, to help students learn, shows a slightly different pattern, with weekly users performing at a similar level to non-users on average across OECD countries.
Schools can help students use AI more critically, but such learning opportunities are not equally distributed. Students who frequently use AI for learning and who learn to assess the quality of AI-generated information at school achieve slightly higher science performance than non- or infrequent users. However, such learning opportunities are reported more frequently by socio-economically advantaged students, raising concerns about a possible new divide in access to critical engagement with AI.
Human and material resources
Improvements in teacher shortages and student-to-teacher ratios have been reported by school principals compared to 2022 on average across OECD countries. However, teacher shortages remain a challenge, with school principals reporting higher concern than in 2018 in most countries and economies.
In contrast, school principals report higher concern about material shortages and shortages of assisting staff. This partly offsets improvements in material shortages reported between 2018 and 2022.
Homework and study help
Students in 2025 report spending around 1.4 hours per day on their homework, on average across OECD countries, marking a 11% relative decline compared to 2022. While the relationship between homework and science performance is not linear, more time spent on homework is associated with higher levels of curiosity, perseverance and goal setting.
The provision of study help, such as providing students access to a space to complete homework and peer-to-peer tutoring are associated with higher science performance on average across OECD countries.
Relationships with teachers and families
Students reported that they receive more teacher support in science lessons compared to 2015 in about half of countries/economies with available data. Teacher support remains consistently positively associated with science performance and attitudes towards learning in most education systems.
Students reported less family support compared to 2022 in almost all countries and economies with available data. This declining trend is particularly observed among boys and disadvantaged students. Family support improved nonetheless in Estonia, Poland, Viet Nam and Iceland.
Consistent positive relationships between family support and students’ science performance appear driven by parents’ or guardians’ interest in students’ day-to-day learning.
School climate
Disciplinary climate in science lessons also improved between 2015 and 2025, on average across OECD countries and in 37 countries/economies. Countries and economies with an improved disciplinary climate tend to show stability or an increase in their average science performance compared to 2015.
Across OECD countries and in most participating education systems, bullying is associated with lower student performance and sense of belonging even after accounting for students’ and schools’ socio‑economic profile. Cyberbullying is relatively rare (3% of students, on average across OECD countries) but is linked to the largest performance gaps: victims scored 59 points lower in science than their peers on average and 48 points lower after accounting for socio‑economic profile.
Students reported slightly more truancy and lateness, on average across OECD countries, compared to 2018 (+0.6 percentage point in whole-day school skipping, +2 percentage points in lateness), reverting the positive trends observed in 2022. Both truancy and lateness continue to be substantially negatively associated with science performance and attitudes towards learning.
Student achievement and attitudes towards learning are shaped by many factors, including family and personal background, as well as the resources available in schools and the quality of learning environments. Learning does not happen in a vacuum, which is why it is essential to examine factors within students’ school and home lives.
Adequate resources are a necessary condition for high-quality instruction, while supportive families and teachers, and an orderly and well-organised school climate help students make the most of these resources. Conversely, shortages of key resources, lack of supportive relationships with teachers and families or unfavourable learning conditions with high levels of bullying and truancy can constrain schools’ capacity to support student learning and exacerbate existing inequalities.
This chapter reviews the resources available to schools in 2025, based on responses from students and school principals to the PISA 2025 questionnaires, focusing on digital, human, material and time-related resources. The chapter also considers whether these resources are perceived as sufficient to provide high-quality instruction and equitable learning opportunities for all students, and explores the ways in which students use digital tools for learning and leisure. It then analyses key aspects of relationships with teachers and families and school climate, including teacher support for student learning, parental involvement, disciplinary climate, bullying and cyberbullying, and student attendance and truancy.1 The chapter examines the relationship between these aspects and students’ science performance in PISA 2025, as well as student attitudes towards learning.
Table I.4.1 summarises key relationships between school resources, relationships with teachers and families and school climate, and student science performance and attitudes towards learning, after accounting for schools’ and students’ socio-economic profile.
Relationship between selected measures of student learning and indicators of school resources and learning environment, after accounting for students' and schools' socio-economic profile1; OECD average
1. The socio-economic profile is measured by the PISA index of economic, social and cultural status (ESCS).
The number of countries and economies showing relationships similar to that observed for the OECD average is indicated within each cell (see Annex A3).
 Positive association observed on average across OECD countries and in N systems.
 Negative association observed on average across OECD countries and in N systems.
 No association observed on average across OECD countries.
Source: OECD, PISA 2025 Database, Chapter 4.
How financial resources are allocated and used within education systems matters as much as overall levels of investment. Quality of education and student performance will not simply be improved directly as a result of high investment. Previous PISA reports have shown that spending more per student is associated with higher performance, but only to a certain point (OECD, 2012[1]; OECD, 2023[2]). At the system level, PISA 2025 data show a clear positive association between student performance and expenditure on education per student, up to a certain threshold (Figure I.1.3, Chapter 1). This relationship is nonetheless far from deterministic. Above USD 85 000 per student, a higher level of spending is not automatically associated with a higher average score in science performance.
PISA 2025 collected new and trend measures of school-level resources to help contextualise student outcomes within and across education systems. Trend measures refer to variables that have been included in previous PISA cycles and therefore allow for the monitoring of changes over time, while new measures capture emerging aspects not previously assessed, such as students’ AI usage.
Digital resources
Digitalisation is one of the major forces shaping today’s world. In education, it has led to a steady increase in the availability and use of digital resources in schools.2 While digital resources can open up new learning opportunities, increasing access alone is not enough. Policies need to support schools’ capacity to integrate digital tools into teaching in effective and meaningful ways. A PISA report published over a decade ago already found no differences in student performance linked to greater access to digital devices and highlighted the importance of effective use (OECD, 2015[3]). Since then, the rapid increase in use of smartphones, digital devices and social media among young people has created additional policy challenges, including managing distraction in the classroom, curbing plagiarism and addressing risks related to student safety in the digital environment. More recently, the widespread availability and use of artificial intelligence (AI) have created additional opportunities and challenges for instruction and learning.
Availability and perceived shortages of digital resources
The availability of computers in school3 has increased steadily, from six computers per ten students in 2012 to nine per ten students in 2025, on average across OECD countries (Table I.B1.4.2). An increase in the availability of computers in school between 2012 and 2025 is observable for most countries and economies with available data for both cycles, although six of them experienced a decline over this period. Between 2022 and 2025, availability rose in 31 of 75 countries and economies with comparable data, although ten recorded declines. Despite this overall rise, access remains uneven, with systematic differences across contexts.4
Availability of specific types of digital devices varies. Computers remain the most widely available digital device in schools, while the availability of tablet devices and e-book readers is much more limited, suggesting that digital reading devices play a more marginal role in most education systems. In 2025, schools reported around three tablets and less than one e-book per ten students on average across OECD countries (Tables I.B1.4.4 and I.B1.4.5).
Despite their growing availability, principals in many schools report shortages in terms of both quantity and quality of digital resources that hinder the school’s capacity to provide instruction (Figure I.4.1). This is especially prevalent in countries with lower levels of income.5 Perceived shortages are also more pronounced in public schools and socio‑economically disadvantaged schools6 (Table I.B1.4.7). Ensuring the provision not only of digital resources, but high-quality digital resources that are fit for purpose is essential in reducing digital inequalities that risk reinforcing social and educational inequalities (Gottschalk and Weise, 2023[4]).
On average across OECD countries, the overall level of perceived shortages in digital resources declined marginally (by 1 percentage point) between 2022 and 2025 (Table I.B1.4.9) and there is much variation across countries/economies. On the one hand, six countries and economies (Mongolia, Montenegro, Uzbekistan, Greece, Kosovo and the Ukrainian regions (17 of 27)) recorded reductions in shortages by over 20 percentage points or more. On the other hand, four OECD countries (New Zealand*, Türkiye, Canada* and Ireland) saw an increase in principal-reported shortages of between 8 and 17 percentage points.
Percentage of students enrolled in schools whose principal reported that a lack of digital resources or inadequate or poor-quality digital resources hindered the school’s capacity to provide instruction to some extent or a lot

Note: Countries and economies are ranked in descending order of the percentage of students enrolled in schools whose principal reported that a lack of digital resources hindered the school’s capacity to provide instruction to some extent or a lot.
Source: OECD, PISA 2025 Database, Table I.B1.4.6. See https://stat.link/o1j4k0 for the underlying data.
Shortages of digital resources are associated with lower student performance in science; however, this association is largely accounted for by socio-economic disparities (Table I.4.2). The relationship between shortages of digital resources and performance in computational problem‑solving follows a similar pattern, observed in many countries, with sizeable score-point differences that can be accounted for by socio-economic disparities (Table I.B1.4.10). The availability of digital resources for teaching staff – measured by the number of Internet‑connected computers available per teacher7 – also shows no clear association with students’ science performance (Table I.B1.4.13).
At the system level, across all countries and economies, a larger proportion of students enrolled in schools reporting shortages of digital resources tend to have lower average performance scores in science, even after accounting for GDP per capita (Table I.4.2). This indicates that, beyond national income levels, the prevalence of digital shortages within school systems is associated with lower performance scores.
1. ESCS refers to the PISA index of economic, social and cultural status.
2. Number of education systems in which the association is statistically significant.
Correlation coefficients indicated in bold are statistically significant (see Annex A3).
Positive association.
Negative association.
 No association.
Source: OECD, PISA 2025 Database, Tables I.B1.4.3, I.B1.4.10 and I.B1.4.187. See https://stat.link/o1j4k0 for the underlying data.
School capacity to enhance teaching and learning using digital devices
Translating digitalisation into better outcomes requires that schools incorporate digital resources effectively into teaching and learning. PISA 2025 asked school principals whether their school has the capacity to enhance teaching and learning using digital devices, in terms of device availability, skills and time.8
School principals in 2025 reported lower levels of preparedness for digital learning than in 2022, on average across OECD countries and in about half of education systems with available data (Table I.B1.4.16). This decline possibly reflects post-pandemic reassessments of what constitutes effective tools for digital learning, as well as shifting investment and learning priorities in some contexts (Zancajo, Verger and Bolea, 2022[5]). Generative AI, which began to spread widely around 2022, may also have contributed to this trend as it poses additional challenges for teachers regarding training, skills, confidence and reluctance to incorporate these tools into their practice (OECD, 2025[6]).
Between 2018 and 2025, changes across the different measured dimensions of school capacity to enhance teaching and learning by using digital devices do not show consistent patterns, as shown in Figure I.4.2. The dimension that declined in the largest number of countries and economies between 2022 and 2025 was teacher skills in integrating digital devices into instruction, although this remains higher than the levels reported in 2018 in most systems with available data (Table I.B1.4.17). In a few countries and economies (including Iceland, the Netherlands*, Thailand, Hong Kong (China), Sweden and Switzerland), a decline in this dimension was not observed, with over 80% of students enrolled in schools where principals reported their teachers have the necessary skills to integrate digital devices into instruction (Tables I.B1.4.14 and I.B1.4.17). In those countries/economies, increases were observed between 2018 and 2022 that levelled off between 2022 and 2025, except for Iceland, which continued to increase over the latter period.
Trends in principals’ reporting that teachers have sufficient time to prepare lessons integrating digital devices varied widely, with increases in 10 systems and declines in 16 since 2022. This indicates greater cross-national variability than in other aspects of school digital capacity.
Percentage of students in schools whose principal reported to agree or strongly agree with the following; OECD average

Note: All differences between PISA 2025 and earlier cycles for each category are statistically significant (see Annex A3).
Source: OECD, PISA 2025 Database, Table I.B1.4.17. See https://stat.link/o1j4k0 for the underlying data.
Disparities in school capacity to enhance teaching and learning using digital resources remain pronounced. In most countries and economies, principals in schools with more socio-economically advantaged students reported higher levels of preparedness for digital instruction than those in schools serving disadvantaged populations (Table I.B1.4.15). These gaps may limit the potential of digitalisation to reduce educational inequalities and, in some cases, risk reinforcing existing disparities.
In many education systems, a higher level of preparedness for digital learning shows a positive association with students’ science performance. However, these differences are not observed after accounting for students’ and schools’ socio-economic profile (Table I.B1.4.18). Further research and targeted policies are essential to reduce socio-economic disparities in schools’ digital preparedness for teaching and learning and prevent widening gaps in student performance.
At the system level, greater preparedness of schools for digital learning is associated with higher average scores in science, mathematics and reading (Table I.B1.4.187). After accounting for per capita GDP, cross-country differences in preparedness for digital learning account for about 14% of the variation in mean science performance across all countries and economies. Well‑prepared schools may play an important role by shaping the quality, coherence and pedagogical use of digital tools, thereby creating more favourable conditions for students to develop effective digital learning practices.
Beyond academic performance, school preparedness for digital learning shows little association with students’ attitudes towards learning, with no relationships observed in most participating countries and economies (Table I.B1.4.20).
Students’ use of digital resources
On average across OECD countries, students spend about 6 hours per day on weekdays and 5 hours per day on weekends using digital devices, for both academic and leisure purposes. Time spent on digital devices varies widely across systems, ranging from less than 4 hours to more than 12 hours per weekday, and from less than 3 hours to around 7 hours per weekend day (Table I.B1.4.21).
Students tend to spend more time using digital devices for leisure than for learning throughout the week. On average across OECD countries, students use digital devices around 3.4 hours per day on leisure activities both on weekdays and weekends (Table I.B1.4.21). In comparison, students use these devices for learning for close to 3 hours per weekday, including 1.2 hours before and after school, and for 1.4 hours per day on weekends.
Learning activities account for a substantial, though not exclusive, share of students’ device use during the school day. On average across OECD countries, students reported spending 1.7 hours per day using digital devices at school for learning activities and 1.1 hours per day for leisure while at school (Table I.B1.4.21). The amount of time spent using digital devices for learning at school varied substantially across countries/economies, ranging from 0.9 hours per day in Guatemala to 3.2 hours per day in Denmark, Iceland and Rwanda. Leisure-related use while at school also varied widely, ranging from 0.4 hours per day in Japan to 2.9 hours per day in Rwanda.
Time spent using digital devices at school declined moderately between 2022 and 2025 in most countries and economies, reflecting a shift towards shorter use during the school day (less than one hour per day) or no use at all (Figure I.4.3 and Table I.B1.4.29). This decline might be interpreted under the lens of several factors, including post-pandemic reassessment of the use of digital devices for learning, school policies restricting the use of digital devices, or a more general trend of decreased use (Box I.4.1). It could also reflect patterns indicating that children’s digital lives are increasingly embedded in their everyday activities, suggesting the distinction between “digital” and “offline” time is less relevant (Staksrud, Livingstone and Ólafsson, 2026[7]).
Percentage-point difference (PISA 2025 - PISA 2022) of students reporting to spend more than 1 hour per day using digital devices at school for learning and for leisure activities

Notes: Percentage-point differences that are statistically significant are shown in a darker tone (see Annex A3).
Countries and economies are ranked in descending order of the change in the percentage of students reporting to spend more than 1 hour per day using digital devices at school for learning.
Source: OECD, PISA 2025 Database, Table I.B1.4.30. See https://stat.link/o1j4k0 for the underlying data.
Students in 2025 reported spending less time on digital devices outside of school on average across OECD countries compared to 2022, both for learning1 and leisure purposes (Table I.B1.4.29). The share of students spending more than two hours per day using digital devices on leisure activities on weekdays, before and after school, and on weekends declined by 6 percentage points.
Between 2022 and 2025, some of the largest reductions in time spent using digital devices for leisure were seen in more intensive users. On average, the proportion of students spending over 7 hours per day on digital leisure activities on weekends decreased by 3.6 percentage points, and those spending 5-7 hours decreased by 2.4 percentage points. The reduction in higher levels of use may be promising for outcomes related to well-being and performance.2
A redistribution of time across digital leisure activities
PISA 2025 data provide granular results which help interpret the observed trends described in the previous section.
What students do in the digital environment, and how much time they spend doing it, has shifted since 2022 (Figure I.4.4). On the one hand, there has been an increase in the share of students reporting that they use digital devices for more than one hour a day to browse social networks, both on weekdays and weekends, or play video games on weekdays (Tables I.B1.4.39 and I.B1.4.42). The share of extensive users (more than 5 hours per day) of video games showed a slight decrease of less than 2 percentage points on weekdays and weekends (Tables I.B1.4.38 and I.B1.4.41). On the other hand, there was also a higher proportion of students reporting limited or no use of devices for certain things such as informational activities (e.g. looking for practical information online) and creative activities (e.g. creating digital content).
In summary, the reduction in overall digital leisure time outside of school appears to be driven by reduced engagement in creative activities and in seeking practical or entertaining information, while time spent on social media has increased.
Percentage-point difference (PISA 2025 - PISA 2022) of students who spent more than one hour per day, on weekdays or weekends, doing the following digital activities; OECD average-21

Notes: Percentage-point differences that are statistically significant are shown in a darker tone (see Annex A3).
OECD average-21 refers to the arithmetic mean across the 21 OECD countries with available data.
Source: OECD, PISA 2025 Database, Tables I.B1.4.39 and I.B1.4.42. See https://stat.link/o1j4k0 for the underlying data.
1. The share of students spending more than one hour per day using digital devices on learning activities on weekdays (before and after school) and weekends declined, by about 8 and 3 percentage points respectively (Table I.B1.4.29). Observed in many systems, this shift possibly reflects the decrease of digital resources use at school for learning activities or post-pandemic shift from online teaching or learning platforms.
2. Such high levels of engagement with digital devices can have implications for subjective variations in psychosocial functioning (Przybylski, Orben and Weinstein, 2020[24]). Similar findings were noted in PISA 2022 with regards to students’ learning outcomes and sense of belonging at school. Over 4 hours spent on digital leisure activities outside of school was associated with a decline in mathematics scores and sense of belonging, while moderate use was related to more positive outcomes on both measures than no use and very high use (OECD, 2025[25]).
The association between science performance and the time spent using digital devices at school is shown in Figure I.4.5. and Figure I.4.6. Taken together, they show that the association differs markedly by the purpose of use. Limited or moderate use (up to 5 hours a day) of digital devices for learning activities is associated with higher scores in science than non-use or high use. The lower performance observed among non-users of digital devices for learning at school may reflect underlying factors independent of student socio-economic profile, such as higher school-level shortages of digital devices or lower school preparedness for digital learning.
Use of digital devices for leisure at school past a certain threshold is associated with lower science performance.9 In contrast to learning-related use, this threshold appears lower. On average across OECD countries, science scores are highest among students who use devices for leisure at school for up to one hour per day. After the one-hour threshold, the longer students reported to use digital devices for leisure at school, the lower they scored in science performance (Table I.B1.4.35).10 These students may be using digital devices beyond recess time or time allowed to use them for leisure. Balancing the use of digital tools with educational and other health-supporting activities is key to ensuring that technology enhances students’ learning rather than distracts from it.
These results underscore the need for clearer guidance on the effective use of digital devices in schools and measures to balance students’ digital engagement outside of school with other activities. They also emphasise that students’ use of digital tools requires a nuanced understanding of the intention and timing of use, as these factors together have implications for student performance.
Based on students' reports; OECD average

Notes: Mean scores adjusted for socio-economic status are predicted science scores estimated from a regression of science performance on the daily time spent using digital devices for learning at school, after accounting for students’ socio-economic status.
The percentages in parentheses under each horizontal-axis category indicate the percentage of students who reported using digital devices for learning activities at school for that amount of time, on average across OECD countries (e.g. 17% reported no use; 33% reported up to 1 hour).
Source: OECD, PISA 2025 Database, Tables I.B1.4.21 and I.B1.4.33. See https://stat.link/o1j4k0 for the underlying data.
Based on students' reports; OECD average

Notes: Mean scores adjusted for socio-economic status are predicted science scores estimated from a regression of science performance on daily time spent using digital devices for leisure at school, after accounting for students’ socio-economic status.
The percentages in parentheses under each horizontal-axis category indicate the percentage of students who reported using digital devices for leisure at school for that amount of time, on average across OECD countries (e.g. 36% reported no use; 33% reported up to 1 hour).
Source: OECD, PISA 2025 Database, Tables I.B1.4.21 and I.B1.4.35. See https://stat.link/o1j4k0 for the underlying data.
Beyond academic performance, total time spent using digital devices – including time spent both at school and outside of school hours, including weekends, for either learning or leisure purposes – is only weakly associated with students’ attitudes towards learning, with patterns varying across dimensions measured (Table I.B1.4.36). An additional hour of digital device use per week is associated with slightly higher levels of curiosity and goal setting, both before and after accounting for students’ and schools’ socio‑economic profile. It is also associated with slightly lower levels of sense of belonging at school, and – after adjustment – help seeking and perseverance.
Digital distraction in science lessons
Digital distraction has become a prominent concern at school. On average across OECD countries in 2025, 28% of students reported that their peers are distracted by the use of digital devices and tools such as smartphones, websites and applications, during most or every science lesson (Figure I.4.7).
In most countries and economies, levels of digital distraction in science lessons are broadly similar across schools with different socio-economic profiles. On average across OECD countries, however, the share of students reporting digital distraction during science lessons is higher in disadvantaged schools (31%) than in advantaged schools (26%; Table I.B1.4.43). This pattern is observed in 32 countries and economies. By contrast, in 9 countries and economies, students in advantaged schools report higher levels of digital distraction.
PISA 2022 documented comparable patterns in mathematics lessons: 30% of students reported that classmates get distracted by using digital devices in every lesson or in most lessons (OECD, 2023[8]). Although the two indicators are not directly comparable – since the 2025 measure refers to science classes and the 2022 measure to mathematics – they nonetheless suggest that managing students’ use of digital devices in the classroom continues to be a major challenge.
Percentage of students who reported that students get distracted by using digital devices in most or every science lesson

Note: Countries and economies are ranked in descending order of the percentage of students who reported that students get distracted by using digital devices in most or every science lesson.
Source: OECD, PISA 2025 Database, Table I.B1.4.43. See https://stat.link/o1j4k0 for the underlying data.
Higher levels of distraction in science lessons are associated with lower science performance in more than two-thirds of participating countries and economies with available data (Figure I.4.8). These patterns may reflect the reduced effective learning time and the cognitive costs of divided attention: exposure to interruptions or competing stimuli, whether digital or otherwise, can impair students’ ability to follow instruction, retain information and engage in scientific reasoning.
However, the relationships between digital distraction and performance are not uniform across countries and economies. In three countries and economies, a positive association is observed after accounting for socio-economic profile, with students who report frequent digital distraction in their science lessons achieving higher scores in science. This pattern may arise in classrooms in which digital tools are more frequently used for instructional purposes, creating both greater opportunities for learning and greater potential for off‑task behaviour. It might also reflect learning environments where academically stronger or more confident students engage more often with devices, either for class‑related tasks or for multi-tasking. These cross‑country differences suggest that the relationship between digital distractions and student performance depends critically on the quality of technology integration, the structure of classroom activities, and the degree of pedagogical guidance provided by teachers.
Change in science performance when students reported that students get distracted by using digital resources in most or every science lesson

1. The socio-economic profile is measured by the PISA index of economic, social and cultural status (ESCS).
Statistically significant values are shown in a darker tone (see Annex A3).
Countries and economies are ranked in descending order of the score-point difference in science, after accounting for students’ and schools’ socio-economic profile.
Source: OECD, PISA 2025 Database, Table I.B1.4.44. See https://stat.link/o1j4k0 for the underlying data.
Beyond academic performance, digital distraction in science lessons is consistently associated with less positive attitudes towards learning (Table I.B1.4.45). In most countries and economies participating in PISA, students who reported that classmates get distracted by using digital devices in most or every science lesson show lower levels of key positive attitudinal outcomes, most noticeably, sense of belonging at school.11 The direction of this relationship however is unclear, and these results could suggest that students with a lower sense of belonging at school are more likely to succumb to digital distraction, that digital distraction has implications for sense of belonging, or that these could be reinforcing one another to some extent.
Digital distraction is greater among students who report higher use of digital devices during lessons. On average across countries, and after accounting for students’ and schools’ socio‑economic profile, students who report more frequent use of digital devices in science lessons are more likely to report digital distraction, with the highest likelihood observed when digital resources are used in every or almost every lesson (Figure I.4.9).
Change in the likelihood of frequent digital distraction during science lessons, by use of digital devices in science lessons; OECD average

Notes: Values that are statistically significant are shown in a darker tone (see Annex A3).
The reference group comprises students who reported that they never or almost never use digital resources in their school science lessons. The odds ratios represent the relative likelihood that students reported digital distraction in most or every science lesson, according to how frequently they reported using digital devices in science lessons, compared with students who reported never or almost never using them. Significant values above (below) 1 indicate that students are more (less) likely to report digital distraction in most or every science lesson than those in the reference group (see Annex A3). The odds ratios are estimated after accounting for students’ and schools’ socio‑economic profile. The socio‑economic profile is measured using the PISA index of economic, social and cultural status (ESCS).
Source: OECD, PISA 2025 Database, Table I.B1.4.46. See https://stat.link/o1j4k0 for the underlying data.
School policies play a role in shaping students’ use of digital devices. Across participating education systems, schools have introduced a range of measures such as guidelines regulating the use of smartphones and other digital devices during lessons and on school premises. PISA 2025 results show that some policies are associated with lower levels of digital distraction in science lessons.
Across OECD countries, most students attend schools that have some form of policy or practice regulating the use of digital devices, and the prevalence of such policies has increased since PISA 2022 (Tables I.B1.4.47 and I.B1.4.48). In particular, restrictions on cell phone use have expanded markedly, with nearly half of students on average across OECD countries now enrolled in schools where cell phone use is not allowed on school premises, up from 34% in 2022. At the same time, 71% of students attend schools with formal, subject‑specific guidelines for the pedagogical use of digital devices, a share that has increased by 4 percentage points since 2022. By contrast, other approaches – such as collaborative rule‑setting with students or programmes related to responsible Internet behaviour – have, in some cases, become less prevalent.
Cell phone bans and subject-specific policies are closely interrelated at the school level. Schools applying one of these policies tend to have the other policy as well (Table I.B1.4.49). Between 2022 and 2025, schools typically adopted cell phone bans along with subject-specific guidelines, rather than just implementing a ban. On average across OECD countries, the share of students enrolled in schools implementing both policies increased by 13 percentage points between 2022 and 2025, while the share enrolled in schools with only cell phone bans increased by 3 percentage points. In comparison, the share of students enrolled in schools implementing only subject-specific guidelines declined by 9 percentage points, and the share enrolled in schools with neither policy declined by 7 percentage points (Table I.B1.4.49).
On average across OECD countries, after accounting for students’ and schools’ socio‑economic profile, students are less likely to report that classmates get distracted by digital devices in schools where cell phone use is not allowed on school premises, and in schools that have formal, subject‑specific guidelines for the use of digital devices in teaching and learning (Figure I.4.10). Lower levels of digital distraction were reported by those students who are in schools with cell phone bans, with or without subject-specific guidelines (OECD average: 27% for distraction), than those in schools with only subject-specific guidelines (OECD average: 29%) or no policies (OECD average 32%; Table I.B1.4.52).
Other commonly reported school policies – such as general statements on digital device use, classroom rules established by teachers (with or without student input), or programmes related to responsible Internet behaviour, social media use, or teacher collaboration – show no clear association with lower levels of reported digital distraction at the student level (Figure I.4.10).
At the system level, after accounting for per capita GDP, countries and economies with a higher share of students enrolled in schools with cell phone bans, as well as those with a higher share of students enrolled in schools with formal and subject-specific guidelines, tend to report lower levels of digital distraction (Table I.B1.4.186). The correlation is stronger for cell phone bans than for formal and subject-specific guidelines.
Cell phone bans may also have implications for the time students spend on digital leisure activities during the school day. At the system level, the increased proportion of students in schools with cell phone bans between 2022 and 2025 is associated with an increase in the percentage of students spending 1 hour per day or less using digital devices for leisure at school (Table I.B1.4.186).12 This suggests that cell phone bans may partially explain the increase in the share of students who spend lower amounts of time on digital leisure activities at school.
Change in the likelihood of student distraction during science lessons, by school policies on the use of digital devices; OECD average

Notes: Values that are statistically significant are shown in a darker tone (see Annex A3).
For each school policy on the use of digital devices, the reference group corresponds to students in schools where the policy is not implemented, according to principals' reports. The odds ratios represent the relative likelihood that students reported digital distraction in most or every science lesson, according to whether they are enrolled in a school implementing a specific policy, compared with students enrolled in schools where the policy is not implemented. Significant values above (below) 1 indicate that students are more (less) likely to report digital distraction in most or every science lesson than those in the reference group (see Annex A3). Odds ratios are calculated after accounting for students’ and schools’ socio‑economic profile. The socio‑economic profile is measured using the PISA index of economic, social and cultural status (ESCS).
Source: OECD, PISA 2025 Database, Table I.B1.4.51. See https://stat.link/o1j4k0 for the underlying data.
Changes since 2022 in cell phone bans are, however, not associated at the system level with changes in average science or reading performance (Tables I.4.3 and I.B1.4.189). In 2025, countries and economies where cell phone bans were more prevalent tended to have lower average science performance (Table I.B1.4.187). The PISA data do not allow for causal inference and therefore do not necessarily indicate that the bans themselves lead to lower performance. Rather, the findings may suggest that systems with lower performance are more likely to have introduced such bans as mitigation measures.
1. ESCS refers to the PISA index of economic, social and cultural status
2. Number of education systems in which the association is statistically significant.
Correlation coefficients indicated in bold are statistically significant (see Annex A3).
Positive association.
Negative association.
No association.
Source: OECD, PISA 2025 Database, Tables I.B1.4.50, I.B1.4.187 and I.B1.4.189. See https://stat.link/o1j4k0 for the underlying data.
Students’ use of artificial intelligence for schoolwork
The rapid development of artificial intelligence (AI) tools, such as chatbots, has created new opportunities and new challenges for education systems. AI chatbots differ from other digital resources analysed in this chapter in that they became available to the public only in late 2022 and their use has expanded across regions and languages since then (Loh, 2023[9]).
PISA results presented in this section show that by 2025, AI chatbots (such as ChatGPT) were used for schoolwork by a majority of students in most participating countries and economies. However, frequency of use remains differentiated across students and contexts, and in some countries and economies their use remains limited.
PISA shows that students who do not use AI chatbots for schoolwork generally score higher than students who do, and are more likely to report higher levels of help-seeking behaviours, suggesting that AI use is not a prerequisite for success, at least at the time of PISA 2025. However, among students who use AI for schoolwork for a general purpose (“to help me learn”), those who report moderate use score slightly higher in PISA than students who use it either rarely or intensively. This pattern mirrors the broader finding on the relationship between performance and time spent using digital devices for learning activities at school. It also reflects the notion that digital tools can support learning when used purposefully and in moderation, whereas excessive or unguided use can lead to distraction and shallower engagement, ultimately negatively affecting learning outcomes.
In 2025, PISA collected information on how frequently students use AI-based chatbots in their schoolwork for different purposes. These include specific academic tasks such as summarising assigned reading texts, conducting preliminary research, and drafting writing assignments, as well as a variety of other purposes captured under the general label: “to help me learn”. On average across OECD countries, “to help me learn” is the most commonly reported purpose for using AI, followed by “to conduct preliminary research on a new topic”, “to draft text for written assignments” and “to summarise a text I had to read” (Figure I.4.11, and country-level Figures I.4.o1 to I.4.o4 online).
Percentage of students who reported using AI chatbots (e.g. ChatGPT) for their schoolwork to carry out the following activities; OECD average

Source: OECD, PISA 2025 Database, Table I.B1.4.53. See https://stat.link/o1j4k0 for the underlying data.
The use of AI for schoolwork is widespread in most countries and economies (Figure I.4.12), yet almost-daily use remains relatively uncommon (Table I.B1.4.53). On average across OECD countries, 14% of students reported never (or almost never) having used AI for any of the schoolwork-related purposes examined in PISA (Table I.B1.4.55). In 20 countries and economies, a majority of students reported that they never (or almost never) or only about once or twice a year used AI to summarise assigned reading texts (Table I.B1.4.53). Similarly, in 20 countries and economies, more than half of students reported they use AI once or twice a year or less to draft written assignments.
Percentage of students reporting to never or almost never have used AI chatbots for any of the schoolwork-related purposes examined in PISA

Note: Countries and economies are ranked in descending order of the percentage of students reporting to never or almost never have used AI chatbots for any schoolwork-related purposes examined in PISA.
Source: OECD, PISA 2025 Database, Table I.B1.4.55. See https://stat.link/o1j4k0 for the underlying data.
The relationship between AI use and student science performance is complex. Students using AI to help them learn on a weekly basis tend to have similar science performance compared to AI non-users, when accounting for student socio-economic profile (Figure I.4.13). Students using AI to help them learn frequently (almost every day or more) or occasionally (twice a month or less) tend to have lower scores than non-users.
With respect to AI use for specific tasks, non-users of AI tend to outperform users. For tasks such as summarising texts and conducting preliminary research on new topics, moderate users (those using AI between once a month and twice a week) outperform both limited users (twice a year or less) and frequent users (almost every day or more). However, for tasks such as drafting texts for writing assignments, the performance advantage of moderate users is less pronounced.
These relationships do not necessarily imply a negative impact of AI use on science performance, but may reflect a complex mix of who adopts AI and how they use it. It also suggests that moderate and intentional use of AI for schoolwork and learning may be positively related to student performance. See Box I.4.2 for detailed analyses on how schools can potentially support students in more effectively using AI.
Based on students’ reports; OECD average

Note: Mean scores adjusted for socio-economic status are predicted science scores obtained from separate regressions of science performance on the frequency of each type of AI use, after accounting for students’ socio-economic status.
Source: OECD, PISA 2025 Database, Table I.B1.4.61. See https://stat.link/o1j4k0 for the underlying data.
On average across OECD countries, around six out of ten students report that they were tasked in their school lessons with assessing the quality of information generated by AI (Table I.B1.4.67), with shares ranging from 31% to more than 80% across countries and economies. Among these students, 46% reported they did so sometimes, around 33% often, and 22% very often. Students appear to have more opportunities in their school lessons to learn and practice how to critically evaluate digital information in general rather than specifically AI-generated content. About eight in ten students report, in their school lessons, they were tasked with assessing the quality of information they find online (Table I.B1.4.67).1
When students have learning opportunities related to AI in school, those who reported using AI to help them learn frequently (once a week or more) tend to slightly outperform their peers, both AI non-users and AI users about twice a month or less. In Figure I.4.14, two green diamonds on the right end are higher than other green diamonds and orange diamonds.
While these results cannot determine causality, they do underscore the potential of targeted instruction for all students to strengthen their critical engagement with AI. They also suggest that simply expanding access to AI tools is unlikely to produce benefits without parallel investments in guidance on appropriate and effective use. Education systems can promote more effective digital and media literacy education, including critical engagement with AI, by providing support such as training and resources to teachers, adopting a cross-sectoral approach to better coordinate media landscapes, and emphasising the use of AI tools that are fit for purpose (Hill, 2022[10]).
It is important to highlight that socio-economically disadvantaged students are less likely to report they are tasked to assess AI-generated information during school lessons (Table I.B1.4.68). This disparity warrants closer examination, along with the implementation of targeted interventions, to prevent the emergence of a new form of socio-economic divide in the age of AI.
Based on students’ reports; OECD average

Source: OECD, PISA 2025 Database, Table I.B1.4.70. See https://stat.link/o1j4k0 for the underlying data.
1. Consistent with this, having done a task to assess the quality of online information is positively associated with science performance on average across OECD countries and in many countries and economies, both on average and for all AI frequency of use (Tables I.B1.4.69 and I.B1.4.70). Such an association is not observed on average for assessing the quality of AI-generated content after accounting for students’ and schools’ socio-economic profile, possibly because evaluating AI output requires both general critical literacy skills and specific understanding of how AI systems produce information, alongside differences in usage patterns.
Patterns observed in Figure I.4.13 might be explained by the different characteristics of frequent versus limited (or no) AI use, in terms of student background and learning dispositions. Students who reported not using AI for schoolwork tend to come from more socio-economically disadvantaged backgrounds (Table I.B1.4.55). Limited access to digital devices, stable Internet connections or paid AI tools may restrict opportunities to experiment with or routinely use AI for schoolwork. By contrast, students who use AI more frequently tend to come from more advantaged backgrounds (Table I.B1.4.54), suggesting that regular AI use is partly shaped by differential access and exposure. However, socio‑economic background alone does not fully explain the observed performance patterns among users.
Learning‑related dispositions are different across AI‑use profiles. For task‑specific uses (summarising readings, drafting texts and conducting preliminary research), students who report not using AI tend to report higher levels of help seeking than infrequent users. However, among users, help seeking is generally higher among students who use AI weekly or daily (Figure I.4.15). A different pattern emerges when AI is used “to help me learn”: in this case, frequent users (weekly or daily) report they seek help more than both non-users and less frequent users.
Levels of intrinsic motivation to learn are generally highest among students who use AI weekly, regardless of the purpose of use. However, similarly high levels are observed among students who do not use AI for some task-specific purposes (such as summarising or drafting), and among daily users who use AI “to help me learn” (see Figure I.4.o5 online).
Mean index of self-regulated help seeking; OECD average

Note: The mean index of self-regulated help seeking for students using AI to summarise a text they had to read about once or twice a week is close to 0, on average across OECD countries.
Source: OECD, PISA 2025 Database, Table I.B1.4.64. See https://stat.link/o1j4k0 for the underlying data.
Curiosity is positively associated with students’ use of AI. On average across OECD countries, students who report using AI every day or almost every day, irrespective of the task, tend to also report higher levels of curiosity. Lower levels of curiosity were reported by students who report more limited AI use, however the relationship between curiosity and AI non-use is more mixed (Figure I.4.16). The literature on curiosity and use of AI in students is still limited, however these results underscore there is a need to further explore this association to ascertain whether AI provides additional opportunities for personalised inquiry for students who already exhibit high curiosity, or whether its use can support the development of curiosity.
Mean index of curiosity; OECD average

Source: OECD, PISA 2025 Database, Table I.B1.4.65. See https://stat.link/o1j4k0 for the underlying data.
A complementary perspective emerges when examining the relationship between AI use and performance at the system level. Figure I.4.17 shows substantial variation in the frequency of AI use for schoolwork, especially among systems performing above the OECD average.
System-level data collected for PISA 2025 suggest that differences in AI use across high-performing systems may be partly explained by differences in the emphasis of their policies on digital resources and AI. For instance, Korea and Singapore have implemented large-scale, comprehensive policies to foster digital learning, with Singapore explicitly including the use of AI tools. By contrast, Japan and Estonia, where AI is used less frequently for schoolwork, have policies on digital learning that are comparatively less comprehensive in scope. An exception is Chinese Taipei, which, despite having a relatively low average frequency of AI use, has implemented a large-scale policy on digital learning since 2021.
In contrast, systems performing lower than the OECD average show variation in their levels of AI use at school, but the variation is smaller than the variation among higher-performing countries. A possible hypothesis for this would be that systems with lower performance levels have been faster to adopt AI tools as a compensatory strategy. Overall, these findings highlight the importance of policy, guidance and instructional design in shaping effective and pedagogically sound integration of AI into teaching and learning in systems where AI-use for learning is widespread.
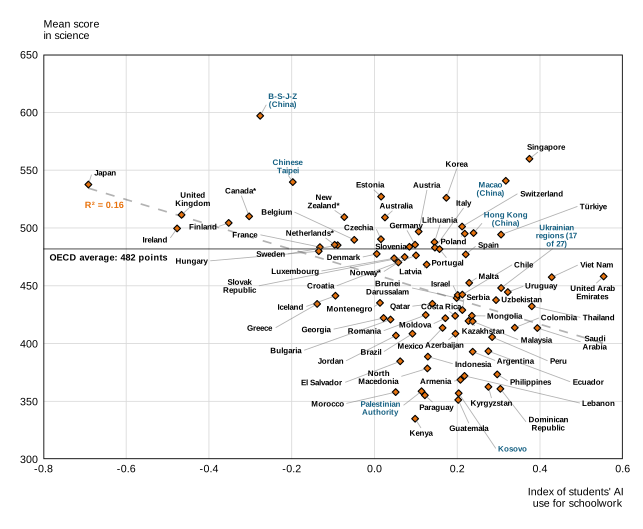
Note: The index of students’ AI use for schoolwork (AIUSESCH) combines students’ responses to a set of four questions asking how often they use artificial intelligence chatbots (e.g. ChatGPT) for school‑related activities. Specifically, students were asked how frequently they use AI chatbots (1) to summarise a text they had to read, (2) to conduct preliminary research on a new topic, (3) to draft texts for writing assignments, and (4) to help them learn. Higher values on the AIUSESCH index reflect a higher overall frequency of students’ AI chatbot use for schoolwork.
Source: OECD, PISA 2025 Database, Tables I.B1.4.53 and I.B1.2a.1 (Chapter 2). See https://stat.link/o1j4k0 for the underlying data.
Perceived shortages of education staff and materials
Like with digital resources, PISA data can provide insight into another important dimension of school resources, that of school-level staff and personnel, as well as the material resources available to them. How well systems are doing in raising and allocating financial resources can be partly measured through perceived constraints and shortages of personnel or materials reported by school principals. It is important to note that school principals’ responses regarding shortages do not represent absolute measures, as perceptions of what constitutes a shortage may vary across countries and economies.
In 2025, on average across OECD countries, around four out of ten students were in schools where principals reported that instruction was hindered to some extent or a lot by a lack of teachers, and a similar proportion were in schools where a lack of assisting staff was perceived to hinder instruction (Table I.B1.4.71).
On average across OECD countries, principals in 2025 reported fewer teacher shortages than their counterparts did in 2022 (Figure I.4.18). However, in most education systems they are more concerned than principals were in 2018. The decrease was particularly salient in Saudi Arabia, Belgium and Hong Kong (China), where the share of students in schools whose principals reported that a lack of teaching staff hindered instruction at least to some extent fell by over 25 percentage points between PISA 2022 and PISA 2025 (Table I.B1.4.78). This improvement is consistent with the decrease in student-to-teacher ratio observed on average across OECD countries and in 36 countries/economies during the same time period (Table I.B1.4.82). Improved student-to-teacher ratios and (perceived) teacher shortages, however, do not necessarily imply an increase in the number of teachers; they may instead reflect demographic changes, curriculum changes and declining enrolment experienced in some countries and economies.
On average across OECD countries, principals appear to be less concerned about the quality than about the quantity of teaching staff (Table I.B1.4.71). Around one-quarter of students were enrolled in schools where principals reported that instruction was hindered, to some extent or a lot, by inadequate or poorly qualified teaching staff. This share remained stable compared to 2022 on average across OECD countries and also in 46 countries/economies (Table I.B1.4.78).
The overall improvement in teaching staff shortages is nonetheless counterbalanced by deeper concerns over assisting staff shortages. While principals on average across OECD countries reported similar levels of assisting staff shortages in 2022 and 2025, they expressed greater concern about their adequacy and training in the most recent PISA cycle (Figure I.4.o6 (online) and Table I.B1.4.78).
As such, the combined index on education staff shortages increased (worsened) compared to 2022 on average across OECD countries and in 19 countries/economies, confirming the upward trend already initiated in PISA 2018 (Table I.B1.4.77). Still, school principals in 17 countries and economies reported less concern about the lack of teachers and assisting staff than their counterparts did in 2022.
Shortages of education staff are more frequently reported in socio-economically disadvantaged schools than in advantaged schools13 and in public rather than private schools in most countries and economies, raising concerns about the equitable distribution of human resources (Table I.B1.4.72). Effective learning environments and adequate resourcing can compensate to some extent for social inequalities (Salinas, 2017[11]), therefore resourcing concerns should be addressed in all schools, especially the most disadvantaged.
PISA also asked principals about the lack or inadequacy of material resources, such as textbooks, libraries, laboratory material and buildings. On average across OECD countries, more than one-quarter of students attended schools whose principals indicated that a lack of material resources hindered instruction at least to some extent, and around one-third were in schools where lack of physical infrastructure was perceived to hinder instruction (Table I.B1.4.83).
Principals in 2025 reported more shortages of material resources than did those in 2022, on average across OECD countries and in 16 countries/economies. However, a similar number of education systems recorded improvements (Table I.B1.4.89). This overall increase of material shortages partially offsets the improvement observed between PISA 2018 and 2022, though the (perceived) availability of material resources remains above 2018 levels, on average across OECD countries and in 35 countries/economies.
Percentage-point change in students whose principals reported that the school's capacity to provide instruction is hindered to some extent or a lot by a lack of teaching staff

Notes: Only countries and economies with available data are shown.
Statistically significant differences between PISA 2022 and PISA 2025 (PISA 2025 - PISA 2022) are shown in a darker tone (see Annex A3).
Countries and economies are ranked in descending order of the change in the percentage of students whose principals reported that the school's capacity to provide instruction is hindered to some extent or a lot by a lack of teaching staff between 2022 and 2025.
Source: OECD, PISA 2025 Database, Tables I.B1.4.78 and I.B1.4.90. See https://stat.link/o1j4k0 for the underlying data.
Results in Figure I.4.19 (and Table I.4.1) show that students score lower in science when their principals report greater shortages of material and human resources. However, these relationships weaken and even disappear in many education systems after accounting for students’ and schools’ socio-economic profile.
Change in science performance associated with principals reporting that the school's capacity to provide instruction is hindered to some extent or a lot by the following factors; OECD average

1. The socio-economic profile is measured by the PISA index of economic, social and cultural status.
Statistically significant score-point differences are shown in a darker tone.
All score-point differences are statistically significant before accounting for students' and schools' socio-economic profile (see Annex A3).
Educational material includes textbooks, ICT equipment, library, laboratory material, etc. Physical infrastructure includes school building, grounds, heating/cooling systems, lighting and acoustic systems, etc.
Percentage of students in schools where school's capacity to provide instruction is hindered to some extent or a lot by the following is shown in parentheses.
Source: OECD, PISA 2025 Database, Tables I.B1.4.71, I.B1.4.79, I.B1.4.83 and I.B1.4.91. See https://stat.link/o1j4k0 for the underlying data.
Learning outside of regular instruction time
The amount of time that students are engaged in learning activities is another important resource that can influence performance and academic success. Learning activities are not limited to regular instruction time but also include homework time and additional instruction students might choose to follow. Homework is assigned for various reasons, such as ensuring information is stored in students’ long-term memory or helping struggling students learn the material covered in class. While time is essential for learning within and outside of the classroom, increasing learning time alone is not enough to improve students’ outcomes.
Students in 2025 report spending around 1.4 hours per day on their homework on average across OECD countries, ranging from less than 1 hour to 2.5 or more hours in Zambia, Azerbaijan, Mauritius, Mongolia and Rwanda (Table I.B1.4.93).
Time students spend on their homework has decreased on average across OECD countries by about 10 minutes per day, representing a 11% decline compared to 2022 (Table I.B1.4.96). This drop is observed in nearly all education systems with available data and is driven by a 6 percentage-point decrease in the proportion of students spending more than 2 hours per day on their homework in a typical school week. A similar decrease is observed when looking specifically at science homework14 (Table I.B1.4.97).
The relationship between time spent on homework and student performance follows an inverted U-shape (Figure I.4.20, Table I.B1.4.98), where up until a threshold (in this case 2 hours per day), time spent on homework is associated with increased science performance, while more time spent on homework is associated with lower performance. This is consistent with previous PISA results (OECD, 2023[8]). This does not necessarily indicate that homework time negatively affects students’ performance; rather, it may reflect a situation in which lower-performing students spend more time on homework due to additional assignments and/or a need for more time to complete given tasks than their higher-performing peers. This could imply the need to make students’ learning time in school more productive, in particular for lower-performing students.
Students who report spending more time on their homework are more likely to report higher levels of engagement in learning, which is discussed in detail in Chapter 3. For example, positive relationships are observed with curiosity, perseverance and goal setting in nearly all countries/economies and with help seeking in 55 countries and economies, after accounting for students’ and schools’ socio-economic profile (Table I.B1.4.100). By contrast, total homework time shows no clear association with students’ sense of belonging at school in most countries/economies.
Based on students’ reports; OECD and all countries and economies averages

Notes: Differences between categories are all statistically significant (see Annex A3).
Percentage of students per time spent on doing homework in all subjects per day is shown in parentheses (OECD average).
Source: OECD, PISA 2025 Database, Tables I.B1.4.93 and I.B1.4.99. See https://stat.link/o1j4k0 for the underlying data.
Outside of regular learning time, schools can provide study help to students in different ways (Figure I.4.21). Providing adequate spaces where students can do their homework is relatively widespread, which is important for students, in particular the most disadvantaged, who may lack a quiet place to do their homework at home. Other forms of study support such as peer-to-peer tutoring and staff help with homework are, on average, less prevalent across OECD countries.
Percentage of students enrolled in schools whose principals reported that the following types of study help are provided

Countries and economies are ranked in descending order of the percentage of students enrolled in schools whose principals reported that their school provided peer-to-peer tutoring.
Source: OECD, PISA 2025 Database, Table I.B1.4.101. See https://stat.link/o1j4k0 for the underlying data.
Study help provision may depend in part on factors such as school needs, financial means and students’ initial performance. This may potentially explain varying relationships between different types of study help and science performance. Providing spaces for students to complete their homework and peer-to-peer tutoring are positively related to science performance on average across OECD countries. Staff help with homework appears, however, negatively associated with science performance in 20 countries/economies (Table I.B1.4.102). This could be indicative of reverse causality, in the sense that schools provide additional staff support to students who are struggling. After accounting for schools’ and students’ socio-economic profile, the relationships for all types of study help and science performance weaken and disappear in most countries and economies. No relationships are observed between study help provision and attitudes towards learning, including curiosity, perseverance and sense of belonging, in most countries and economies (Table I.B1.4.103).
Students may also receive additional school science instruction through individual, group or online tutoring and classes, and this instruction may happen at school or outside of school premises. On average across OECD countries, around 60% of students participate in at least one type of additional school science instruction, ranging from 34% in Belgium to 97% in Viet Nam (Tables I.B1.4.104 and I.B1.4.105). This additional instruction is predominantly undertaken through video-recorded lessons or online platforms (reported by 37% of students on average across OECD countries), followed by individual or group on-site tutoring (respectively used by 27% and 30% of students on average). Group real-time online lessons are less prevalent overall, with 17% of students participating in such additional instruction on average (ranging from 5% in Korea and Japan, to 54% in Viet Nam and Indonesia).
Additional science instruction outside of regular school hours appears primarily undertaken by low-performing students in most PISA-participating countries and economies (Table I.B1.4.106). The reverse is, however, observed in some systems, suggesting additional science instruction might be used in those contexts for an enrichment purpose. Socio-economically advantaged students have higher participation rates in additional school science instruction than their disadvantaged peers on average across OECD countries and in half of countries/economies with available data (Table I.B1.4.105). This unequal access to additional instruction/support may increase existing inequalities in some countries/economies.
Beyond the resources available to schools, supportive relationships with teachers and families play a central role in shaping students’ academic outcomes, well-being and attitudes towards learning. Research consistently supports the idea that healthy relationships are good for people and that social connection is one of the strongest predictors of positive outcomes in adolescence and later in life, whereas social disconnection increases one’s vulnerability to adverse health and socio-economic risks (Burns and Gottschalk, 2019[12]).
Teacher support in science lessons
Teacher support refers to the help and encouragement that teachers offer their students such as showing an interest in every student’s learning, giving extra help when needed and continuing to teach until students understand. Teacher support can make it easier for students to accomplish tasks and succeed academically, and it supports their social and emotional development (OECD, 2025[13]). PISA 2025 data indicate that, on average across OECD countries and in around half of the PISA-participating countries/economies teacher support in science lessons have increased since 2015 (Figure I.4.22). As for individual countries and economies, Korea, Japan, Indonesia, Croatia, the Slovak Republic, Thailand and Viet Nam experienced the largest increases in reported levels of teacher support.
These positive trends appear to be primary driven by an increase in the percentage of students reporting that their science teacher helps them regularly with their learning and gives them an opportunity to express opinions (Table I.B1.4.116). For instance, 72% of students in 2015 reported that their science teacher helps students with their learning compared to 75% in 2025, on average across OECD countries.
Despite the overall improvement in teacher support since 2015, fewer students in 2025, on average across OECD countries and in 37 countries/economies, reported that their science teacher continues teaching until they understand in most of every lesson. Importantly, systems where the share of students reporting the above statement decreased the least, or even increased, showed more stable science performance since 2015 (Table I.B1.4.189), even after accounting for changes in GDP per capita.
Across OECD countries, most students reported receiving regular support from their science teachers in 2025, although the prevalence of supportive practices varies substantially across education systems (Table I.B1.4.113). While in 17 countries/economies, more than 85% of students reported that their teacher gives extra help when students need it in most or every science lesson, less than two-thirds reported this practice in 10 countries/economies.
Difference in the index of teacher support in science (PISA 2025 - PISA 2015)

Notes: Statistically significant differences between PISA 2015 and PISA 2025 (PISA 2025 - PISA 2015) are shown in a darker tone (see Annex A3).
This index is based on students’ perceptions of teacher support in science lessons, by reporting how often (“every lesson”, “most lessons”, “some lessons” or “never or hardly ever”) their science teacher shows an interest in every student’s learning; gives extra help when students need it; helps students with their learning; continues teaching until the students understand; and gives students an opportunity to express opinions. The index of teacher support was standardised in 2015 to have a mean of 0 and a standard deviation of 1 across OECD countries.
Countries and economies are ranked in ascending order of the change in the index of teacher support in science.
Source: OECD, PISA 2025 Database, Table I.B1.4.115. See https://stat.link/o1j4k0 for the underlying data.
Associations between teacher support in science lessons and science performance are generally positive, and these associations become even stronger after accounting for students’ and schools’ socio-economic profile. In about 56 countries/economies, and also on average across OECD countries, the relationship is positive even after adjusting for socio-economic profile15 (Figure I.4.23).
Change in science performance associated with a one-unit increase in the index of teacher support, before and after accounting for students’ and schools’ socio-economic profile

1. The socio-economic profile is measured by the PISA index of economic, social and cultural status (ESCS).
Statistically significant differences in science performance are shown in a darker tone (see Annex A3).
Countries and economies are ranked in descending order of the change in science performance associated with a one-unit increase in the index of teacher support, after accounting for students’ and schools’ socio-economic profile.
Source: OECD, PISA 2025, Table I.B1.4.117. See https://stat.link/o1j4k0 for the underlying data.
However, the relationship between science performance and teacher support reverses when system-level correlations are examined. Countries and economies with higher levels of teacher support are more likely to have a lower average science performance, even after accounting for GDP per capita. Changes in teacher support and science performance since 2015 also show no clear association at the system level16 except when students are asked if their science teacher continues teaching until the students understand or gives students an opportunity to express opinion (Tables I.B1.4.188 and I.B1.4.189). This negative association with science performance needs to be interpreted with caution as it could be simply signalling a compensatory mechanism: teachers provide greater support whenever they encounter struggling students (OECD, 2025[13]).
As for other student outcomes, greater teacher support is consistently associated with more positive student attitudes towards learning and higher levels of students’ sense of belonging (Table I.B1.4.118). These relationships are observed in nearly all countries/economies, even after accounting for students’ and schools’ socio-economic profile.
Family support
Parents’ and guardians’ engagement with schools and with their children’s learning plays an important role in shaping students’ education, not only through the formation of skills and attitudes towards learning but also through their influence on educational expectations (Box I.4.3).
On average across OECD countries, most students report discussing their education with their parents or guardians at least once or twice per week, with large disparities both in terms of discussion subject prevalence and across countries (Table I.B1.4.120). While more than 70% of students report discussing what they did at school at least once per week with their parents across OECD countries, ranging from 37% in Cambodia to 83% in Ireland, only 46% have regular discussions on problems they might have at school.
Higher levels of family support are consistently associated with higher science performance and more positive attitudes towards learning in nearly all countries/economies (Tables I.B1.4.124 and I.B1.4.125). These positive associations remain after accounting for students’ and schools’ socio-economic profile, though they decrease in magnitude for science performance, indicating that family support partly reflects broader socio-economic advantages.17
Around 40% of the socio-economic difference in higher education aspirations can be accounted for by gaps in parental expectations
PISA 2025 data show that socio‑economically disadvantaged students are less likely to aspire to higher education than their advantaged peers across almost all countries and economies, even after accounting for their performance (Table I.B1.4.119).1 This pattern holds in almost all countries and economies among both high‑achieving and low‑achieving disadvantaged students, who are, on average, respectively 20 and 28 percentage points less likely to aspire to higher education compared to advantaged students with comparable science performance.
Such gaps in educational aspirations are concerning because they may influence students’ educational choices, effort and engagement that are closely linked to longer‑term outcomes. Lower aspirations among disadvantaged students may therefore limit their educational investment and engagement, and contribute to the persistence of socio‑economic inequalities.
PISA 2025 introduced new questions for students to provide new insights into the social mechanisms underlying socio‑economic differences in post‑secondary aspirations. Students were asked about their perceptions of their parents’ educational expectations and of their peers’ expected educational attainment. Families and relatives may indeed play a central role in forming students’ aspirations, through comparison with peers and identification of educational pathways prevalent in their social context.2
On average across OECD countries, the socio-economic gap in higher education aspirations is reduced by 40% when accounting for parental aspirations (Figure I.4.24). Interestingly, accounting further for peer aspirations as well as school socio-economic profile does not reduce much further the socio-economic gap in higher education aspiration for either high- or low-achieving students. While the direction of causation between the different indicators cannot be established, PISA 2025 evidence points towards the vital role of parents in shaping their children’s educational expectations.
Difference between advantaged and disadvantaged students in the proportion wishing to pursue higher education, by performance in science; OECD average

Notes: All differences between advantaged and disadvantaged students are statistically significant (see Annex A3).
A socio-economically advantaged (disadvantaged) student is a student in the top (bottom) quarter of the PISA index of economic, social and cultural status (ESCS) in his or her own country/economy.
High‑achieving students are those whose science performance places them in the top quarter of the performance distribution within their country or economy, while low‑achieving students are those in the bottom quarter.
Parental aspirations are measured with a dummy equal to one if students declare their parents expect them to pursue higher education.
Peer aspirations controls include a dummy equal to one if students declare their schoolmates are expecting to pursue higher education.
Source: OECD, PISA 2025 Database, Table I.B1.4.119. See https://stat.link/o1j4k0 for the underlying data.
1. This finding is not only limited to PISA data but extensively reported in literature (Guyon and Huillery, 2020[20]).
2. Choosing aspirations aligned with students’ own social groups may also help preserve social identity, avoid disruption or cognitive dissonance, and maintain future social ties (Bénabou and Tirole, 2011[19]; Austen-Smith and Fryer, 2005[18]; Schörner and Bittmann, 2023[21])
Interestingly, the positive association between family support and science performance is primarily driven by parental interest in students’ day-to-day life, namely what they did and learned and how well they are doing at school, rather than discussions related to future education, which appear negatively associated with science performance across OECD countries (Figure I.4.25). This negative relationship might be driven by the willingness of low-performer parents to motivate their children for their studies by emphasising what future returns it could bring them. Discussions about future education might also happen more frequently among low-performing students in case of uncertainty, risk of failure or important decisions about educational pathways.
Change in science performance associated with a one-unit increase in family support index and by items; OECD average

1. The socio-economic profile is measured by the PISA index of economic, social and cultural status.
All values are statistically significant (see Annex A3).
The family support index is based on students’ reports of whether their parents or guardians show interest in their learning, discuss school activities with them and talk about their future education.
Source: OECD, PISA 2025 Database, Table I.B1.4.124. See https://stat.link/o1j4k0 for the underlying data.
Students in 2025 reported lower levels of family support than students in 2022 on average across OECD countries and nearly all participating countries/economies (Figure I.4.26). For example, in 2022, 77% of students reported that their parents or guardians ask them what they did in school that day at least once a week, but it decreased to 71% in 2025. A decline is observed in almost all countries and economies (Table I.B1.4.123).
The drop in family support is particularly visible among boys and disadvantaged students, with widening gender gaps in 42 countries/economies and greater socio-economic gaps in 14 countries/economies (Table I.B1.4.122).
Interestingly, this overall decrease in family support did not translate into reduced parental engagement in school activities, as reported by school principals (Table I.B1.4.126). The share of students in schools where principals reported that a majority of parents or guardians discuss their child’s progress with a teacher – either on their own initiative or at the teacher’s request – increased by 3 percentage points compared to 2022 on average across OECD countries (to 33% and 54%, respectively), while many countries and economies showed no significant changes. The participation in local school government or volunteering in physical or extracurricular activities remained at similar levels as those observed in 2022 in most countries and economies, always according to school principals.
Furthermore, school-level policies that encourage parental engagement in school activities are associated with higher levels of involvement in school activities, but not with students’ perceptions of family support (Table I.B1.4.130). These diverging results suggest that students’ perceptions of family support mainly reflect day-to-day interactions, whereas parental involvement in school activities is more occasional, more structured, and may also be shaped by cultural norms. These two indicators thus capture distinct dimensions of parental involvement.
Finally, although PISA data do not allow the reasons underlying the stability of parental or guardian involvement in school activities to be disentangled, it is worth noting that these school-level policies have remained relatively stable in a majority of countries and economies, while increasing in 24 countries and economies (Table I.B1.4.128). Looking beyond these forms of involvement, inter-generational dynamics provide further insight into how family background shapes students’ longer-term outcomes (see Box I.4.4).
Difference in the index of family support (PISA 2025 - PISA 2022)

Notes: Statistically significant differences between PISA 2022 and PISA 2025 (PISA 2025 - PISA 2022) are shown in a darker tone (see Annex A3).
Countries and economies are ranked in ascending order of the change in the index of family support.
Source: OECD, PISA 2025 Database, Table I.B1.4.122. See https://stat.link/o1j4k0 for the underlying data.
High levels of inter-generational educational and occupational mobility signal greater equality of opportunity, as they reflect a weaker influence of socio-economic status on individual outcomes. Educational mobility refers to changes in individual’s educational attainment relative to parents, encompassing upward, downward or no mobility. Occupational mobility similarly captures changes in occupational status across generations.
PISA 2025 offers a unique, forward-looking perspective on this topic by examining students’ educational and occupational expectations for the future. Students were asked to report their parents’ educational attainment and occupation, and the highest educational qualification and occupation (at age 30) they expected to obtain.
How students view educational and occupational mobility
In terms of educational mobility, PISA 2025 finds that, on average across OECD countries, 23% of students expect to attain a higher level of education than their parents, 15% a lower level and 61% expect to attain the same level (Table I.B1.4.131). Students in Morocco, Cambodia, Türkiye and the Kurdistan Region (Iraq) are the most optimistic, with 3 in 5 students or more expecting to attain a higher level of education than their parents. In Norway*, Finland and Denmark, by contrast, 1 in 4 students or more expected downward mobility, the highest share amongst all participating countries and economies.
When it comes to occupational mobility, on average across OECD countries, 37% of students expect to work in higher occupational groups than their parents, 31% of students expect to work in similar occupational groups than their parents, and 31% expect to work in lower occupational groups (Table I.B1.4.131). Students in Morocco, Colombia and Cambodia reported the highest expected upward occupational mobility (70% or more), while students in Qatar reported the lowest (less than 20%). As for downward occupational mobility, the lowest share was observed in Peru (less than 10%), while the highest share was observed in Norway*, Australia, Denmark, Sweden, New Zealand*, Iceland and Singapore (more than 40%).
How inter-generational educational and occupational mobility compare
Although closely related, these dimensions do not necessarily evolve in parallel. Educational expansion has increased upper educational mobility in many countries, while occupational mobility has remained comparatively stable. This divergence has raised concerns about a growing disconnect between education and labour-market rewards (Corak, 2013[14]; OECD, 2025[15]). This mismatch has important policy implications. If higher education no longer guarantees improved occupational prospects, young people may lose confidence in education as a pathway to social advancement. Such perceptions can influence motivation, engagement and educational choices well before labour-market entry, ultimately reinforcing the influence of family background in shaping life chances.
On average across OECD countries, more than 60% of students remain optimistic and aligned in expectations in stable or upward educational and occupational mobility, anticipating that their educational progress will translate, already at age 30, into similar or better occupational outcomes (Figure I.4.27). Still, 1 in 4 students expect stable or upward educational mobility with downward occupational mobility. Students in the United Arab Emirates and Singapore are especially pessimistic about their occupational prospects as more than 35% of students expect downward occupational mobility despite stable or upward educational mobility. By contrast, in Rwanda and Peru, 10% of students or less hold this view (10% and 6%, respectively).
Percentage of students who reported the following regarding educational and occupational expectations

Note: Countries and economies are ranked in descending order of the percentage of students who report low occupational mobility.
Source: OECD, PISA 2025 Database, Table I.B1.4.131. See https://stat.link/o1j4k0 for the underlying data.
The quality of school climate matters for students’ learning, as it can influence students’ attitudes towards learning and their academic success. Safe and orderly school climates that actively prevent bullying and promote regular attendance contribute to environments in which students are more likely to engage with learning and perform well. This section examines three key aspects of school climate in PISA 2025: disciplinary climate in science lessons,18 bullying and cyberbullying, and student truancy.
Disciplinary climate in science lessons
In addition to the instructional support provided by teachers, learning in a positive and well-structured climate is important for students’ learning. PISA 2025 asked students to report how often their science lessons are disrupted due to classmates not listening to the teacher, the presence of noise and disorder, the time teachers must spend waiting for students to settle down, students’ difficulty in working effectively, and delays in students beginning their work after the lesson has started.19
The disciplinary climate in science lessons has improved since 2015 on average across OECD countries and in 37 countries/economies (Table I.B1.4.134). Such improvements are especially remarkable in Korea and Croatia, driven by rises in all indicators of disciplinary climate (Table I.B1.4.135). By contrast, the disciplinary climate deteriorated in 10 countries/economies.
At the system level, trends in disciplinary climate are positively related to changes in science performance, at least when the 2015-2025 period is examined20, reinforcing the within-country findings (Figure I.4.28).
Disciplinary climate, however, remains a concern in many countries and economies. On average across OECD countries, around 30% of students reported disruptions from noise and disorder, and one-fifth reported that students cannot work well in most or every science lessons (Table I.B1.4.132). Those averages mask substantial heterogeneity across education systems, with 50% or more of students reporting regular noise and disorder in Argentina and Uruguay, and more than one-third reporting regular difficulty of working well in Greece, the Palestinian Authority, Morocco and Bulgaria. Disciplinary climate is, on the contrary, especially conducive to learning in Korea and B-S-J-Z (China), where fewer than one in ten students reports regular disruptions in each question.
Students reporting higher disciplinary climate in school science lessons tend to have higher scores in science21 and more positive attitudes towards learning22 in nearly all countries/economies, even after accounting for schools’ and students’ socio-economic profile (Tables I.B1.4.136 and I.B1.4.137). Likewise, at the system level, countries with higher overall disciplinary climate in 2025 present higher average science performance23 and higher levels of help seeking and science enjoyment, even after accounting for GDP per capita when considering all countries and economies (Table I.B1.4.188).
Students in socio-economically disadvantaged schools tend to report a more disruptive disciplinary climate than their peers in advantaged schools, on average across OECD countries and in 53 countries/economies (Table I.B1.4.133). Moreover, in education systems where the gap in disciplinary climate between advantaged and disadvantaged schools is larger, socio-economic disparities in science performance also tend to be greater (Table I.B1.4.188).
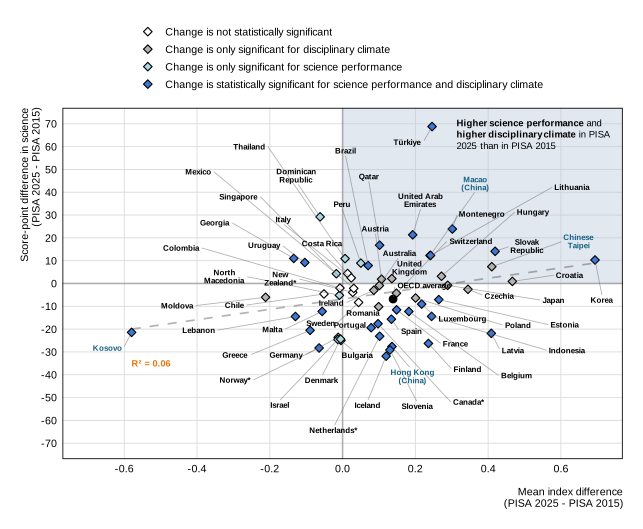
Note: Only countries and economies with available data are shown.
Source: OECD, PISA 2025 Database, Tables I.B1.4.134 and I.B1.2a.36 (Chapter 2). See https://stat.link/o1j4k0 for the underlying data.
Bullying and cyberbullying
Bullying undermines students’ sense of safety and belonging at school and can have lasting detrimental consequences for learning and well-being. PISA 2025 data provide new evidence on the prevalence of cyberbullying as well as trends on other types of bullying since 2015.
On average across OECD countries, 20% of students reported being victims of at least one form of bullying24 at least a few times per month in 2025 (Figure I.4.29). Boys and socio-economically disadvantaged students report higher levels of bullying victimisation than girls and advantaged students, respectively, on average across OECD countries and in many education systems25 (Table I.B1.4.140).
Results based on students’ self-reports


Notes: Positive values in the index of exposure to bullying indicate that students are more exposed to bullying at school than are students on average across OECD countries.
Countries and economies are ranked in descending order of the index of exposure to bullying.
Source: OECD, PISA 2025 Database, Table I.B1.4.138. See https://stat.link/o1j4k0 for the underlying data.
Compared with 2022, the prevalence of bullying increased in a large majority of countries and economies participating in PISA 202526 (Table I.B1.4.143). Relational bullying, rather than physical bullying or verbal bullying, is the form that increased the most between 2022 and 2025 across all participating countries. In 47 countries and economies, the share of students reporting that other students spread nasty rumours about them at least a few times per month rose over this period, although increases greater than five percentage points were observed only in Guatemala and Germany (Table I.B1.4.143).
This widespread rise contrasts with the decline in bullying observed between 2018 and 2022 in most countries and economies. Overall, the magnitude of the 2018-2022 decline was greater than the 2022-2025 increase; so the PISA 2025 levels of bullying are still somewhat lower than in 2018, on average across OECD countries and in most countries and economies27 (Table I.B1.4.143).
Part of the contrasting trends across PISA cycles might be partly explained by the impact of the COVID‑19 pandemic on students’ daily interactions. Evidence from comparisons between PISA 2018 and PISA 2022 suggests that periods of remote or hybrid schooling during the pandemic reduced students’ in‑person contact and temporarily limited opportunities for face‑to‑face bullying (Li et al., 2025[16]). As schools fully reopened, the return to regular in‑person interaction – combined with increases in behavioural and well‑being challenges reported in many systems – may have contributed to the rise in bullying between 2022 and 2025.
For the first time, in 2025, PISA introduced a new item on cyberbullying in its question on exposure to bullying: “information about me that was upsetting was published online without my consent”. While most forms of bullying measured in PISA may occur either in person or online (except for physical bullying), this new item captures cyberbullying more specifically because it refers to a behaviour that can occur only in the online environment. Publishing upsetting information without consent is a behaviour that reflects how bullying has evolved in the context of widespread digital technology and social media use.
Overall levels of cyberbullying were relatively low, compared with other forms of bullying (Figure I.4.30). On average across OECD countries, only 3% of students reported that information about them that was upsetting was published online without their consent at least a few times per month, with large heterogeneity across systems. In many countries and economies, boys and students in socio-economically disadvantaged schools were more likely to experience this form of cyberbullying than girls and students in advantaged schools. However, the magnitude of these differences was relatively small, amounting to about 1-2 percentage point on average across OECD countries (Table I.B1.4.141).
Percentage of students who reported that information about them that was upsetting was published online without their consent at least a few times per month


1. A socio-economically advantaged (disadvantaged) student is a student in the top (bottom) quarter of the PISA index of economic, social and cultural status (ESCS) in his or her own country/economy.
Countries and economies are ranked in descending order of the percentage of students exposed to cyberbullying.
Source: OECD, PISA 2025 Database, Table I.B1.4.141. See https://stat.link/o1j4k0 for the underlying data.
Although cyberbullying is less frequently reported than other forms of bullying, it often occurs in addition to other forms of bullying, and research suggests that it is associated with poorer well-being and mental health outcomes.28 On average across OECD countries, of students who reported being cyberbullied, nine out of ten also reported that they experience other forms of bullying at least once a month (Table I.B1.4.139).
PISA 2025 results show that cyberbullying exhibits the strongest negative association with student performance compared to other forms of bullying (Figure I.4.31). In the 82 out of 86 countries and economies with available data, victims of cyberbullying scored between 13 points to almost 90 points lower in science than their peers with similar socio-economic profile who had not reported experiencing this form of bullying (Table I.B1.4.144). Those negative relationships may reflect a mutually reinforcing relationship between lower performance and bullying victimisation and may signal a potential dose-response effect of bullying and cyberbullying, already documented on well-being outcomes (Gottschalk, 2022[17]).
Beyond cyberbullying, all forms of bullying examined in PISA are associated with lower student performance and lower sense of belonging at school in most countries and economies, even after accounting for student and school socio-economic profile (Figure I.4.31 and Table I.B1.4.147). These patterns are consistent with earlier PISA analyses and international research.
Change in science performance when students reported exposure to bullying; OECD average

1. The socio-economic profile is measured by the PISA index of economic, social and cultural status (ESCS).
All values are statistically significant (see Annex A3).
Percentage of students who reported the following happened at least a few times a month is shown in parentheses.
Source: OECD, PISA 2025 Database, Table I.B1.4.144. See https://stat.link/o1j4k0 for the underlying data.
Cyberbullying is closely related to students’ use of digital devices. As shown in Figure I.4.32, on average across OECD countries, limited or moderate use of digital devices (up to 40 hours per week for leisure and 20 hours per week for learning activities) is not strongly associated with cyberbullying. Of limited or moderate users, around 2-3% report being cyberbullied. However, students who spend more time on digital devices are more likely to report experiencing cyberbullying victimisation. Of those who report higher levels of use (over 60 hours per week for either learning or leisure), 7-8% report that upsetting information about them was published online.
Percentage of students reporting that upsetting information about them was published online without their consent at least a few times per month; OECD average

Note: Percentage of students per time spent on digital devices per week is shown in parentheses. Time spent on digital devices includes use at school as well as use before and after school during weekdays and on weekends.
Source: OECD, PISA 2025 Database, Table I.B1.4.148. See https://stat.link/o1j4k0 for the underlying data.
Students’ exposure to bullying is strongly associated with key features of the school learning environment (Figure I.4.33). While supportive teacher-student relationships remain important, these findings suggest the added value of comprehensive, school‑level strategies that address bullying as a systemic issue rather than an individual one. An orderly disciplinary climate and a strong sense of safety emerge as particularly important protective factors, underscoring the role of whole-of‑school approaches to bullying prevention and mitigation. Policies and practices that promote consistent behavioural expectations, safe and inclusive learning environments, and shared responsibility among school staff appear to be more closely associated with lower levels of bullying than isolated measures alone.
Consistent with students’ reports on bullying, school principals in 2025 tend to report more negative school climate29 than 2022 in a great majority of countries and economies with available data (Table I.B1.4.156). For example, in 2022, around 30% of students were in schools whose principal reported profanity is a problem in their school to a moderate or large extent, but it increased to 52% in 2025 (Table I.B1.4.157). The change in the frequency of profanity between 2022 and 2025 is negatively associated with the change in science and reading performance between 2022 and 2025 at the system level (Table I.B1.4.189).
Despite increased reports of bullying by students and a more negative school climate reported by principals, students in 2025 indicated higher levels of feeling safe at school and during their commute to and from school than in 2022 in almost all participating countries and economies, with the largest improvements observed in Saudi Arabia, Uzbekistan, Uruguay, Macao (China), Romania and Thailand (Table I.B1.4.151). The change in levels of students’ feeling safe is positively associated with the change in science and reading performance between 2022 and 2025 (Table I.B1.4.189).
Difference in the index of exposure of bullying between students enrolled in schools in the top and bottom quarters of the teacher support, feeling safe and disciplinary climate indices; OECD average

1. Higher values in the index indicate a more positive disciplinary climate.
All differences are statistically significant (see Annex A3).
Source: OECD, PISA 2025 Database, Table I.B1.4.146. See https://stat.link/o1j4k0 for the underlying data.
Student truancy and lateness
Regular and on-schedule school attendance is essential for learning. Truancy, defined as skipping classes or school without permission, reduces students’ opportunities to learn and is often associated with disengagement from school. PISA 2022 highlighted a decrease in truancy and lateness, on average across OECD countries and in most participating countries/economies.
PISA 2025 results show that, compared to previous assessment years, truancy and lateness have increased on average across OECD countries (Figure I.4.34). Between 2018 and 2025, the share of students who reported skipping a whole day of school in the two weeks prior to the PISA test increased slightly to 22% (+0.6 percentage points), while skipping classes became less common (24% on average, -3 percentage points). Over the same period, the prevalence of arriving late for school rose by 2 percentage points (50% on average). Changes since PISA 2022 show a clearer upward trend: the share of students who reported skipping a whole day of school increased by about 3 percentage points, skipping classes rose by 2 percentage points, and lateness increased by 4 percentage points on average across OECD countries.
Percentage of students who reported that the following happened at least once in the two weeks prior to the PISA test


Notes: Only countries/economies that participated in both PISA 2025 and PISA 2018 are shown.
Countries and economies are ranked in descending order of the percentage of students who skipped a whole day of school in the two weeks prior to the PISA test in 2025.
Source: OECD, PISA 2025 Database, Table I.B1.4.161. See https://stat.link/o1j4k0 for the underlying data.
Truancy is negatively associated with student science performance and attitudes towards learning in nearly all countries and economies30 (Figure I.4.35 and Table I.B1.4.164). These relationships hold even after accounting for students’ and schools’ socio-economic profile, highlighting a possible negative impact of truancy but may also be signalling reverse causality: academically struggling students may choose (self-select) to play truant. At the system level, a similar pattern is observed: countries and economies with higher truancy rates in 2025 tend to have lower average science performance, even after accounting for GDP per capita (Table I.B1.4.188). However, trends in truancy are not consistently associated with trends in science performance across education systems31 (Table I.B1.4.189).
Policies aimed at improving attendance may contribute to reducing educational inequalities both in terms of student performance and attitudes towards learning. Truancy is indeed more prevalent among students from disadvantaged backgrounds in most countries, although the size of the gaps varies widely (Table I.B1.4.160). In education systems where the gap in truancy between advantaged and disadvantaged schools is larger, socio‑economic disparities in performance also tend to be greater (Table I.B1.4.188).
Change in science performance when students reported that, in the two weeks prior to the PISA test, they had skipped at least one class or day of school, before and after accounting for schools’ and students’ socio-economic profile

1. The socio-economic profile is measured by the PISA index of economic, social and cultural status (ESCS).
Statistically significant differences in science performance are shown in a darker tone (see Annex A3).
Countries and economies are ranked in descending order of the score-point difference in science, after accounting for students’ and schools’ socio-economic profile.
Source: OECD, PISA 2025, Table I.B1.4.162. See https://stat.link/o1j4k0 for the underlying data.
References
[18] Austen-Smith, D. and R. Fryer (2005), “An Economic Analysis of “Acting White””, The Quarterly Journal of Economics, Vol. 120/2, pp. 551-583, https://doi.org/10.1093/qje/120.2.551.
[19] Bénabou, R. and J. Tirole (2011), “Identity, Morals, and Taboos: Beliefs as Assets *”, The Quarterly Journal of Economics, Vol. 126/2, pp. 805-855, https://doi.org/10.1093/qje/qjr002.
[28] Brannigan, R. et al. (2022), “Verification of the Goldilocks Hypothesis: the association between screen use, digital media and psychiatric symptoms in the Growing Up in Ireland study”, Social Psychiatry and Psychiatric Epidemiology, Vol. 58/8, pp. 1259-1264, https://doi.org/10.1007/s00127-022-02352-5.
[12] Burns, T. and F. Gottschalk (eds.) (2019), Educating 21st Century Children: Emotional Well-being in the Digital Age, Educational Research and Innovation, OECD Publishing, Paris, https://doi.org/10.1787/b7f33425-en.
[22] Chudal, R. et al. (2021), “Victimization by traditional bullying and cyberbullying and the combination of these among adolescents in 13 European and Asian countries”, European Child and Adolescent Psychiatry, Vol. 31/9, pp. 1391-1404, https://doi.org/10.1007/s00787-021-01779-6.
[14] Corak, M. (2013), “Income Inequality, Equality of Opportunity, and Intergenerational Mobility”, Journal of Economic Perspectives, Vol. 27/3, pp. 79-102, https://doi.org/10.1257/jep.27.3.79.
[17] Gottschalk, F. (2022), “Cyberbullying: An overview of research and policy in OECD countries”, OECD Education Working Papers, No. 270, OECD Publishing, Paris, https://doi.org/10.1787/f60b492b-en.
[4] Gottschalk, F. and C. Weise (2023), “Digital equity and inclusion in education: An overview of practice and policy in OECD countries”, OECD Education Working Papers, No. 299, OECD Publishing, Paris, https://doi.org/10.1787/7cb15030-en.
[20] Guyon, N. and E. Huillery (2020), “Biased Aspirations and Social Inequality at School: Evidence from French Teenagers”, The Economic Journal, Vol. 131/634, pp. 745-796, https://doi.org/10.1093/ej/ueaa077.
[10] Hill, J. (2022), “Policy responses to false and misleading digital content: A snapshot of children’s media literacy”, OECD Education Working Papers, No. 275, OECD Publishing, Paris, https://doi.org/10.1787/1104143e-en.
[27] Kasturiratna, K. et al. (2024), “Umbrella review of meta-analyses on the risk factors, protective factors, consequences and interventions of cyberbullying victimization”, Nature Human Behaviour, Vol. 9/1, pp. 101-132, https://doi.org/10.1038/s41562-024-02011-6.
[16] Li, J. et al. (2025), “Students’ subjective well-being, school bullying, and belonging during the COVID-19 pandemic: Comparison between PISA 2018 and PISA 2022”, Humanities and Social Sciences Communications, Vol. 12/1, https://doi.org/10.1057/s41599-024-04340-3.
[9] Loh, E. (2023), “ChatGPT and generative AI chatbots: challenges and opportunities for science, medicine and medical leaders”, BMJ Leader, Vol. 8/1, pp. 51-54, https://doi.org/10.1136/leader-2023-000797.
[25] OECD (2025), “Finite time to learn and play: Whole student development and students’ digital leisure outside of school”, OECD Education Policy Perspectives, No. 130, OECD Publishing, Paris, https://doi.org/10.1787/edbaa4bb-en.
[15] OECD (2025), OECD Skills Outlook 2025: Building the Skills of the 21st Century for All, OECD Publishing, Paris, https://doi.org/10.1787/26163cd3-en.
[6] OECD (2025), Results from TALIS 2024: The State of Teaching, TALIS, OECD Publishing, Paris, https://doi.org/10.1787/90df6235-en.
[13] OECD (2025), “Teacher support for student learning: Insights from PISA”, OECD Education Policy Perspectives, No. 124, OECD Publishing, Paris, https://doi.org/10.1787/97b3a899-en.
[23] OECD (2024), What Does Child Empowerment Mean Today?: Implications for Education and Well-being, Educational Research and Innovation, OECD Publishing, Paris, https://doi.org/10.1787/8f80ce38-en.
[2] OECD (2023), PISA 2022 Results (Volume I): The State of Learning and Equity in Education, PISA, OECD Publishing, Paris, https://doi.org/10.1787/53f23881-en.
[8] OECD (2023), PISA 2022 Results (Volume II): Learning During – and From – Disruption, PISA, OECD Publishing, Paris, https://doi.org/10.1787/a97db61c-en.
[3] OECD (2015), Students, Computers and Learning: Making the Connection, PISA, OECD Publishing, Paris, https://doi.org/10.1787/9789264239555-en.
[1] OECD (2012), “Does Money Buy Strong Performance in PISA?”, PISA in Focus, No. 13, OECD Publishing, Paris, https://doi.org/10.1787/5k9fhmfzc4xx-en.
[24] Przybylski, A., A. Orben and N. Weinstein (2020), “How Much Is Too Much? Examining the Relationship Between Digital Screen Engagement and Psychosocial Functioning in a Confirmatory Cohort Study”, Journal of the American Academy of Child & Adolescent Psychiatry, Vol. 59/9, pp. 1080-1088, https://doi.org/10.1016/j.jaac.2019.06.017.
[26] Przybylski, A. and N. Weinstein (2017), “A Large-Scale Test of the Goldilocks Hypothesis”, Psychological Science, Vol. 28/2, pp. 204-215, https://doi.org/10.1177/0956797616678438.
[11] Salinas, D. (2017), “How do schools compensate for socio-economic disadvantage?”, PISA in Focus, No. 76, OECD Publishing, Paris, https://doi.org/10.1787/a77ee9d5-en.
[21] Schörner, K. and F. Bittmann (2023), “Children’s aspirations, their perceptions of parental aspirations, and parents’ factual aspirations—gaining insights into a complex world of interdependencies”, European Sociological Review, Vol. 40/6, pp. 981-995, https://doi.org/10.1093/esr/jcad074.
[7] Staksrud, E., S. Livingstone and K. Ólafsson (2026), Use, Views and Worries on Age Bans on Social Media: Responses from 29,169 children in 19 European countries, EU Kids Online V, http://www.eukidsonline.net.
[5] Zancajo, A., A. Verger and P. Bolea (2022), “Digitalization and beyond: the effects of Covid-19 on post-pandemic educational policy and delivery in Europe”, Policy and Society, Vol. 41/1, pp. 111-128, https://doi.org/10.1093/polsoc/puab016.
← 1. Policy areas typically reported in PISA but not explicitly addressed in this chapter are documented in the online tables in Annex B1. These include, among others, the vertical and horizontal stratification of education systems (such as grade repetition, vocational instructional programmes and ability grouping), decentralisation and school autonomy, accountability mechanisms, private schooling and school choice, the use of student assessments, and school improvement strategies.
← 2. In PISA, school digital resources are defined broadly. They include digital devices such as desktop and laptop computers for students and teachers, tablets, e-book readers and smartphones; digital infrastructure such as Internet access, learning management systems or school learning platforms; and educational software that supports activities like finding information, writing texts, carrying out calculations, creating presentations and working collaboratively with others.
← 3. Computer availability in school as measured in PISA can reflect both school-owned infrastructure or some other institutional arrangements, such as the provision of personal computer to each student.
← 4. On average across OECD countries, and in 27 countries and economies, schools in rural areas report higher levels of computer availability per student than those in urban areas (Table I.B1.4.1). Among these countries and economies, the gap ranges from 1 to 12 additional computers per 10 students in rural schools. A similar pattern is observed across socio-economic backgrounds. On average across OECD countries and in 28 countries and economies, disadvantaged schools report higher levels of computer availability than advantaged schools, with the differences ranging from 0.3 to 10 more computers per ten students (Table I.B1.4.1). This pattern may reflect lower student numbers in rural schools, targeted policies to increase digital access in disadvantaged contexts, or greater reliance in advantaged or urban schools on privately owned devices. This does not however account for potential differences between urban and rural schools or advantaged and disadvantaged schools in terms of quality of hardware, and quality and speed of broadband connection which can vary widely across and within OECD countries (OECD, 2024[23]).
← 5. There is a strong negative correlation between the percentage of students in schools whose principal reported that the school's capacity to provide instruction is hindered to some extent or a lot by a lack of digital resources and the country’s per capita GDP, across OECD countries (r= -0.58) and across all countries and economies (r = -0.69). The correlation between per capita GDP and the share of students in schools whose principal reported that the school's capacity to provide instruction is hindered to some extent or a lot by inadequate or poor quality digital resources is also negative and strong across OECD countries (r = -0.57) and across all countries and economies (r = -0.69).
← 6. A public–private gap is observed in 50 out of 77 countries with available data, and a socio‑economic gap in 39 out of 87 countries (Table I.B1.4.7). In most countries and economies, no rural-urban gap is found; but in 11 countries and economies, rural school principals reported more shortages than in urban schools, whereas in 9 countries and economies, urban schools reported more shortages of digital devices.
← 7. In 2025, there were on average 12 computers with internet connection per 10 teachers across OECD countries. This ranged from over 20 computers per 10 teachers in a few countries and economies to as few as 3 in several education systems (Table I.B1.4.12). Compared to PISA 2022, the average number of computers per teacher increased by between 1 to 5 computers per 10 teachers in several countries/economies. Declines of a similar magnitude were observed in only a few education systems.
← 8. This is measured by the index of schools’ capacity to enhance teaching and learning using digital devices, based on principals’ reports on whether their school has adequate digital devices, Internet access, software and technical support, as well as teachers with adequate skills, time and resources to integrate digital tools into instruction.
← 9. These findings hold even after accounting for socio-economic status. Differences are slightly reduced, reflecting the over-representation of students from socio-economically disadvantaged background and disadvantaged schools among those reporting not using digital devices for learning at school in most PISA-participating systems (Table I.B1.4.26).
← 10. These results are consistent with the findings observed in PISA 2022 (OECD, 2023[8]) and are consistent with literature on digital engagement and adolescent mental well-being (Przybylski and Weinstein, 2017[26]; Brannigan et al., 2022[28]) that suggest that both high and low use may have a negative relationship with mental well-being.
← 11. Digital distraction is negatively related to students’ sense of belonging at school in all participating countries and economies, even after accounting for students’ and schools’ socio‑economic profile (Table I.B1.4.45). After adjustment, negative relationships also remain widespread for perseverance (in more than 90% of countries and economies), goal setting (in around 75%), and for help seeking (in 60%). While curiosity is negatively related to digital distraction in most countries and economies, this relationship remains negative in fewer than half of participating countries and economies after accounting for socio-economic factors.
← 12. The correlation across all countries and economies is around 0.3 before and after accounting for GDP per capita (Table I.B1.4.186). The associations were no longer statistically significant across all countries and economies (r = 0.14; partial r = 0.10), after excluding the three countries and economies identified as outliers in terms of the joint changes in the prevalence of cell phone bans and the percentage of students spending up to one hour per day using digital devices for leisure at school between 2022 and 2025 (see Annex A3 for details), namely the Dominican Republic, Hungary and New Zealand*.
← 13. Disadvantaged schools’ principals reported fewer teacher staff shortages than their colleagues in advantaged schools in only nine countries/economies (Table I.B1.4.73).
← 14. Time students spend on science homework has decreased on average across OECD countries by about 6 minutes, representing a 13% relative decline compared to 2022 (Table I.B1.4.97). This decline is driven by a 7 percentage‑point increase in the proportion of students spending less than 30 minutes per day on their science homework. Average science homework time decreased in around three-quarters of countries/economies with available data, and increased in 7 countries/economies: Georgia, Viet Nam, Israel, the Palestinian Authority, the Ukrainian regions (17 of 27), Latvia and Portugal.
← 15. On average across OECD countries and in 42 countries/economies, students in socio-economically disadvantaged schools reported higher levels of teacher support than their peers in advantaged schools, suggesting that teachers may compensate for disadvantage through supportive practices (Table I.B1.4.114). In 11 countries/economies, however, students in disadvantaged schools reported lower levels of teacher support, potentially reinforcing existing inequalities.
← 16. The absence of system-level correlation between the change in the index of teacher support and the change in science performance between 2015 and 2025 might nonetheless be driven by the presence of outliers. Across all countries and economies, the Spearman raw and partial correlations between these two changes were positive and statistically significant at the 5% level (r = 0.30, partial r = 0.28; see Annex A3 for details).
← 17. As in previous PISA assessments, socio-economically advantaged students and girls tend to report that they receive similar or more family support compared to disadvantaged students and boys, in all countries/economies but Kenya, where disadvantaged students report more family support than their advantaged peers (Table I.B1.4.121). Students with an immigrant background, in vocational and in lower secondary education, also tend to report less family support on average across OECD countries, although there is much more heterogeneity across countries and economies.
← 18. Disciplinary climate in science lessons is measured with reference to a specific science subject chosen by students in the questionnaire. As a result, although these indicators pertain to science lessons in general, they may refer to different science subjects across countries, depending on student choices and curriculum structure. This point also applies to other indicators based on “science lessons”, such as teacher support.
← 19. An index was constructed in 2015 with an average of 0 and standard deviation of 1 across OECD countries; a comparable index of disciplinary climate in science lessons was created in 2025.
← 20. The associations were no longer statistically significant across all countries and economies (r = 0.13; partial r = 0.15), after excluding the three countries and economies identified as outliers in terms of the joint changes in disciplinary climate and science performance between 2015 and 2025 (see Annex A3 for details), namely Korea, Kosovo and Türkiye.
← 21. No relationship with science performance is observed for Korea, Sweden, Chinese Taipei, Viet Nam and Latvia after accounting for socio-economic profile (Table I.B1.4.136).
← 22. Before accounting for students’ and schools’ socio-economic profile, the only exceptions are cases in which no statistically significant relationships are observed, namely in New Zealand*, Macao (China), Türkiye, Singapore, Morocco and Ireland for curiosity, Brunei Darussalam and Uruguay for goal setting, and the Philippines, Bulgaria, Paraguay and the Dominican Republic for help seeking.
← 23. The associations were no longer statistically significant across all countries and economies (r = 0.14; partial r = 0.17), after excluding the four countries and economies identified as outliers in terms of their joint average values in disciplinary climate and science performance (see Annex A3 for details), namely Korea, Japan, B‑S‑J‑Z (China), Kenya (only before accounting for GDP per capita) and Saudi Arabia (only after accounting for GDP per capita). However, the Spearman correlations (including outliers) remain similar to the Pearson correlations (including outliers), suggesting that the observed associations are not driven by the extremity of their values.
← 24. PISA 2025 asked students how often (“never or almost never”, “a few times a year”, “a few times a month”, “once a week or more”) during the 12 months prior to the PISA test they had had the following experiences in school: “Other students made fun of me” (verbal bullying); “I was threatened by other students” (verbal/physical bullying); “I got hit or pushed around by other students” (physical bullying); and “Other students spread nasty rumours about me” (relational bullying). While these forms of bullying were measured in previous waves, PISA 2025 also introduced a new item on cyberbullying: “Information about me that was upsetting was published online without my consent”.
← 25. While those patterns are observed in many education systems, no socio-economic gap in bullying is observed in 47 countries and economies, while in 12 countries and economies, advantaged students report higher levels of bullying victimisation. Costa Rica is the only country where girls report more exposure to bullying than boys.
← 26. In 51 out of 75 countries and economies with available data, the share of students reporting being victims of bullying at least a few times a month increased for at least one form of bullying with trend data, while remaining stable for the other forms (Table I.B1.4.143). Increases in at least three of the four forms of bullying were observed in 33 education systems. By contrast, bullying prevalence decreased in only 9 countries and economies for at least one form of bullying, and remained stable for the other forms.
← 27. The share of students reporting being victims of bullying at least a few times a month decreased across all forms of bullying with trend data in 33 out of 68 countries/economies compared to 2018, and across three out of four forms of bullying in 8 countries/economies (while the prevalence of the other form remained stable).
← 28. Being the victim of cyberbullying, traditional bullying or a combination of the two is associated with internalising and externalising symptoms (Chudal et al., 2021[22]), which can include symptoms of depression and anxiety, subjective health and somatic complaints, as well as self-esteem (Gottschalk, 2022[17]). Factors such as low self-esteem, low empathy, reduced life satisfaction and loneliness have been assessed as both predictors and outcomes of cyberbullying (Kasturiratna et al., 2024[27]).
← 29. Negative school climate is measured using school principals’ responses regarding the extent to which the following behaviours are a problem in their school: “Cheating”; “Profanity”; “Vandalism”; “Theft”; “Intimidation or verbal abuse among students (including texting, emailing, etc.)”; “Physical injury caused by students to other students”; “Intimidation or verbal abuse of teachers or non-teaching staff (including texting, emailing, etc.)”; and “Physical injury caused by students to teachers or non-teaching staff”. An index was constructed from these responses, with higher values indicating that problem behaviours contribute more strongly to a negative school climate, and lower values indicating that such behaviours have a lesser impact on the school climate.
← 30. A positive relationship between truancy and science performance is observed in the United Arab Emirates, even after accounting for students’ and schools’ socio-economic profiles, although its magnitude is reduced by 40% compared to raw performance differences, suggesting possible self-selection into truancy in the two weeks preceding the PISA test. This relationship appears to be driven by students reporting that they skipped a whole day of school, while those who report skipping some classes tend to score lower than their peers on average (Table I.B1.4.162). Contrary to most countries and economies, truancy is more prevalent among students in socio-economically advantaged, private, and urban schools in the United Arab Emirates (Table I.B1.4.160). While similar differences were observed in PISA 2022, where the association with performance was negative, their magnitude were smaller. This may indicate that the prevalence of truancy in the United Arab Emirates, in the two weeks preceding the test, is linked to contextual factors associated with higher performance, rather than reflecting a positive effect of truancy itself.
← 31. Outliers may account for the observed absence of consistent associations between changes in these variables (see Annex A3 for details). After excluding these outliers, countries and economies that experienced larger increases in the share of students reporting that they had skipped classes or arrived late for school in the two weeks prior to the PISA assessment tended to show larger declines in science performance relative to both 2018 and 2022. This pattern holds both before and after accounting for differences in GDP per capita across countries and economies (lateness: comparison with 2018: r = -0.35; partial r = -0.34; comparison with 2022: r = -0.24; partial r = -0.22. Skipping class: comparison with 2018: r = -0.36; partial r = -0.35; comparison with 2022: r = -0.36; partial r = -0.34). Increases in the prevalence of whole-day skipping are also negatively associated with changes in science performance after excluding outliers, although this association is only observed comparing PISA 2025 with PISA 2022 (r = -0.36; partial r = -0.37).