This chapter examines student performance in the PISA 2025 assessment in science, reading and mathematics, across participating countries and economies. It also reports student performance in computational problem solving. It explores variations in performance within and between countries and economies, and between schools and students. The chapter also looks at variation in performance in PISA assessments over time, comparing 2022 and 2025 results as well as long-term trends over the past decade. Finally, the chapter explores PISA results related to two dimensions of equity in education – inclusion and fairness – in participating countries and economies.
PISA 2025 Results (Volume I)
Future-Ready Students

Abstract
B-S-J-Z (China) and Singapore were the two highest-performing systems across science, mathematics and reading in PISA 2025. B-S-J-Z (China) had the highest mean scores in science (597 points) and mathematics (612 points), while Singapore performed the highest in reading (535 points).
Around three-quarters of students across OECD countries demonstrated at least baseline proficiency in science: rather than simply knowing about science, students use scientific knowledge in ways that demonstrate basic scientific literacy. However, relatively few (7%) reached the highest proficiency levels. In 11 systems, over 75% of students performed below Level 2, whereas 7 systems had less than 15% of students below baseline.
In computational problem solving, students in B-S-J-Z (China), Macao (China) and Singapore had the highest mean scores (572, 563 and 560 mean score points, respectively). Around 26% of students across OECD countries reached the two highest proficiency levels (Levels 5 or 6), while 5% performed below Level 1.
Average science performance remained broadly stable between 2022 and 2025, while declines in reading and mathematics continued. On average across 35 OECD countries, science performance did not change, while reading performance fell by about 14 score points and mathematics by 9 points.
PISA 2025 recorded the lowest OECD-average performance observed so far in all three core domains. Reading performance declined after its peak around 2012, science declined more gradually over the past decade, and mathematics fell especially sharply after 2018.
Between 2022 and 2025, the narrowing of socio-economic gaps largely reflected declines among advantaged students rather than improvements among disadvantaged students. In science, disadvantaged students’ performance remained stable while advantaged students’ performance declined by 8 points. In reading, disadvantaged students’ performance declined by 4 points, compared with a 20-point decline among advantaged students. In mathematics, advantaged students’ performance declined by 14 points, while the change among disadvantaged students was not statistically significant.
Socio-economic background remains strongly associated with student achievement. On average across OECD countries, socio-economic status accounted for 12% of within-country variation in science performance; 37% of disadvantaged students were low performers in science, compared with 12% of advantaged students.
Some education systems simultaneously demonstrate inclusion, socio-economic fairness and strong performance. Seven systems – B-S-J-Z (China), Canada*, Estonia, Ireland, Japan, Korea and Macao (China) – combined inclusion above 75%, less than 10% of science-performance variation associated with socio-economic status, and above-OECD-average performance.
Science showed almost no gender gap in average performance scores, but this concealed contrasting patterns at opposite ends: girls performed 12 points higher among the lowest-achieving students, while boys performed 10 points higher among the highest-achieving students. Girls outperformed boys in reading by 30 points on average across OECD countries, while boys outperformed girls in mathematics by 13 points.
On average across 29 OECD countries, 41% of immigrant students were socio-economically disadvantaged, compared with 21% of non-immigrant students, and 71% of first-generation immigrant students mainly spoke a language at home that differed from the assessment language. After accounting for socio‑economic status and language spoken at home, immigrant students outperformed non-immigrant students in science in 13 systems, while the difference was not statistically significant in another 10 systems.
This chapter examines student performance in the PISA 2025 assessment. PISA measures student performance as the extent to which 15-year-old students have acquired the knowledge and competencies that are essential for full participation in modern societies. The first section reports the average performance in science, reading and mathematics, as well as computational problem solving1, for each country and economy, comparing it with the performance of other countries and economies. It also explores variations in performance within and between countries and economies. The second section examines changes in performance between the 2022 and 2025 PISA assessments. It also discusses long-term trends in student performance in PISA stretching over a decade. The final section of this chapter covers two dimensions of equity in education – inclusion and fairness – and looks at changes over time among countries and economies that participated in PISA 2025 and in previous assessments.
Average performance in science, reading and mathematics
In PISA 2025, students scored 482 points in science, on average across OECD countries (Table I.B1.2a.1). Students at this average score are at a proficiency level where they can use scientific ideas, evidence and representations to construct or evaluate explanations, simple models, investigations and conclusions when given appropriate support. They can also interpret simple data, identify strengths, limitations or flaws in models and research, and choose suitable methods or sources of evidence. They can justify their choices using relevant evidence and basic criteria for evaluating the credibility of sources (see the section: What students can do in science) (Table I.2.2).
Students in B-S-J-Z (China) (597 points) and Singapore (560 points) scored higher in science than students in all other countries/economies that participated in PISA 2025 (Table I.2.1). On average, these students are able to engage with broader and more demanding scientific ideas, more complex investigations and sources. They are expected not only to interpret or choose evidence, but also to evaluate claims, identify errors and describe flaws.
Science was the major domain in PISA 2025, but performance in mathematics and reading provides important additional context for comparing education systems across the core domains.
In mathematics, students scored 463 points on average across OECD countries. In B-S-J-Z (China), students performed the highest in mathematics (612 points), while the second-highest was achieved by students in Singapore (563 points). In reading, the ordering is reversed for students in Singapore, who had the highest mean performance (535 points), followed by B-S-J-Z (China) (527 points) – across OECD countries, students scored 461 points in reading, on average (Tables I.B1.2a.2 and I.B1.2a.3).
Table I.2.1, I.2.o1 (online) and I.2.o2 (online) show each country’s/economy’s average score and indicate which peer systems differ statistically significantly2 from each other.
 Significantly above the OECD average
 Not statistically different from the OECD average
 Significantly below the OECD average
Countries and economies are ranked in descending order of the mean performance in science.
Source: OECD, PISA 2025 Database, Table I.B1.2.1.
In PISA 2025, all countries and economies that performed above the OECD average in science also performed above the OECD average in mathematics and reading, with four exceptions. Belgium and Lithuania performed above the OECD average in science and mathematics but not statistically different from the OECD average in reading; while Türkiye and the United States* performed above the OECD average in science and reading but not statistically different from the OECD average in mathematics. In total, 18 countries and economies performed above the OECD average in science, mathematics and reading (Table I.2.1, I.2.o1 (online) and I.2.o2 (online)).
The distance between the highest- and lowest-performing systems provides a simple snapshot of the global range of student achievement in PISA 2025. Although purely descriptive, it helps locate each system within the broader international distribution and illustrates the scale of performance differences observed across education systems.
The gap in performance between the highest- and lowest-performing countries is 124 score points in science among OECD countries and 280 points among all education systems that took part in PISA 2025 (Table I.B1.2a.1). In reading, the performance gap between the highest- and lowest-performing countries is 103 score points among OECD countries and 234 score points among all education systems that took part in PISA 2025 (Table I.B1.2a.2). In mathematics, the corresponding gap is 145 score points among OECD countries and 301 score points among all education systems that took part in PISA 2025 (Table I.B1.2a.3).
Finally, Box I.2.2 reports estimates suggesting that students around age 15 typically gain about 20 score points over one year of schooling, i.e. this number of points could be considered to be equivalent to one school year of learning. This benchmark provides useful context when assessing changes in performance over time, but it should be interpreted cautiously and not applied mechanically to cross-country differences in mean scores.
Variation in performance within countries
Variation in student performance, as measured by the standard deviation of scores, tends to be greater among high-performing than low-performing education systems. There is a strong correlation between average performance in science and variation in performance in science (see Figure I.2.o1 (online)). For example, Cambodia has the smallest variation in science proficiency (63 score points) while several other countries and economies whose mean performance was below the OECD average also have small variations in performance3 (Table I.B1.2a.1). However, this pattern does not hold in all cases. Among countries/economies that performed above the OECD average, B‑S‑J‑Z (China), Estonia, Lithuania and Macao (China) stand out for their comparatively small variation in performance (standard deviation under 90 score points). Similarly, among countries that performed below the OECD average, Bulgaria, Israel, Luxembourg, Malta, the United Arab Emirates and Zambia stand out for their relatively large variation in performance (standard deviation greater than 105 score points).
Another measure of variation in performance within countries is the score gap that separates the highest- and lowest-performing students within a country (i.e. inter-decile range). In science, the difference between the 90th percentile of performance (the score above which only 10% of students scored) and the 10th percentile of performance (the score below which only 10% of students scored) is about 237 score points in all participating countries and economies, and 258 score points on average across OECD countries (Table I.B1.2a.1).
The largest differences between high- and low-achieving students in science are found in Luxembourg and the United States* (Figure I.2.1 and Figure I.2.o1 (online)). In these countries, the inter-decile range is over 290 score points, indicating that student performance in science is highly unequal among 15-year-old students. By contrast, the smallest differences between high- and low-achieving students are often found among countries and economies with low mean performance (i.e. lower than 410 points), as in Cambodia, Dushanbe (Tajikistan), Indonesia, Kosovo and the Kurdistan Region (Iraq). In these countries, the 90th percentile of the science distribution is below the OECD average score (Table I.B1.2a.1). In some lower-performing systems, smaller differences between high- and low‑achieving students may reflect a compressed performance distribution, in which relatively few students reach high levels of proficiency and even the 90th percentile remains below the OECD average.
Mean score in science at the 10th, 25th, 50th, 75th and 90th percentiles of performance distribution

Notes: All differences between the 90th and the 10th percentiles are statistically significant (see Annex A3).
Countries and economies are ranked in descending order of the performance in science at the 50th percentile.
Source: OECD, PISA 2025 Database, Table I.B1.2a.1. See https://stat.link/xgs41b for the underlying data.
Performance differences among schools and students
Examining variation in performance between and within schools is important, because it shows whether performance gaps are mainly structured by school attendance or are predominantly found among students within the same school. When a large share of variation lies between schools, students’ outcomes differ substantially depending on the school they attend. When most variation lies within schools, differences in performance are found mainly among students attending the same school. This distinction helps identify whether policy efforts need to focus primarily on differences between schools, differences among students within schools, or both.
Percentage of variation in science performance between and within schools

Notes: This figure is restricted to schools with the modal ISCED level for 15-year-old students.
Countries and economies are ranked in descending order of the variation in science performance between schools.
Source: OECD, PISA 2025 Database, Table I.B1.2a.25. See https://stat.link/xgs41b for the underlying data.
Out of the variation observed within countries in PISA 2025, 31% of the OECD-average variation in science performance is between schools (Figure I.2.2); while 69% is within schools. This means that, on average and in most countries/economies, school characteristics may play a less dominant role in explaining differences in student performance than student-level and classroom-level characteristics. These could include students’ background, dispositions and learning behaviours, as well as differences associated with grade level, student grouping within the same school.
However, the extent of between-school variation in science performance differs widely across countries and economies. In three countries and economies, between-school differences account for less than 10% of the total variation in performance (Iceland, Finland and Norway*, in ascending order). By contrast, in ten other countries (Zambia, the Netherlands*, Kenya, Bulgaria, Türkiye, Rwanda, Hungary, the Slovak Republic, Germany and G710Romania, in descending order), differences between schools account for at least 50% of the total variation in the system’s performance. This suggests that education systems in the latter group are more academically segmented, with high- and low-performing students more likely to be concentrated in different schools.
What students can do in science
PISA defines a scientifically educated person as someone who can engage in reasoned discourse about science, sustainability and technology to inform action (OECD, 2023[1]). Such an individual is educated to be an informed, critical user of scientific knowledge throughout their life, without necessarily becoming a producer of scientific knowledge. Such individuals possess an understanding of major scientific concepts, the standard practices of scientists, the degree to which scientific claims are justified, and the social mechanisms that make scientific knowledge trustworthy. This empowers them to evaluate the credibility of scientific information, make informed personal decisions, and play a role in societal choices impacting the environment.
To successfully demonstrate these competencies, three distinguishable but related forms of knowledge are required:
Content knowledge: An understanding of the scientifically established facts, concepts, ideas and major explanatory theories about the natural and material world.
Procedural knowledge: A familiarity with the standard procedures and practices that scientists use to obtain reliable and valid data. This involves familiarity with the concepts underlying empirical enquiry, such as identifying variables, repeating measurements to minimise uncertainty, and knowing how to appropriately represent and communicate data.
Epistemic knowledge: An understanding of how scientific claims are justified and the rationale behind the procedures scientists use. This requires grasping the role of observations, models, theories and arguments, as well as understanding the collaborative nature of science, the importance of peer review, and how scientific consensus establishes trustworthy knowledge.
A scientifically educated person applies their knowledge in real-world personal, local or global contexts. For such application, PISA identifies three specific competencies (see Box I.2.1):
Explain phenomena scientifically: The ability to recognise, construct and evaluate explanations and models for natural and technological phenomena.
Construct and evaluate designs for scientific enquiry and interpret scientific data and evidence critically: The ability to appraise how questions are investigated scientifically and to critically interpret data.
Research, evaluate and use scientific information for decision making and action: The ability to find information, evaluate its credibility and potential flaws, and use it to inform decisions.
To assess how scientifically educated 15-year-old students are, the PISA 2025 science assessment scale is divided into descriptive proficiency levels, ranging from Level 6 (the highest) down to Level 1b (the lowest). Table I.2.2 illustrates the range of science competencies covered by the proficiency levels and describes the skills, knowledge and understanding required at each aggregated level (the full science proficiency descriptors for PISA 2025 are included in Table I.2.o7 (online), in Table I.2.o8 (online) for reading and in Table I.2.o9 (online) for mathematics).
Source: OECD, PISA 2025 Database, Table I.B1.2a.10.
In PISA, proficiency Level 2 is considered the baseline level of proficiency students need to participate meaningfully in society. Level 2 is regarded as the baseline level of proficiency because it marks the point at which students use scientific knowledge in ways that demonstrate scientific literacy: they pass from knowing some science to using science at a basic level.
Below this level, students may demonstrate some familiarity with scientific ideas or recognise simple information in familiar contexts. At Level 2, however, students are expected to go further: they can use scientific knowledge to provide simple explanations of everyday phenomena, evaluate basic aspects of scientific enquiry, and identify relevant information or evidence to support a conclusion, as well as justify its use. In this sense, Level 2 represents a shift from knowing to using science, even if at a basic level. It provides a meaningful reference point for assessing whether students can apply scientific knowledge to explain, interpret and evaluate straightforward situations. More specifically, at Level 2, students can use science to:
Distinguish an appropriate scientific explanation from a non-scientific one.
Give a simple scientific explanation of an everyday phenomenon.
Evaluate simple enquiry designs.
Interpret simple data relationships, including outliers.
Identify evidence in a graph or table that supports a claim.
Select a relevant information source for a science-related decision.
Judge source credibility using a basic scientific criterion, such as expertise, scientific consensus or basic science.
Level 2 is the point at which students are beginning to use science as a tool for reasoning: explaining, interpreting, evaluating and making decisions in familiar real-world situations. The baseline is therefore meaningful because it represents a threshold of functional science literacy.
Students who do not attain baseline Level 2 are referred to in this report as “low performers”. Low-performing students are at greater risk of having weaker mastery of the foundational skills needed for further learning and meaningful participation in society, placing them at greater risk of adverse educational and labour-market outcomes later in life (OECD, 2016[2]; OECD, 2023[3]; OECD, 2025[4]).
As shown in Figure I.2.3, on average across OECD countries, 74% of students scored at Level 2 or above in science proficiency. In 16 countries and economies, at least 80% of students scored at Level 2 or above.
The proportion of top-performing students indicates how successful systems are in not only securing basic skills for the majority, but also in nurturing advanced proficiency. Some 7% of students attained the highest proficiency levels, Level 5 or 6, in science on average across OECD countries. In 14 countries/economies, the share of top performers in science was over 10%.
On average across OECD countries, 26% of students did not reach the baseline proficiency Level 2 in science (Table I.B1.2a.10). In seven countries and economies, less than 15% of students performed below baseline proficiency (B-S-J-Z (China), Macao (China), Singapore, Estonia, Japan, Chinese Taipei and Korea, in ascending order of the proportion of low performers). In these seven systems, most of the relatively few low-performing students scored at Level 1a, the highest proficiency level below baseline, meaning that few students performed far below the baseline in science. Over 75% of students performed below baseline proficiency in 11 systems; among them, over 10% of students performed below Level 1b in Dushanbe (Tajikistan), Kenya, Paraguay, Rwanda and Zambia. The share of students below Level 1b also exceeded 10% in Lebanon, although fewer than 75% of students in that system performed below baseline proficiency overall.
These results show that mean performance and distribution across proficiency levels provide complementary information about the quality and inclusiveness of education systems. A system may perform well on average because many students reach high levels of proficiency, because few students fall below baseline expectations, or both. Conversely, lower mean performance often coincides with a larger concentration of students below Level 2, indicating that weak overall performance is closely linked to difficulties in ensuring that a broad majority of students acquire foundational scientific competencies.

Notes: Cambodia, Dushanbe (Tajikistan), the Kurdistan Region (Iraq), Mauritius, Rwanda and Zambia used a paper-based version of the PISA assessment (see Annex A5).
Countries and economies are ranked in descending order of the percentage of students who performed at or above Level 2.
Source: OECD, PISA 2025 Database, Table I.B1.2a.10. See https://stat.link/xgs41b for the underlying data.
Each item in the PISA 2025 science assessment was classified into one of the three science competency subscales:
Explain phenomena scientifically: The ability to recognise, construct and evaluate explanations and models for natural and technological phenomena.
Construct and evaluate designs for scientific enquiry and critically interpret scientific data and evidence: The ability to appraise how questions are investigated scientifically and to critically interpret data, assessing its reliability and limitations and synthesising findings.
Research, evaluate and use scientific information for decision making and action: The ability to find information, evaluate its credibility and potential flaws, and use it to inform decisions.
The relative strengths and weaknesses of each country’s/economy’s education system are analysed by looking at differences in mean performance across the PISA science competency subscales. This gives a more refined indication of the aspects of scientific literacy in which each system stands out more, or less, relative to other participating systems.
On average across the OECD, students’ relative scores are more favourable in explaining phenomena scientifically and in researching, evaluating and using scientific information for decision making and action than they are in constructing and evaluating designs for scientific enquiry (Table I.2.3). This means that, compared with other participating systems, OECD countries tend to have a more favourable position in the first and third subscales than in the second.
Across all participating systems, the picture is mixed. In the largest group of systems (23), students perform relatively better in researching, evaluating and using scientific information for decision making and action than in the other two subscales. However, this is only slightly better than explaining phenomena scientifically, which is the strongest competency in 22 systems. Constructing and evaluating designs for scientific enquiry is least often the strongest area, but only by a small margin, occurring in 18 systems. Only in Korea and the United Arab Emirates do students perform equally across the three subscales. These results should not be read as showing that one science competency is generally stronger or weaker than the others in an absolute sense. They show, instead, where each system stands out most when its performance on each subscale is compared with that of other participating systems.
A closer look at the 14 highest-performing systems in science (i.e. those with mean scores of 500 points or above) shows that the profile of relative strengths also varies within this group. In B-S-J-Z (China), Estonia and Macao (China), the strongest competency is constructing and evaluating designs for scientific enquiry, compared with the other two subscales. This same competency ranks second in Japan and Chinese Taipei, indicating a profile that differs from that observed in most other high-performing systems. In half of these systems (7 out of 14), the strongest competency is instead researching, evaluating and using scientific information for decision making and action; this subscale ranks second in a further three systems. By contrast, explaining phenomena scientifically is the strongest relative area only in Japan and Chinese Taipei, although it ranks second in seven of the highest-performing systems.
Overall, these PISA 2025 results show that countries and economies differ in the profile of science competencies they display, even when they achieve similar overall levels of performance. More generally, no single subscale emerges as the strongest competency in a clearly dominant number of systems. Rather, education systems differ in the aspect of scientific literacy in which they stand out most compared with other participating systems.
At the same time, these findings should be interpreted with caution. They describe differences across subscales within each system, not large absolute gaps in competence. A subscale that ranks lower within a country or economy may still reflect strong performance in absolute terms, particularly among the highest-performing systems. Even so, the subscale results add nuance to the interpretation of overall science performance by showing that similar mean scores may mask different internal profiles of strength across the three dimensions of scientific literacy.
1. Relative strengths that are statistically significant are highlighted in a darker tone; empty cells indicate cases where the standardised subscale score is not significantly higher compared to other subscales, including cases in which it is lower. A country/economy is relatively stronger in one subscale than another if its standardised score, as determined by the mean and standard deviation of student performance in that subscale across all participating countries/economies, is significantly higher in the first subscale than in the second subscale. Science competency subscales are indicated by the following abbreviations: eps - explain phenomena scientifically; ede - evaluate designs for scientific enquiry; eid - evaluate scientific information for decision making.
Only countries and economies where PISA 2025 was delivered on computer are shown. Countries/economies that have implemented the paper-based test do not have enough cognitive data to compute these subscales.
Although the OECD mean is shown in this table, the standardisation of subscale scores was performed according to the mean and standard deviation of students across all PISA-participating countries/economies.
The standardised scores that were used to determine the relative strengths of each country/economy are not shown in this table.
Countries and economies are ranked in descending order of mean science performance.
Computational problem solving
In PISA 2025, a novel assessment was included to test computational problem solving. It focuses on students’ capacity to engage in an iterative and self-regulated process of knowledge building and problem solving using computational tools and practices. Students complete two extended test units, during which they solve increasingly complex tasks and have access to learning resources such as tutorials, feedback and examples.
Students’ performance on the computational problem-solving scale describes the extent to which students can solve problems using computational tools, such as modelling or programming tools, and through computational practices, such as conducting experiments, analysing data, and building and debugging computational artefacts. Students’ performance on the test is supported by self-regulated learning, which includes how they maintain their motivation and task engagement, monitor their progress and adapt their strategies, and evaluate their own performance. A student's ability to succeed in the digital world is greatly influenced by their self-regulated learning competencies, i.e. how they manage their own learning, and, crucially, whether they can maintain their motivation and stay engaged with a task, even when it becomes challenging or frustrating.4
In computational problem solving, the average score among OECD countries is 500 score points (Table I.B1.2a.4). The highest-performing education systems are Macao (China), Singapore, B-S-J-Z (China), Japan, Chinese Taipei and Hong Kong (China) (in descending order and all above 545 score points). Australia, Estonia, Japan, Korea and New Zealand* are the top OECD countries (above 530 score points) (Table I.2.4). In addition to these ten countries and economies, another 15 education systems also performed above the OECD average in computational problem solving, ranging from Canada* (mean score of 525 points) to Luxembourg (mean score of 506 points).
Systems that consistently perform above the OECD average across assessment domains can be considered to demonstrate broad-based achievement. Consistent with the pattern observed earlier for science, mathematics and reading, almost all countries and economies that performed above the OECD average in computational problem-solving also performed above the OECD average in science, except for Denmark, Latvia, Luxembourg and the Netherlands*. Similarly, all countries and economies that performed above the OECD average in computational problem solving also performed above the OECD average in mathematics and reading, except for Latvia and Luxembourg, and except in reading only for Belgium, Denmark, Lithuania and the Netherlands*, and the United States* for mathematics only (Table I.2.1, I.2.o1 (online), I.2.o2 (online) and Table I.2.4).
Finally, to assess 15-year-old students’ computational problem-solving skills, the PISA 2025 assessment scale is divided into descriptive proficiency levels, ranging from Level 6 (the highest) down to below Level 1 (the lowest). The main assessment scale represents students’ overall computational problem-solving ability and reflects progress in both block-based programming and computer modelling. More specifically, it looks at whether students can carry out practical actions such as conducting systematic experiments, analysing the resulting data, and building or debugging their digital creations (the full computational problem-solving proficiency descriptors for PISA 2025 are included in Table I.2.o10 (online)).
Students performing below Level 1 are still largely exploring the software interface in a rudimentary way, rather than working towards a specific goal. Once they reach Level 1, they begin to interact with these tools at a surface level. They may make minor modifications to simple programs or adjust a single input in a basic model to observe what happens. This is still a relatively elementary form of manipulation of the digital environment.
At Levels 2 and 3, students begin to make more meaningful progress. At Level 2, they start to use simple operations, such as instructing a program to repeat an action, and begin testing out ideas. By Level 3, they combine a wider range of commands to build functional programs. At this level, students also begin to conduct basic, controlled experiments in order to infer simple relationships between different factors in a model. Although there is no formal baseline proficiency threshold on this scale, Level 3 can be regarded as a useful benchmark, as it marks the point at which students begin to demonstrate sufficiently solid knowledge and skills to progress more rapidly.
At Level 4, students are able to build moderately complex programs and models. They begin to exploit repeated patterns in their code, even if their solutions may still contain minor bugs or inefficiencies. Levels 5 and 6 can be considered the range of top performers. By Level 5, programming and modelling are relatively sophisticated, while Level 6 represents highly developed proficiency. Students at this level are efficient computational problem solvers who can produce optimal, problem-free programs without unnecessary redundancy.
Across OECD countries, about one-quarter of students can be considered top performers in computational problem solving (26%). A further 21% reach Level 4 and 17% reach Level 3, while 13% perform at Level 2 and 17% at Level 1. Only 5% perform below Level 1 (Table I.B1.2a.13).
Significantly above the OECD average
Not statistically different from the OECD average
Significantly below the OECD average
Countries and economies are ranked in descending order of the mean performance in computational problem solving.
Source: OECD, PISA 2025 Database, Table I.B1.2a.4.
How performance in computational problem solving compares to performance in science
To what extent does the PISA computational problem-solving assessment measure a different set of skills with respect to those measured in the core assessment domains?
In a context where the use of artificial intelligence is on the rise, solving problems using computational tools and practices is a fundamental skill. Across education systems, these practices are increasingly embedded within “traditional” academic domains. Because the process of building computational artefacts naturally lends itself to applying core practices and concepts from broader STEM disciplines, computational thinking is often integrated into science curricula. This highlights a strong, natural synergy between scientific inquiry and computational problem-solving skills (OECD, 2023[5]).
It can therefore be expected that student performance in computational problem-solving correlates positively with performance in other academic fields, even if the PISA 2025 computational problem-solving assessment places more emphasis on how students learn to use computational tools and apply computational practices in interactive, digital environments (OECD, 2023[5])). Students who perform well in computational problem-solving are likely to perform well in other subject areas, just as students who do not achieve high scores in science, mathematics and reading are likely to achieve low scores in computational problem-solving. At the same time, the assessment is designed to capture a set of competencies that is related to, but not reducible to, performance in other PISA domains. This section examines these associations in detail, including the relative performance of students in computational problem-solving given their performance in science, mathematics and reading.
Table I.2.5 shows the OECD average within-country correlations between student performance in computational problem-solving, mathematics, reading and science. The within-country correlation between computational problem-solving and each of the other three PISA domains is: 0.76 with science, 0.69 with reading and 0.75 with mathematics. In comparison, performance scores among the three core PISA domains are more strongly associated, especially between performance in science and mathematics (0.88). This suggests that while strongly correlated, the computational problem-solving performance measures a distinct set of skills relative to those measured in the science, reading and mathematics performance (Table I.B1.2a.19). One distinctive feature of the computational problem-solving assessment is that students can make use of feedback and resources during the test. This means that performance in this domain reflects not only what students already know, but also how effectively they can learn, adapt and respond within the assessment itself. In this respect, the interpretation of performance differs somewhat from that in the other three domains.
OECD average
Source: OECD, PISA 2025 Database, Table I.B1.2a.19.
Another way of evaluating the uniqueness of the skills measured by the computational problem-solving scale is to examine the variation in student performance in computational problem-solving that cannot be associated with their performance in another scale. On average across the OECD, around 43% of the variation in computational problem-solving performance can be uniquely associated with student performance in science (the major domain focus in PISA 2025) (Table I.B1.2a.19). This means that an important part of the variation in performance can be accounted for simply by student performance in science. At the same time, more than half of the variation in computational problem-solving remains outside its unique association with science5, which further supports the view that computational problem-solving captures additional competencies beyond those measured in another domain such as science.
In 11 countries and economies (Albania*, Armenia, Azerbaijan, Bulgaria, Georgia, Hungary, Kyrgyzstan, Lebanon, Morocco, the Palestinian Authority and Uzbekistan), less than 30% of the variation in students’ computational problem-solving performance is associated with their performance in science uniquely. In these countries and economies, more than in others, performance differences in computational problem-solving do not necessarily match those found in science. For example, some students who perform at a high level of proficiency in science achieve relatively low scores in computational problem-solving (and vice versa) in these countries/economies. By contrast, in Iceland, Brunei Darussalam, Qatar, New Zealand*, Australia, Ireland, Estonia and Canada* (in ascending order), around 50% or more of the variation in computational problem-solving performance reflects performance differences captured uniquely in the science assessment (Table I.B1.2a.19).
In some countries and economies, students had relatively higher or lower scores than expected in computational problem-solving given their scores on the other PISA assessments. In this section, the statistical concept "relative performance"6 is used to examine how well students performed in computational problem solving compared to other students who have similar science, mathematics or reading scores.
For example, if a country or economy has a positive relative score, it means that its students performed better in computational problem solving than other students with similar science proficiency in the PISA-participating countries and economies. Figure I.2.4 shows the share of students who performed above and below what would be expected given their performance in science, reading or mathematics. In Brunei Darussalam, Hong Kong (China), Macao (China), Malaysia and the Philippines, , over 70% of students scored significantly higher than expected in computational problem solving given their performance in science (Table I.B1.2a.20).
In six countries/economies (Hong Kong (China), Malaysia, Brunei Darussalam, the Philippines, Macao (China) and Iceland, in descending order), students scored over 30 points higher than expected in computational problem solving – a large relative performance advantage – after accounting for their science performance7 (Table I.B1.2a.20). These six countries/economies include education systems across different levels of the computational problem-solving performance distribution (mean scores within proficiency Levels 2 to 5), including both high- and mid-performing systems (but no low-performing ones). This suggests that relatively strong performance in computational problem-solving is not confined to the very highest-performing systems and may also be observed among systems where students display only average levels of science proficiency.
By some margin, the country with the weakest relative performance after accounting for students’ science performance is Kenya, with students scoring about 87 points lower in computational problem-solving than expected, followed by Uzbekistan, Azerbaijan and Armenia (55, 43 and 42 points lower, respectively). All countries with a negative relative performance in computational problem-solving after accounting for their science performance scored below the OECD average, except for Finland and top performer B-S-J-Z (China) (Table I.B1.2a.20).
Percentage of students performing below/above expected performance in computational problem solving

Notes: Only countries and economies with available data are shown.
Percentage of students who score below/above than expected is shown in a darker tone when it differs significantly from 50% (see Annex A3).
Countries and economies are ranked in descending order of the percentage of students performing above their expected performance in computational problem-solving compared to science.
Source: OECD, PISA 2025 Database, Table I.B1.2a.20. See https://stat.link/xgs41b for the underlying data.
Changes in mean performance between 2022 and 2025
PISA data for 2022 and 2025 show contrasting patterns of mean performance across science, reading and mathematics. On average across 35 OECD countries, mean performance did not change significantly in science between 2022 and 2025. By contrast, mean performance dropped by 9 score points in mathematics and about 14 score points in reading (Tables I.B1.2a.36, I.B1.2a.38 and I.B1.2a.37).
As shown in Table I.2.6 , science performance remained broadly stable in many countries/economies (48 out of 74) between 2022 and 2025. In contrast, in reading and mathematics, at least half of countries/economies that can compare PISA 2025 and 2022 results showed a drop in mean performance (42 and 38 out of 74 in reading and mathematics, respectively).
Note: Only countries and economies that can compare PISA 2022 and PISA 2025 results in all three subjects are shown.
Positive change
Non-significant change
Negative change
Countries and economies are ranked, in descending order of the change in science performance between 2022 and 2025.
Source: OECD, PISA 2025 Database, Tables I.B1.2a.36, I.B1.2a.37 and I.B1.2a.38.
In many cases, the drop observed over just three years exceeded 20 score points, i.e. the yearly gain in test scores that is typically observed among students around the age of 15 (see Box I.2.2). This means that 15-year-olds in these countries in 2025 scored at or below the level expected of 14-year-olds in 2022.
In science, the decline in performance exceeded 20 score points in Guatemala, Hong Kong (China), Israel and Latvia.
In mathematics, the decline in performance was most pronounced and exceeded 20 score points in Israel, Latvia, Malta, Serbia and Slovenia.
In reading, the decline in performance exceeded 30 score points in Latvia, Israel, Guatemala and Malta (in descending order). Drops between 20 and 30 score points were observed in Croatia, Czechia, Denmark, Hungary, Norway*, Paraguay, Serbia, Slovenia, Spain and Sweden.
Many more countries and economies than those listed above experienced performance declines between 2022 and 2025.
However, as shown in Table I.2.6, it is equally relevant to note that eight countries and economies improved their performance in all three subjects. Systems showing positive trends in at least one domain do not form a homogeneous group. Some are at the upper end of the average performance range in at least one domain and have sustained or improved upon already strong outcomes (e.g. Türkiye and the United Kingdom,), others are lower-performing systems that appear to be catching up (e.g. Cambodia, El Salvador, Jordan and the Philippines), sometimes by expanding access to effective schooling. Positive trends should therefore be interpreted in light of systems’ starting points, mean levels of performance, and the distribution of achievement within systems. Several of these characteristics will be analysed later on in this chapter.
New estimates based on 2015-2025 data
The average yearly learning gain of students around the age of 15 (e.g. between their 15th and their 16th birthday), can be used as a benchmark to assess the magnitude of PISA score changes over time. In earlier reports, and based on two studies providing estimates-based PISA data up to 2018 (Avvisati and Givord, 2023[6]; Avvisati and Givord, 2021[7]), this gain was estimated to amount to 20 score points, on average across 30 countries and economies (OECD, 2023, p. 156[3]). These studies also showed, however, that yearly learning gains can vary significantly across countries: in mathematics, for example, the estimates reported in Avvisati and Givord imply that the test scores of students in Austria, Scotland (United Kingdom) and Singapore increase about twice as fast as those of students in Brazil and Malaysia, which increase by about 12 points over a 12-month period.
PISA 2022 and 2025 data provide an opportunity to extend the analyses in Avvisati and Givord (2023[6]) to more countries, in particular to those countries/economies where testing dates changed over the 2015-2025 period. Table I.2.7 reports these estimates for ten countries/economies. It shows that, on average, yearly learning gains correspond to about 20 score points, regardless of the subject; with country-specific estimates ranging from around 25 points in the United Kingdom to only around 10 points in Serbia.
Readers should avoid using a single estimate to convert any difference in terms of years-of-schooling equivalents (or months-of-schooling equivalents). First, because there are significant differences in the pace of learning at a given age across countries, as is also evident from Table I.2.7. This reflects differences in how schooling is organised, the resources invested in education, and the quality of education itself. And second, because there is no reason to expect the pace of learning to remain constant over time: the average pace of learning measured at a single point in time, around age 15, may give only a limited indication of the test-score gains that can be expected in a particular country over two or three years.
Notes: Estimates are based on the methodology in Avvisati and Givord (2023[6]) and include controls for gender, socio-economic status and immigrant background. See notes under Table 2 in the original study for more details.
Source: PISA 2015, 2018, 2022 and 2025 data.
Changes in performance distributions between 2022 and 2025
The change in mean science, mathematics and reading performance across OECD countries (on average) and in most PISA-participating education systems was not uniform across low- and high-achieving students. While the average mean performance in science did not change significantly – contrasting sharply with the drops in reading and mathematics – looking only at the stable average ignores widening performance gaps. The performance gap between the highest- and lowest-achieving students in science actually widened by about 3 score points between 2022 and 2025 on average across 35 OECD countries, and by more than 15 score points between 2018 and 2025 (Table I.B1.2a.42). Indeed, PISA 2025 data suggest that scientific competencies have diminished among students on the lower end of the performance distribution, and similar issues affecting reading and mathematics could be affecting low-achieving students in science.
The 10th percentile is the point on the scale below which only 10% of students score. Likewise, the 90th percentile is the point on the scale above which only 10% of students score. The median or 50th percentile divides the performance distribution into two equal halves, one above and one below that position on the scale.
Across OECD countries, performance gaps had widened in the past, and continued to do so between 2022 and 2025. The mean scores of the lowest-performing 10% of students are the lowest reported since PISA started measuring science in 2006, on average across 35 OECD countries with comparable data across cycles. At the other end of the distribution, the mean scores of the highest-performing 10% of students have remained stable since PISA started assessing science (Table I.B1.2a.39). As a result, the gap between the highest- and lowest-performing students continued to widen; at 259 score points, it is the largest measured in PISA so far, on average, when measured by the inter-decile range (i.e. the difference between the 10th and 90th percentiles) (Table I.B1.2a.42).

Notes: Only countries and economies that can compare PISA 2022 and PISA 2025 results in science are shown.
Statistically significant differences are shown in a darker tone (see Annex A3).
Countries and economies are ranked in descending order of the change in median performance in science between 2022 and 2025.
Source: OECD, PISA 2025 Database, Table I.B1.2a.39. See https://stat.link/xgs41b for the underlying data.
In mathematics, mean performance was about 9 score points lower in 2025 compared to 2022 on average across 35 OECD countries. But the performance decline was less pronounced at the 75th and 90th percentiles (-7 and -5 score points): almost all students performed worse, but low-achieving students declined more than high-achieving students did (Table I.B1.2a.41). A similar pattern is observed in reading: the decline was slightly less pronounced at the 90th percentile (-13 score points), even if the drop was large across the score distribution (Table I.B1.2a.40). As a result, learning gaps between the highest- and lowest-performing students widened (see Chapter I, Figure I.2.6). The difference between the 10th and 90th percentiles increased by about 3 score points in reading between 2022 and 2025, but by about 8 score points in mathematics, on average across OECD countries (Tables I.B1.2a.43 and I.B1.2a.44).
The previous paragraphs refer to the average trend across 35 OECD countries; however, the distribution in performance evolved differently in different countries and economies. For example, in science, the inter-decile range widened significantly in 24 countries and economies; narrowed significantly in one (Peru); and did not change significantly in the remaining countries/economies for which comparable data for 2022 and 2025 are available (Table I.B1.2a.42).
In mathematics, the inter-decile range widened in 20 countries and economies and narrowed only in three, but did not change significantly in most countries/economies (Table I.B1.2a.44). Finally, in reading, the inter-decile range did not change significantly in most countries/economies. It widened in 10 and narrowed in 11 (Table I.B1.2a.43).
The performance distribution widened between 2022 and 2025 in all three subjects in Singapore, North Macedonia, Japan and Latvia, as well as on average across OECD countries (Tables I.B1.2a.42, I.B1.2a.44and I.B1.2a.43).
Changes in the proportion of 15-year-old students at different levels of proficiency
PISA scores in science, reading and mathematics are more than a tool to rank students and countries. Together with descriptive proficiency scales, scores give information on the level of science competencies students have mastered (see section above on What students can do in science). In science, at the highest proficiency levels, students can draw on high cognitive-demand scientific ideas to build models of complex phenomena, evaluate competing designs for scientific enquiries, and use sophisticated fact-checking procedures to critique the trustworthiness of scientific information. At the lower levels, students can identify a scientific explanation of a simple phenomenon drawing on basic scientific knowledge, information or evidence of low cognitive demand, and use basic procedural knowledge to identify the better interpretation or display of simple data (see Table I.2.2).
Trends in the proportion of low- and top-performing students indicate how their mastery of specific skills (as established in the described proficiency scale) has changed over time. Changes in the share of low-performing students indicate the extent to which school systems are advancing (or not) towards providing all students with basic skills. Trends in the share of top-performing students indicate whether education systems are making progress in ensuring that young people can successfully use their science, mathematics and reading skills to navigate a volatile, uncertain and complex environment.
As shown in Table I.2.8, on average across the 35 OECD countries with comparable data, the shares of both low- and top-performing students in science did not change significantly between 2022 and 2025. This stability at the OECD average masks some variation across systems. The share of top performers in science did not change significantly in the majority of systems (61), increased in 7 systems and decreased in 7 systems. Similarly, the share of low performers remained unchanged in many systems (45), increased in 14 systems and decreased in 16 systems. Only in Denmark and Latvia, did the shares of low performers increase and those of top performers decrease. By contrast, in Jordan, Uzbekistan, Montenegro, Saudi Arabia, Türkiye, the United Arab Emirates and the United Kingdom, the share of low performers decreased while the share of top performers increased,
Short-term changes between 2022 and 2025 provide only a partial view of how performance distributions are evolving. A decade-long perspective shows whether recent stability reflects genuine continuity or instead conceals gradual shifts in the shares of students below baseline proficiency and at the highest proficiency levels.
On average across the 35 OECD countries with available data, the proportion of students scoring below Level 2 in science (low-performing students) increased by three percentage points between 2015 and 2025, whereas the proportion of students scoring at or above Level 5 (top-performing students) remained unchanged over this period (Table I.B1.2a.33). Over the decade prior to 2025, 13 countries and economies showed a similar pattern of increasing shares of low-performing students and unchanged shares of top-performing students. In 8 countries and economies, the share of low-performing students increased while the share of top-performing students decreased (Table I.B1.2a.33).
The proportion of students who do not reach Level 2 on the PISA scales and the proportion of students who are able to score at Level 5 or 6, together indicate the characteristics of a country’s/economy’s talent pool. Only five countries/economies, Montenegro, Qatar, the Slovak Republic, Türkiye and the United Arab Emirates, , were able to simultaneously reduce their shares of low-performing students and increase their shares of top-performing students over the past decade. Twelve countries/economies reduced their share of low-performing students. In addition, Colombia, Korea, Macao (China), Chinese Taipei and the United States*, increased their share of students at Level 5 or 6 (Table I.B1.2a.33).
Negative change in percentage of low performers.
Positive change in percentage of top performers
Non-significant change.
Positive change in percentage of low performers.
Negative change in percentage of top performers.
Source: OECD, PISA 2025 Database, Table I.B1.2a.33.
In reading, the proportion of students scoring below Level 2 (low-performing students) increased by 10 percentage points between 2015 and 2025, on average, whereas the proportion of students scoring at Level 5 or 6 (top-performing students) decreased by two percentage points (Table I.B1.2a.34). A similar change was also observed in mathematics, with an increase of about 9 percentage points in the proportion of students scoring below Level 2 and a decrease of about two percentage points in the share of top-performing students (Table I.B1.2a.35).
Performance trajectories since the early PISA assessments
In 25 years of PISA, since the first PISA assessment in 2000, the average trend across OECD countries is negative (Figure I.2.6). Performance in PISA 2025 was the lowest in all subjects, significantly below the mean performance observed in any earlier assessment (except for science in PISA 2022). In science and reading, the strongest performance was observed in 2009 and 2012, respectively, then the trajectory turned negative. In mathematics, performance remained close to the 2003 level through all assessments up to 2018, then dropped sharply between 2018 and 2025.
OECD average-23
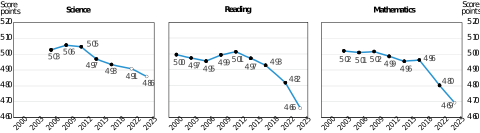
Note: White dots indicate mean-performance estimates that are not statistically significantly above/below PISA 2025 estimates.
Source: OECD, PISA 2025 Database, Tables I.B1.2a.36, I.B1.2a.37 and I.B1.2a.38. See https://stat.link/xgs41b for the underlying data.
This box provides an overview of performance trends. More detailed analyses are presented in Annex A1 and in certain sections of Chapters 3 and 4.
Reading offers a powerful lens to examine performance declines, as reading comprehension has a key role in understanding and successfully completing tasks in all other PISA domains. While trends in reading often show steeper declines than trends in mathematics and science, how a country’s performance evolves in reading, in comparison to other countries, remains closely related to its “relative” trend in mathematics and science (Annex A1). This suggests that common factors affect learning across domains.
To rule out simple explanations, analyses were conducted to verify that the observed declines are not measurement artefacts. Results in Annex A1 show that the decline is unlikely to reflect measurement issues or PISA-specific anomalies. Rather, the signal remains strong despite the known limitations of current educational measurement tools.
What, then, can explain the widespread declines observed in reading? The discussion in this box touches on four complementary levels: students, schools, education systems and broader societal trends. These are best understood as distinct forces which complement each other to produce effects, each adding depth and clarity to the context of the decline, rather than as rival explanations.
Students: Not a uniform decline in skills, but reduced attention and, in some countries, increasingly negative attitudes towards school
The decline in reading scores appears to reflect not just a uniform drop in success rates, but rather that students found certain types of reading tasks even increasingly difficult. Such uneven declines in performance, just like science competencies often held steady even when reading skills declined, does not suggest a uniform erosion of students’ skills.
Within the PISA reading test, the most rapidly declining success rates were observed on tasks that used longer texts as stimuli. Between 2018 and 2022, success rates declined in particular on reading tasks involving higher-level processes, such as evaluating and reflecting, which require careful reading, remembering and integrating multiple pieces of information, sometimes across several sources. In contrast, the least affected tasks were those requiring students to locate a single piece of information. The latter tasks can often be solved through more targeted engagement with the text. Over a longer period (2018 to 2025), declines are more uniform across all types of tasks but difficulties related to text length remained a strong driver of the overall decline (Annex A1).
PISA results also suggest, more broadly, that the decline could be related to students’ capacity or willingness to sustain focused engagement with demanding reading tasks (Annex A1):
Performance declines are already visible at the very start of the reading assessment, in the fluency items that measure how quickly and accurately students process simple written statements. The proportion of accurate and fluent readers declined by about seven percentage points between 2018 and 2025. The proportion of hasty readers – those who gave fast and incorrect responses – increased by about five percentage points, on average, from almost 7% in 2018 to 11% in 2025.
The proportion of hasty responses – fast and incorrect – also increased significantly in the rest of the reading assessment over the same period, on average. At the same time, the proportion of non-reached items declined. This suggests that students became more inclined to answer quickly rather than to leave difficult items unanswered.
Performance declined throughout the reading assessment, but more strongly in the later sections of the test than in the early sections. This appears consistent with the above two findings: it suggests that students’ attention, persistence or confidence when facing difficult tasks declined over time.
Students’ self-reported effort, in PISA, and their general attitudes towards learning and school, tended to also decline:
In most countries and economies, the effort that students reported having spent on the PISA test declined in 2025 compared with 2022 and 2018 (Annex A1).
Students’ reports of their motivation for learning and engagement with school also declined between 2022 and 2025 (Chapter 3) and the extent to which the latter declines were observed in different countries and economies aligns with the varying magnitude of drops in reading performance over the most recent period. For example, changes in the share of students reporting that they are “curious about many different things” are correlated with changes in reading performance (r = 0.54). Changes in the share of students reporting they finish what they start even when the task becomes boring are moderately correlated with reading trends (r = 0.33).
In contrast, students’ perceived value of school did not show a similarly negative tendency, in general (Chapter 3): students’ views became more negative in some systems, but more positive in others (Table I.B1.3.71). Still, in some countries, negative shifts in values may have amplified underlying pressures: indeed, countries and economies in which fewer students believed that school is a waste of time had, usually, more positive developments of their reading scores than countries where an increasing proportion of students held such negative beliefs (r = 0.53). Although not causal, this suggests that in some countries and economies, performance declines coincided with shifts in students’ engagement with school and learning.
Schools and classrooms: Greater need for student support, more disruptions and difficulties keeping discipline
To a large extent, student engagement develops in school contexts, and the data suggest that some of these contexts have become more challenging. PISA 2022 showed that during school closures related to the COVID‑19 pandemic, many students struggled with remote learning: almost one out of two students reported having difficulty motivating themselves to do schoolwork, and one out of three reported that they often did not fully understand their school assignments (OECD, 2023[8]). At the time of the pandemic, these difficulties were not only technical; they reflected also perceived shortages in teacher support, among other aspects.
By 2025, student perceptions of teacher support have improved in some areas, such as in the opportunities given by teachers for students to express their opinions, but weakened in others. For example, PISA data indicate declines in the share of students reporting that science teachers continue teaching until students understand, between 2015 and 2025, on average across OECD countries (Table I.B1.4.116 in Chapter 4). Changes in this indicator are moderately correlated with changes in (science) performance across participating countries and economies over the same period (r = 0.32). These associations do not imply causality, but suggest that, in countries/economies where science performance declined, instructional conditions reported by students often worsened at the same time; while they were more likely to improve in countries/economies where performance improved.
Classroom and school climate also changed over time. On average across OECD countries, bullying declined between 2018 and 2022 but increased again by 2025, although not necessarily to pre-2022 levels (Table I.B1.4.142 in Chapter 4). And in countries where the share of students who reported being threatened by other students increased the most, between 2022 and 2025, reading results tended to decline more severely (r = ‑0.63). Principals also reported, over the same period, a more negative school climate, including more frequent vandalism, theft, profanity, intimidation or verbal abuse of students or teachers, and physical injury. Changes between 2022 and 2025 in the share of students who were exposed to profanity are negatively, although moderately, correlated with the changes in reading performance (r = -0.36).
Evidence from TALIS 2024 further points towards worsening discipline over recent years in lower secondary classrooms. Teachers in 2024 reported spending more time keeping order in the classroom than in 2018, leaving less time for teaching – and for learning. On average, the share of class time spent keeping order increased from 13% in 2018 to 16% in 2024 (OECD, 2025[9]). Even with unchanged formal instructional time, more time spent managing disruption reduces time for learning activities.
These changes in schools and classrooms matter because the development of reading competencies depends heavily on repeated, sustained engagement with texts and on structured support from teachers, particularly when students are expected to make sense of complex material (Duke and Pearson, 2009[10]; Shanahan, Fisher and Frey, 2016[11]; Snow, 2002[12]; Guthrie and Wigfield, 2000[13]). If classrooms became more difficult to manage and teaching was more frequently disrupted, the conditions for such sustained engagement may have weakened. This does not mean that teachers and schools are responsible for the decline directly. Rather, schools may be the setting where multiple pressures come together.
System-level pressures: More diverse classrooms and feeble governance
Several system-level changes may also have shaped recent performance trends. One concerns how systems have addressed changes in the composition of classrooms. TALIS 2024 shows that across OECD countries, almost three out of four teachers – 73% on average – reported teaching to academically diverse classes, meaning that the class included more than 10% (but less than 100%) of low achievers and/or gifted students (OECD, 2025, pp. 45-46 [Table 1.26] and 117-118 [Table 3.19][9]). Evidence from TALIS also shows that higher shares of low-achieving students are linked to greater classroom disruption (OECD, 2025, p. 118[9]), and maintaining inclusive, high-quality instruction may therefore be more demanding in some contexts.
Moreover, while socio-economic composition remained broadly stable between 2018 and 2024, principals reported that their schools had more refugee students, more non-native speakers, more students with special needs and more students with migrant background. Classroom diversity is not inherently problematic. PISA data show that changes in student body composition do not explain the overall decline in performance (Annex A1). Rather, the issue is whether education systems have the capacity to respond to increasing needs for differentiated teaching, language support, special education resources and broader socio-economic support, particularly when several forms of need are concentrated in the same schools or classrooms.
The (limited) use of data may also have played a role. TALIS 2024 highlights, in several systems, a decline in the use of external student performance data for teacher appraisal (OECD, 2025, p. 127[9]). PISA 2025 points to a related trend: school principals reported a decline, on average across OECD countries, in the use of data to plan actions for teaching and school improvement (Table I.B1.4.178 in Chapter 4). Some countries with large reading declines between 2022 and 2025, such as Norway*, concurrently seemed to reduce the use of data for improvement. However, this pattern does not appear to be consistently associated with more negative trends in reading performance (countries with less negative trends, such as Türkiye, also reported similar reductions in the use of data). This evidence should therefore be interpreted cautiously. Still, the lack of a systematic association among these two trends does not rule out the possibility that weaker feedback loops sometimes led to lags in identifying learning gaps and targeting recovery after the pandemic, particularly in systems where pressures to deal with more challenging classrooms were rising at the same time.
Societal trends: Changing reading habits, more digital lives, and the pandemic
Beyond schools and education systems, broader societal trends may also have affected how young people learn and engage with school, in general, and with written texts, in particular.
PISA 2018 results already showed that students’ reading habits were changing. Compared with 2009, larger proportions of both boys and girls reported that they read only if they have to (OECD, 2021[14]). Across OECD countries, the index of enjoyment of reading declined over the decade to 2018. At the same time, students reported that they read fewer fiction books, print magazines and physical newspapers, and that they engaged increasingly with text through online activities such as searching for information, chatting and reading news online (OECD, 2021[14]).
Parents also play an important role in shaping children’s attitudes towards reading from the earliest years. Previous PISA analyses have shown that students whose parents were seen reading at home, or whose parents reported that they enjoyed reading, tended to report greater enjoyment of reading themselves (OECD, 2021[14]). Although results from the PISA parental questionnaire in 2009 and 2018 cannot be compared directly because of changes in response options, parents’ responses suggest that reading lost ground as their “favourite hobby”, and therefore that reading enjoyment declined among parents, not just their children, across many of the countries and economies with available data (PISA 2009 and 2018 compendia). Changes in 15-year-olds’ reading engagement therefore seem to have coincided with broader changes affecting other age groups too, including their parents, who are important role models and can strongly influence young people’s reading habits at home.
Changing reading practices involve more than just the amount of reading, but also the type of text that readers read. In PISA 2018, when reading practices were a major focus of the PISA questionnaire, students who read fiction and longer texts for school achieved higher reading scores in the test, after accounting for students’ and schools’ socio-economic profile (OECD, 2021[14]). Students who more often read books on paper also tended to perform better than those who read books primarily on digital devices or rarely read books.
PISA 2025 data also point to changes in the nature of students’ digital engagement between 2022 and 2025. A larger share of students reported spending more than one hour per day browsing social networks or playing video games, while fewer reported using digital devices for activities such as seeking practical information online or creating digital content (Tables I.B1.4.38 and I.B1.4.41 in Chapter 4). These trends do not establish a direct link between online activities and declining reading performance. However, they add to earlier evidence that the environments in which young people encounter and use text have continued to change across PISA cycles. Students today continue to read and write extensively in digital settings, but often for different purposes and in different formats than in the past. This changing balance of digital activities may be relevant to understanding the broader context in which sustained reading, information integration and critical evaluation develop.
PISA 2025 students, who were born in around 2009, grew up during a period of rapid change and diffusion of personal electronic devices, which may have altered reading habits, favouring shorter, fragmented digital engagement over sustained reading. Existing research, using sources other than PISA, documents changes in how young people read, and in what, when, and why they do so: they tend to engage more often with digital texts that encourage selective or functional reading, switch more frequently between tasks, and spend less time on sustained reading practices that are strongly associated with the development of reading comprehension (Mol and Bus, 2011[15]; Baron, Calixte and Havewala, 2017[16]; Altamura, Vargas and Salmerón, 2023[17]; Salmerón et al., 2024[18]).
The impact of the pandemic on students’ lives and learning journey also remains an important part of the broader context, but its role is unlikely to be captured by the length of school closures alone. The students assessed in PISA 2025 were around 10 or 11 years old at the onset of the pandemic, a period when students usually move from the acquisition of foundational literacy and numeracy towards more advanced comprehension and problem-solving skills. Across 29 education systems with available data, school closures during the peak period from February to June 2020 varied widely, from no closures in Sweden to around 20 weeks in Costa Rica and Colombia (OECD, 2021[19]). Yet there is no simple relationship between the duration of closures and subsequent reading trends: while the drop in reading performance was of about 9 score points in Colombia, there was no significant change in Costa Rica and there was a drop of about 21 score points in Sweden. This does not mean that the pandemic had no effect. Rather, it suggests that the direct impact of school closures could often be mitigated through quality remote learning, teacher support, family resources, student engagement, and subsequent recovery policies; and, at the same time, that the unprecedented experiences of the pandemic period may have acted as a catalyst for other, and more profound, shifts in habits and values.
Irregular student attendance may be especially relevant. After the pandemic, many countries experienced persistently high levels of student absence across education levels. In many countries, students who attended schools in the past 10 years may have missed more classes (or had their classes disrupted) than previous generations of students not just because of COVID-related school closures, but also due to repeated absences (justified and/or unjustified). For example, international data on fourth-grade students show that the share of students absent from school at least once every other week increased from 10.7% in 2019 to 14.8% in 2023, on average across OECD countries (OECD, 2026[20]). For the PISA 2025 cohort, lower attendance over several years may have mattered more than the level of attendance observed at age 15 alone. Lower exposure to regular instruction, even if spread across several years, may have weakened the accumulation of reading and mathematics skills. And, while the causes of school attendance problems are certainly complex and deserve further research, it is possible that shifting parental perceptions about the value of regular school attendance, and more flexible teleworking policies introduced after COVID, played a role (OECD, 2026, pp. 44-45[20]).
Finally, PISA data suggest that, in a number of systems, fewer conversations with parents or other family members were taking place at home to support students in their school life in 2025, compared to just three years earlier (Table I.B1.4.123 in Chapter 4). For example, in 2025, fewer students reported that their parents asked them what they had done at school that day. However, this trend is observed in countries/economies with large declines in reading skills to a similar extent as in countries/economies where reading scores in 2025 remained close to their 2022 levels.
Conclusion
The evidence does not point to one simple explanation for the performance decline. A more plausible interpretation is that performance declines reflect changes occurring at many levels, with small forces often aligning to produce strong effects on students’ learning. At the student level, PISA shows, in many countries/economies, increasing difficulties with tasks that require sustained engagement, a greater tendency to produce hasty responses, lower willingness to spend effort on school tests (particularly if low stakes, such as PISA), and weakening curiosity and perseverance. At the school level, classroom climate and disciplinary conditions may have become more difficult in ways that reduce the time that remains available for learning; and students express unmet needs for support from teachers more often than before. At the system level, societal and demographic changes brought more diversity into classrooms, but system-level tools to govern this greater complexity (e.g. with timely monitoring systems and feedback routines) were sometimes insufficient. And outside of school walls, the lives of children and adults, and societies at large, also changed, often in ways that are not conducive to more learning: shifting reading habits, more intense use of digital devices, higher absenteeism, lower family support and the after-effects of the pandemic have reshaped the social context in which young people learn.
These hypotheses should be read as complementary rather than competing. They do not assign responsibility to students, teachers, schools or families. Instead, they point to a changed (learning) environment in which sustained reading, focused engagement, instructional support and cumulative skill development may all have become harder to maintain. Reading is central to this interpretation because it is both a major learning domain in its own right and a foundation for learning across subjects. After 25 years of PISA, understanding why reading performance has declined in each national context is therefore essential not only for explaining the 2025 results, but also for identifying where education systems may need to rebuild the conditions for learning in the years ahead.
Decade-long trends in performance
Over the most recent decade (2015-2025), the trend in performance has been negative in all three core subjects, on average across 35 OECD countries with available data. Indeed, the recent stability in science performance masks a sustained, long-term decline. On average across OECD countries, the decennial trend is negative, indicating an average drop of 7 score points in science performance since 2015 (Table I.B1.2a.36).
As shown in Table I.2.9, such decade-long negative trends can also be seen in 28 countries and economies, with average negative trends ranging from 7 score points in Malta to 37 in Iceland, over the same period. However, in a number of countries and economies, PISA data show average decade-long positive trends in science, ranging from an average trend of 7 score points in Singapore to 62 in Türkiye and 72 in Cambodia.
Figure I.2.7 shows the linear trend in median performance since PISA 2015, alongside trends observed in the performance of students in the 10th and 90th percentiles.
Based on average decennial trend
Notes: Only countries and economies that can compare results in all three subjects in PISA 2025 and at least two previous assessments among PISA 2015, PISA 2018 and PISA 2022 are shown.
The average decennial trend is the average change, per 10-year period, between PISA 2015 and PISA 2025, calculated by a linear regression. The average decennial trend is only computed for countries with comparable data in at least three PISA assessments over the period considered.
Positive change.
Non-significant change.
Negative change.
Countries and economies are ranked, in descending order of the decennial trend in science since 2015.
Source: OECD, PISA 2025 Database, Tables I.B1.2a.36, I.B1.2a.37 and I.B1.2a.38.

Notes: Only countries and economies that can compare results in science in PISA 2025 and at least two previous assessments among PISA 2015, PISA 2018 and PISA 2022 are shown.
The average decennial trend is the average change, per 10-year period, between PISA 2015 and PISA 2025, calculated by a linear regression. The average decennial trend is only computed for countries with comparable data in at least three PISA assessments over the period considered.
Statistically significant differences are shown in a darker tone (see Annex A3).
Countries and economies are ranked in descending order of the average decennial trend in median performance in science.
Source: OECD, PISA 2025 Database, Table I.B1.2a.39. See https://stat.link/xgs41b for the underlying data.
Trends at the 10th percentile indicate whether the lowest-achieving 10% of students in a country/economy moved up the PISA scale over time. Similarly, trends at the 90th percentile indicate improvements among a country’s/economy’s high-achieving students.
Among countries and economies whose mean science performance worsened since 2015, there have been both widening and shrinking performance gaps:
In Denmark, Finland, Iceland, North Macedonia, the Netherlands*, Norway*, Portugal and Slovenia, declines among both low-achieving and high-achieving students resulted in the widening in the achievement gap in science (measured by the distance between the 10th and 90th percentiles) between 2015 and 2025.
In Belgium, Greece, Indonesia and Israel, there were declines among both low-achieving and high-achieving students, but the gap remained unchanged.
Only in Kosovo did more rapid declines among high-achieving students result in the achievement gap in science shrinking between 2015 and 2025.
In Canada*, Germany, Hong Kong (China), Latvia, Lebanon, Poland and Spain, as was the case on average across the 35 OECD countries that can compare PISA results across all assessments, the long-term decline occurred among low-achieving students only, resulting in a widening gap with respect to high-achieving students whose scores did not change over the decade (Tables I.B1.2a.36, I.B1.2a.39 and I.B1.2a.42).
Among countries and economies where science performance improved over the 2015-2025 period, Lithuania, Montenegro and Qatar saw no significant change in the achievement gap, although low-achieving students’ results improved. In Korea, Macao (China), Chinese Taipei and the United Arab Emirates, the average improvement was due to high-achieving students improving while low-achieving students showed no significant change, which widened the performance gap. Only in Georgia did performance in science among low-achieving students improve while high‑performing students remained unchanged, resulting in a shrinking performance gap (Tables I.B1.2a.36, I.B1.2a.39and I.B1.2a.42).
Finally, among countries and economies with no significant change in mean science performance over the 2015‑2025 period, Austria, Brazil, Colombia, Costa Rica, Croatia, Ireland, Japan, Romania, Sweden, the United Kingdom and the United States* nevertheless experienced a widening of their performance gap.
On average across the 35 OECD countries that can compare PISA results across all assessments, performance differences widened in reading and mathematics even though both low-achieving students and high-achieving students performed worse; however, low-achieving students declined by more than high-achieving students did (Tables I.B1.2a.37, I.B1.2a.40, I.B1.2a.43, I.B1.2a.38, I.B1.2a.41 and I.B1.2a.44).
When looking at reading performance, in countries/economies with declining decade-long trends, the drop was driven by low-achieving students (i.e. changes were statistically significant only for low-achieving students) in Australia, Costa Rica, Korea, Macao (China), Mexico, New Zealand*, Romania, Switzerland, and Uruguay. In these systems, the result was a widening of the performance gap, with the exceptions of Mexico, Romania and Uruguay. At the opposite end, the average drop was driven by a drop in performance among high-achieving students in Georgia, Lebanon, Matla, Moldova and Montenegro, which resulted in a shrinking of the performance gap.
In countries/economies with declining decade-long trends in mathematics performance, the drop was driven by low‑achieving students in Australia, Czechia, Estonia, Hong Kong (China), the Netherlands*, New Zealand*, Romania, the Slovak Republic, Switzerland and the United Kingdom. In all of these systems, the result was a widening of the performance gap. Moreover, the average drop was driven by a drop in performance among high-achieving students, in Chile, Colombia, Indonesia, Kosovo, Lebanon, Mexico, Moldova, Montenegro and Thailand, . In these systems, this resulted in a shrinking of the performance gap with the exceptions of Colombia and Thailand, where the gap remained unchanged.
Average 10-year trends in performance, taking into account changes in enrolment rates
In most countries and economies, all boys and girls who were born in 2009 were of the correct age to sit the PISA 2025 test (in countries and economies that tested students during the second part of 2025, a 12-month period spanning the years 2009 and 2010 defined the eligible birthdates). However, age was not the only criterion for eligibility: 15-year-olds also had to be enrolled in 7th Grade or higher at the time of testing.
Eligibility in PISA is determined by more than just a student’s age, the PISA sample excludes 15-year-olds who do not go to school or who are severely delayed in their school-grade progression. However, PISA results still reflect a combination of 15-year-olds’ access to education and the quality of the education they have received over the course of their lives.
Globally, enrolment in secondary education has continued to expand over the past decade in many countries. As a result, PISA coverage – the proportion obtained by dividing the number of PISA-eligible students by the total number of 15-year-olds in a country – has increased in a number of participating countries and economies.
Many of these countries and economies saw a declining trend over the past decade in one or two and, sometimes, in all three subjects. These declines could mean that the quality of education has gone down for all students in the past decade, or they could also reflect the expansion of education to more marginalised populations.
The expansion of education systems is also reflected in PISA data: in all of the 12 countries where fewer than two in three 15-year-olds were eligible to participate in past PISA assessments, there is now an increased share of 15‑year‑olds eligible for the test relative to all the 15-year-olds in the country. Most notably, over the past decade, Cambodia, Ecuador, El Salvador, Lebanon, Morocco and Paraguay saw increases between 11 and 24 percentage points in the PISA coverage – the proportion obtained by dividing the number of PISA-eligible students by the total number of 15-year-olds in a country8.
However, this expansion in education opportunities makes it more difficult to interpret how mean scores in PISA have changed over time. Increases in the share of PISA-eligible students relative to all 15-year-olds can lead to an underestimation of the real improvements education systems have achieved. Household surveys often show that children from poor households, rural areas or ethnic minorities have a greater chance of not attending or completing lower secondary education (GEM Report UNESCO, 2015[21]) Typically, as populations that had previously been excluded gain access to higher levels of schooling, a larger proportion of low-performing students would be included in PISA samples (Avvisati, 2017[22]).
Of the countries in which PISA coverage increased markedly since 2015, only Cambodia, the Dominican Republic and El Salvador saw improvements in performance in at least one subject by 2025. Among those with a longer record of participation, mean performance in science remained stable in Colombia, Costa Rica and Mexico, although it decreased in reading or mathematics (or both) over this period (Tables I.B1.2a.36, I.B1.2a.37 and I.B1.2a.38). Only in Brazil, performance remained stable in the three domains since 2015, while coverage increased by four percentage points.
Selected countries; 2015, 2018 or 2022 to 2025
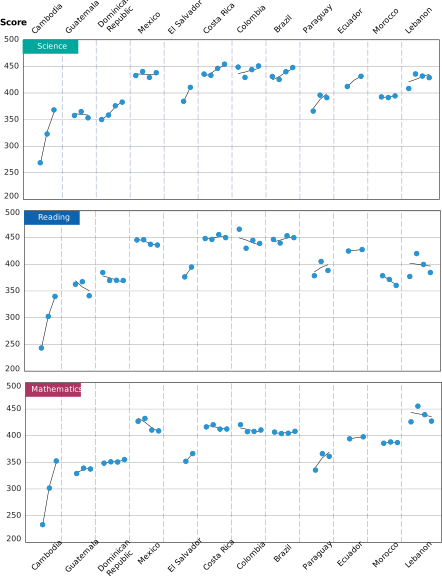
Notes: Only countries and economies whose Coverage Index 3 (CI3) was below 66.6% in 2015, 2018 or 2022 are included in the figure.
Dotted trend-lines indicate non-significant trends over the period considered.
Countries and economies are ranked in ascending order of the percentage of 15-year-olds covered by the PISA sample (CI3) in 2025.
Source: OECD, PISA 2025 Database, Tables I.B1.2a.48, I.B1.2a.49 and I.B1.2a.50. See https://stat.link/xgs41b for the underlying data.
Do declines mean that the quality of education has gone down for all students in the past decade, or do they reflect the expansion of education to more marginalised populations? By considering a population equal in size to 25% of an age group made up of only the best-performing students in a country, it is possible to monitor the rate of change in PISA performance for a sample of 15-year-olds that was only indirectly affected by changes in coverage rates over a given period, but whose composition remained unchanged. Most likely, all members of this group would have been eligible to participate in PISA even in the counterfactual situation of no educational expansion. This analysis offers a different interpretation of many of these countries’ results.
In Cambodia, minimum scores for 25% of top-performing 15-year-olds increased over this period in all three subjects. In Paraguay, minimum scores for 25% of top-performing 15-year-olds increased in science and mathematics and remained stable in reading. In Costa Rica, minimum scores for 25% of top-performing 15-year-olds increased over this period in science and remained stable in reading and mathematics. Moreover, in Guatemala and Morocco, minimum scores for 25% of top-performing 15-year-olds remain unchanged in at least two domains, and only in one in Mexico (Tables I.B1.2a.48, I.B1.2a.49 and I.B1.2a.50).
In sum, among the seven countries that increased participation in secondary education over the 2015-2025 period and for which performance change data are available, mean scores improved in all subjects in Cambodia, in two subjects in the Dominican Republic and in one in El Salvador; dropped in all subjects in Guatemala, and in at least one subject in the remaining four (Costa Rica, Mexico, Morocco and Paraguay). In these systems, the decline in mean scores is likely linked to the integration of more 15-year-olds from marginalised populations into schooling. PISA results show that in at least three of these education systems, performance did not deteriorate and that expanding secondary education to more marginalised students was not necessarily accompanied by lower performance among their higher-performing peers.
PISA offers a snapshot of 15-year-old students’ proficiency in science, reading and mathematics. But students’ skills do not stop developing at age 15. They may be strengthened through further education, training and work, or they may weaken if there are fewer opportunities to keep using and developing them.
The OECD Survey of Adult Skills, a product of the Programme for the International Assessment of Adult Competencies (PIAAC), makes it possible to examine this longer trajectory. While PISA assesses 15-year-old students, PIAAC assesses 16- to 65-year olds' literacy, numeracy and problem-solving skills in everyday and work-related contexts. Looking at PISA and PIAAC together provides a broader view of how foundational skills evolve from adolescence into young adulthood (OECD, 2026[23]).
This box focuses on literacy. It follows the broad logic of analyses comparing PISA cohorts with later PIAAC results. The aim is not to track the same individuals over time, but to assess comparable groups of people born around the same years. In practice, this means comparing the PISA 2009 cohort with adults born in 1992-94 who were later assessed in PIAAC. The analysis therefore compares people from similar birth cohorts at three broad stages: age 15, early adulthood and around age 30.1
Because PISA reading and PIAAC literacy are reported on different scales, the PISA reading scores in this analysis are expressed in PIAAC literacy score points (Borgonovi et al., 2017[24]). This makes the results easier to interpret: differences can be read as approximate changes in literacy proficiency between age 15 and young adulthood. However, these results should still be interpreted with caution. PISA and PIAAC differ in their target populations, testing settings and assessment designs, and these differences may affect results.
Change in literacy scores using PISA 2009 scores converted to the PIAAC literacy scale
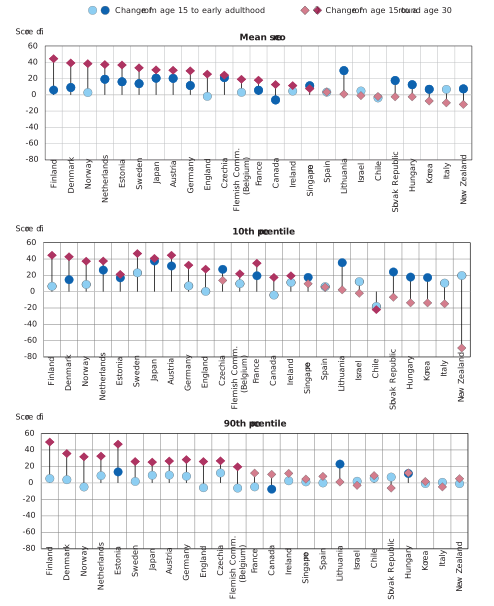
Notes: Only countries and economies with available data are shown.
The PIAAC samples are restricted to young adults born in 1992, 1993 and 1994, and exclude foreign-born individuals who arrived in the test country at age 15 or older. This restriction helps ensure that the PIAAC respondents are more comparable to the students who were assessed in PISA in 2009.
Countries and economies are sorted by the performance gap between PISA 2009 mean reading scores and PIAAC Cycle 2 (2023) mean literacy scores.
Source: PISA and PIAAC databases. See https://stat.link/xgs41b for the underlying data.
Figure I.2.9 shows mean literacy performance for the PISA 2009 cohort at age 15 and for comparable cohorts assessed during early adulthood and around age 30. Three broad patterns emerge. In one group of countries and economies, mean literacy proficiency appears progressively higher across cohorts through age 30. This group includes Austria, Canada*, Czechia, England (United Kingdom), Estonia, the Flemish Community (Belgium), France, Germany, Ireland, Japan, the Netherlands*, Singapore and Nordic countries such as Denmark, Finland, Norway* and Sweden. In the Flemish Community (Belgium), England (United Kingdom), Ireland and Norway*, gains appear particularly marked around age 30 (Figure I.2.9). In other countries, such as Austria, Czechia, Japan and Singapore, literacy also is higher in the cohorts assessed after age 15, but the pace of improvement seems to be slower in later young adulthood.
A second group shows a different trajectory. In these countries, literacy scores are higher for cohorts assessed shortly after the age at which students take PISA, but estimates for those assessed at a later stage are close to those observed at age 15, or below them. This pattern is visible in Hungary, Korea, Lithuania, New Zealand* and the Slovak Republic, where mean literacy performance around age 30 is similar to that estimated for the PISA 2009 cohort.
Finally, in Chile, Israel, Italy and Spain, mean literacy scores show no significant overall change compared with the PISA 2009 level.
Looking beyond mean scores shows that changes in estimated literacy performance across life stages can differ substantially across the score distribution.2 In Austria, Denmark, England (United Kingdom), Estonia, Finland, the Flemish Community (Belgium), Germany, Japan, the Netherlands*, Norway* and Sweden, literacy gains are observed across all levels of performance. In Estonia, gains appear larger at the top end of the distribution.
In Chile, more than 10% of young adults had literacy scores, around age 30, that would have placed them in the bottom decile, among 15-year-olds in 2009 – suggesting that literacy skills may have declined after age 15 for many of the lower-performing students as they entered adulthood.
Among countries where mean literacy performance at later life stages is close to the original PISA level, this trajectory can reflect shares of low-performing adults that increase with age, rather than a uniform shift across performance levels. In Hungary and Korea, for example, the score below which only 10% of adults score was markedly lower around age 30 than for the cohort representing early adulthood, while higher-performing adults continued to reach high scores (Figure I.2.9). In Lithuania and the Slovak Republic, scores dropped at several points of the distribution up to the score below which 75% of adults score, indicating that the decline extended across much of the performance distribution rather than being confined to the lowest-performing adults.
These patterns suggest that literacy skills after age 15 are not fixed. In some systems, young adults continue building on the skills measured by PISA, while in others early gains are not sustained. The contrast between lower- and higher-performing adults is also important. Where the literacy levels of lower performers decline with age, skill differences widen in the years after compulsory schooling. This points to the importance of upper secondary and tertiary education, but also of vocational education and training pathways, adult learning and early labour-market experiences, in helping young people maintain and develop the literacy skills they acquired in school.
1. For the countries and economies that participated in PIAAC Cycle 1 in 2011-12, the PISA 2009 cohort represents the youngest PISA cohort that could subsequently be observed in PIAAC. The analysis therefore follows such cohorts across three points in time: PISA 2009 (15-year-olds), PIAAC Cycle 1 (ages 18 to 25) and PIAAC Cycle 2 (ages 29 to 31). The terms “early adulthood” and “around age 30” refer to the ages at which these birth cohorts were assessed in the two rounds of PIAAC.
2. Comparisons across percentiles refer to changes at selected points of the score distribution across cycles. They should not be interpreted as tracking the same individuals over time or as assuming that individuals remain at the same percentile. References to gains or declines at the lower, middle or upper parts of the distribution refer to changes in distributional positions, not to fixed groups of adults.
The analyses above show that changes in average performance often conceal important shifts in the distribution of achievement, especially at the lower end. At the same time, mean performance remains an important part of equity in education: an education system cannot be considered fully equitable if most students perform at low levels, even when differences between social groups are small. To understand whether differences in outcomes reflect inequalities in learning opportunities, it is therefore necessary to examine how performance is associated with students’ social and educational backgrounds, while keeping the overall levels of achievement in view.
Equity is a fundamental value and a central goal of education policy. From a social justice perspective, it reflects the principle that all individuals, regardless of their background, should have the opportunity to fulfil their potential. From an economic and societal perspective, it also matters because education systems are stronger when they enable all learners to develop their capabilities, rather than allowing talent and potential to go unrealised. From a global policy perspective, it is also embedded in the 2030 Agenda for Sustainable Development, particularly in Sustainable Development Goal 4, which calls for “inclusive and equitable quality education” for all, and in Target 4.5, which aims to eliminate disparities in education and ensure equal access for vulnerable groups. In addition, Target 4.1 underscores the importance not only of access, but also of ensuring that all girls and boys equitably achieve relevant and effective learning outcomes (United Nations, 2015).
Yet achieving genuine equity remains one of the most complex challenges facing school systems today. Although global expansions in schooling over the past century have dramatically increased access to education, socio-economic inequalities in learning outcomes have proven remarkably persistent (Chmielewski, 2019[25]; Pfeffer, 2008[26]). Equity is understood, first of all, as an ethical imperative to ensure that personal or social circumstances – factors over which students have no control – do not dictate their opportunity to fulfil their academic potential (OECD, 2023[3]). But equity also requires that this potential be realised at meaningful levels of learning: reducing disparities is not sufficient if students from all backgrounds are left with weak skills.
This section analyses two key dimensions of equity in education: inclusion and fairness. Only education systems that combine high levels of both are considered highly equitable. Fairness refers to the extent to which all students are given the opportunity to realise their full learning potential, irrespective of their background. Inclusion, in PISA, refers to whether all young people have access to quality education and acquire at least the baseline skills needed to continue learning to achieve their potential and fulfil their aspirations. However, baseline proficiency should be understood as a minimum threshold, not as the endpoint of equity. This is why the equity indicators discussed in this section need to be read alongside the earlier results on mean performance: an education system in which most students reach only baseline proficiency, or in which performance is uniformly low regardless of background, would not represent the full ambition of equity. Equity requires both broad access to foundational skills and meaningful opportunities for students from all backgrounds to progress towards higher levels of achievement.
Inclusion, fairness and equity in education
In PISA 2025, only education systems that combine high levels of both inclusion and fairness are considered equitable. Inclusion is measured by the percentage of 15-year-olds who are at or above proficiency Level 2 in at least one subject (as will be discussed, this reflects the assumption that 15-year-olds not covered by the PISA sample would score below Level 2).9 Fairness is measured by the percentage of variance in science performance accounted for by student socio-economic status. Figure I.2.10 shows countries and economies according to their levels of inclusion and fairness in science.

Notes: Only countries and economies with available data are shown. Please refer to the Reader’s Guide for countries’ and economies’ ISO codes.
Socio-economic status is measured by the PISA index of economic, social and cultural status.
Source: OECD, PISA 2025 Database, Tables I.B1.2a.45 and I.B1.2b.2. See https://stat.link/xgs41b for the underlying data.
In 18 out of the 28 countries and economies that had a level of inclusion above the OECD average (i.e. more than 65% of 15-year-olds scored at or above proficiency Level 2 in science), the level of fairness by socio-economic status was also significantly above the OECD average (i.e. less than 12% of the variance in science performance was accounted for by student socio-economic status). Education systems in B-S-J-Z (China), Canada*, Estonia, Ireland, Japan, Korea, Lithuania, and Macao (China) achieved high levels of both inclusion (over 75%) and fairness (under 10% variance). Importantly, these systems did so while also attaining strong overall outcomes: the average score in science, reading and mathematics was higher than the OECD average (except in Lithuania, where the mean score in reading was not statistically significantly different from the OECD average). While these results do not imply that equity causes higher performance, they indicate that many systems that are most successful in limiting low performance and reducing socio-economic disparities also tend to be systems where overall achievement is strong. They can therefore be considered highly equitable (Tables I.B1.2a.45 and I.B1.2b.2).
These results show that high levels of equity are not incompatible with strong overall performance; on the contrary, some education systems demonstrate that it is possible to combine broad inclusion, weak socio-economic disparities and high achievement across subjects. This distinction is important. An education system in which most students reach only baseline proficiency, or in which performance is uniformly low regardless of background, would not represent the full ambition of equity. Equity requires that students from all backgrounds have access to foundational skills and meaningful opportunities to advance towards higher levels of achievement.
Inclusive education
In PISA, educational inclusion is assessed through two complementary measures: the extent to which all young people secure access to schooling – i.e. the share of 15-year-olds who are enrolled in school and represented in the assessment – and the extent to which students attain at least a baseline level of proficiency in core subjects such as science, reading and mathematics by the age of 15 (OECD, 2016[2]). This measure combines aspects related to the “quantity” of schooling (i.e. the share of 15-year-olds who are enrolled in school) with measures of the “quality” of education outcomes (i.e. the share of students who scored at least at the minimum level of proficiency).
Inclusion is particularly important for students from socio-economically disadvantaged or otherwise marginalised backgrounds. These students often face multiple risk factors that make them especially vulnerable to low proficiency levels and early school withdrawal (De Witte et al., 2013[27]; OECD, 2016[2]). In practice, a truly inclusive education system ensures that the vast majority of young people are not only enrolled in school, but also acquire essential baseline cognitive skills.
Expanding school participation without improving learning outcomes is not sufficient for economic and social success. Comprehensive assessments of educational inclusion must therefore consider both school enrolment and the acquisition of essential cognitive skills, so that young people are not left behind.
Baseline proficiency should therefore be understood as a minimum threshold, not as the endpoint of equity. An education system that enables most students to reach Level 2, but does not provide equal opportunities for students from all backgrounds to progress further, cannot be considered fully equitable. Equity requires both broad access to foundational skills and the opportunity for all students to develop their potential beyond the baseline.
Percentage of 15-year-olds enrolled in school (coverage of education systems)
Access to schooling does not in itself guarantee that students will acquire the knowledge and skills needed to participate fully in contemporary societies, but it is, of course, a necessary precondition for educational inclusion. Access is reflected most directly in the extent to which 15-year-olds are still enrolled in school, while early school leaving and marked delays in grade progression signal weaker inclusion.
These indicators matter because students who leave school early are less likely to fully benefit from the educational, social and labour-market advantages associated with continued participation in education, and because school dropout is shaped by a combination of individual, family, school and institutional factors (Spaull and Taylor, 2015[28]; Hanushek and Woessmann, 2008[29]). Education systems with broader school coverage at age 15 and lower levels of early school leaving or severe delay can therefore be regarded as more inclusive.
While PISA is not designed to estimate enrolment rates directly, it provides a range of indices that capture the coverage of the population of 15-year-olds enrolled in Grade 7 or above in each country and economy. Low values of the proportion of 15-year-olds in each country/economy covered by the PISA sample (Coverage Index 3) may reflect 15-year-olds who are no longer enrolled in school or who have been held back in primary school. This index may also be reduced by student exclusions from the PISA assessment and by dropout during the school year.
Coverage Index 3 ranges from 32% in Rwanda and 43% in Cambodia to 90% or more in 34 countries and economies (see Annex A2). While PISA results are representative of the target population in all adjudicated countries and economies, they cannot be readily generalised to the entire population of 15-year-olds in countries where many young people of that age are not enrolled in lower or upper secondary school.
Coverage is only one component of inclusion. The next question is whether students who remain in school also acquire the minimum competencies needed to participate fully in society.
Basic proficiency in science, reading and mathematics
In this chapter, low performance has been examined separately in science, mathematics and reading. Yet low achievement is often cumulative: students who do not attain baseline proficiency in one domain are at heightened risk of falling below baseline in others. A fuller account of low performance therefore requires attention not only to subject-specific rates, but also to the overlap in low performance across domains, especially the share of students who fail to reach baseline proficiency in all three subjects (OECD, 2023[3]).
At the same time, the results presented so far describe only the 15-year-olds covered by the PISA 2025 target population and sample. In some participating countries and economies, however, a non-trivial share of 15-year-olds was not represented in the assessment. Incomplete coverage can affect how national skill distributions are interpreted, particularly where school attendance at age 15 is not universal.
Because the achievement of 15-year-olds not covered by PISA is not directly observed, their likely position in the skills distribution must be estimated indirectly. Evidence on PISA sample eligibility suggests that students excluded from the sampling frame are often out of school or severely over-age for grade, and that ignoring these groups can lead to an underestimation of both the prevalence of low skills and the extent of inequality in the broader youth population (Spaull, 2017[30]).
More broadly, the literature shows that educational exclusion and early school leaving are associated with clusters of disadvantage rather than a single risk factor, and that school dropout reflects interacting individual, family, school and system-level processes (De Witte et al., 2013[27]; Gubbels, van der Put and Assink, 2019[31]). In low- and middle-income settings, combining data on educational attainment with data on cognitive outcomes further suggests that limited access and weak learning outcomes frequently accumulate among the same groups of young people (Spaull and Taylor, 2015[28]).
Rather than attributing an exact score to these 15-year-olds, it is possible to estimate lower and upper bounds for most results of interest, including the mean score, the median score and other percentiles, or the proportion of 15‑year-olds reaching minimum levels of proficiency (Avvisati, 2017[22]). Under a best-case scenario, where the distribution of reading, mathematics and science skills among the population not covered by the sample is assumed to be the same as that of the covered population, the estimates of mean scores and percentiles derived from PISA samples represent an upper bound on the mean, percentiles and proportions of students reaching minimum proficiency in the entire population of 15-year-olds. A lower bound can be estimated by assuming a plausible worst-case scenario, such as that all 15-year-olds not covered by the sample would score below a certain point in the distribution. For example, if all of these 15-year-olds were assumed to score below Level 2, then the lower bound on the proportion of 15-year-olds reaching minimum levels of proficiency would simply be the corresponding proportion observed in the PISA target population multiplied by Coverage Index 3.
Figure I.2.11 presents the proportion of 15-year-olds reaching minimum levels of proficiency under the assumption that all 15-year-olds not covered by the PISA sample would score below Level 2 in each subject.10 In the figure, 15‑year-olds are grouped according to whether they scored below the baseline level of proficiency in one subject only, in two subjects, or in all three core PISA subjects (science, reading and mathematics), as well as those not covered by the PISA sample, who are assumed to be low performers in all three subjects. The figure shows that all countries and economies that participated in PISA 2025 – even those with the highest levels of performance and equity – have a sizeable share of low performers.
Percentage of students who score below proficiency Level 2

Notes: Only countries and economies with available data are shown.
15-year-olds not covered by the PISA sample are 15-year-olds who are not enrolled in school; or who are in school but in Grade 6 or below, or who were excluded from the PISA sample due to student or school-level exclusions.
Countries and economies are ranked in ascending order of the total percentage of students who are low performers in at least one subject.
Source: OECD, PISA 2025 Database, Tables I.A2.1 and I.B1.2a.24. See https://stat.link/xgs41b for the underlying data.
The largest category of low-performing students is the group of 15-year-olds who scored below the baseline level of proficiency in all three subjects. On average across OECD countries, over one out of four students (29%) are low performers in science, reading and mathematics. This percentage includes both students who took the PISA test and 15-year-olds not covered by PISA, who account for 12% of the age cohort on average across OECD countries. In 18 countries and economies, more than 60% of 15-year-olds are low performers in all three subjects.
About 1% of students across OECD countries are low performers in science only; 4% are low performers in reading only; and 6% are low performers in mathematics only. About 3% are low performers in science and mathematics but not in reading; 2% are low performers in science and reading but not in mathematics; and 4% are low performers in reading and mathematics but not in science (Table I.B1.2a.24).
Taken together, all the categories of low performers shown in Figure I.2.11 represent the share of 15-year-olds who are low performers in at least one subject, whether mathematics, reading or science, plus those outside of the PISA target population. On average across OECD countries, 49% of 15-year-olds are low performers in at least one subject, although this share varies considerably across countries. In 47 countries and economies, more than 60% of 15-year-olds scored below baseline proficiency Level 2 in at least one subject. By contrast, in three countries and economies, fewer than 25% of 15-year-olds were low performers in at least one subject (Table I.B1.2a.22).
These results underscore that educational inclusion must be judged not only by how many students remain in school, but also by how many young people acquire at least the minimum competencies needed to participate fully in society.
Fairness by student socio-economic status
A student's socio-economic status remains one of the most powerful and consistent predictors of academic achievement globally. However, the mechanisms through which family background translates into educational advantage are highly complex and multidimensional (Eriksson et al., 2021[32]). The roots of these disparities often take hold long before a child enters a formal school classroom. Research suggests that economic deprivation and adverse home conditions in early childhood can significantly hinder cognitive development and verbal ability, setting a trajectory of disadvantage that continues into adolescence and adulthood (Duncan, Brooks-Gunn and Klebanov, 1994[33]; Richards and Wadsworth, 2004[34]).
As students progress through school, disparities in resources can impact their academic progress. Socio‑economically advantaged students typically benefit from greater financial, social and cultural backgrounds (Paino and Renzulli, 2012[35]; Kao and Thompson, 2003[36]; Eriksson et al., 2021[32]; Coleman, 1988[37]; Bourdieu, 2018[38]). This makes it easier for them to succeed in school compared to students from families with lower levels of education or that are affected by chronic unemployment, low-paid jobs or poverty. Consequently, by the time students take the PISA test at age 15, a distinct socio-economic gradient can be observed, a measurable relationship demonstrating how deeply family background relates to educational outcomes within a given school system (Willms, 2006[39]).
However, socio-economic disadvantage does not determine academic success. Some disadvantaged students perform well despite adversity, demonstrating remarkable academic resilience (“resilient students”) and performing at the highest levels both nationally and internationally (OECD, 2011[40]). This section first examines socio-economic disparities in recent PISA results through the slope and strength of the socio-economic gradient across countries and economies, before looking at low performance and academic resilience.
PISA-participating countries and economies vary markedly in their levels of wealth and per-capita income (see Table I.B3.2.1), translating into differences in the socio-economic status of the students who take the PISA test. The average socio-economic status of students in each country and economy that participated in PISA 2025, is measured by the PISA index of economic, social and cultural status (ESCS) (see Annex A3 for a detailed definition of this index).
The socio-economic gradient in student performance
In PISA, the socio-economic gradient is used to examine the relationship between students’ socio-economic status and student performance in each country and economy whereby a stronger association means less fairness (thus, less equity) (Willms, 2006[39]). The socio-economic gradient offers two key pieces of information: the strength and the slope of the gradient.
The strength of the gradient is measured by the proportion of the variation in student performance that is accounted for by differences in student socio-economic status. When the relationship between socio-economic status and performance is strong, socio-economic status is a good predictor of performance. Meanwhile, the slope of the socio-economic gradient indicates the degree of the disparity in average performance between two students whose socio-economic status differs by one unit in the PISA ESCS index. A positive value for the slope of the socio-economic gradient signals that advantaged students generally performed better than disadvantaged students.
On average across OECD countries in 2025, students’ socio-economic status accounts for a significant share of the variation in their performance in PISA. PISA data show that 12% of the variation in science performance within each country is associated with socio-economic status, on average. In Ecuador, Luxembourg, Romania, the Slovak Republic and Zambia, out of the 90 countries and economies with available data, students’ socio-economic status accounts for 20% or more of the variation in performance (Table I.B1.2b.2). By contrast, students’ socio-economic status accounts for less than 7% of the variation in performance in 23 other countries and economies.
While a weak association between student socio-economic status and performance within countries/economies is necessary for achieving fairness in education, it is not, in itself, a sufficient condition. It is also important to consider fairness in terms of education systems’ overall levels of performance. A country/economy that combines high levels of fairness in terms of student socio-economic status with low mean performance – indicating poor achievement across the board, regardless of students’ socio-economic status – should not be viewed as a desirable outcome.
As shown in Figure I.2.12, in many cases, countries and economies with higher levels of fairness by socio-economic status are not necessarily those with strong student performance. Similar to what is observed in science, differences in students’ socio-economic status account for 9% of the variation in reading and 12% of the variation in mathematics performance on average across OECD countries (Tables I.B1.2b.3 and I.B1.2b.4).
Another way to describe socio-economic disparities is to examine the score difference associated with a given increase in socio-economic status. On average across OECD countries in 2025, a one-unit increase in the PISA index of economic, social and cultural status is associated with an increase of 36 score points in the science assessment (Table I.B1.2b.2). This is almost twice what 15-year-old students typically learn in a year (see Box I.2.2).11
The performance gap related to students’ socio-economic status is widest in the Slovak Republic, where a one-unit increase in the index is associated with a difference of 48 score points in science. In Germany, Luxembourg and Zambia, the increase in the index is associated with a difference between 45 and 47 score points. By contrast, the associated change in performance amounts to less than 20 score points in 18 countries and economies. While the slope varied between countries/economies, in all countries/economies participating in PISA 2025, more-advantaged students performed better than more disadvantaged ones, with the sole exception of Kenya (Table I.B1.2b.2).
As for science, the performance gap related to students’ socio-economic status (a one-unit increase in the index) is 32 score points for reading, and 35 score points in mathematics, on average across OECD countries (Tables I.B1.2b.3 and I.B1.2b.4).
However, socio-economic gradients do not give information about the size of performance gaps related to differences in socio-economic status between the most and least advantaged students within a country/economy. This metric is shown, instead, by the mean performance of students belonging to the top and bottom quarters of socio-economic status in a country/economy, as presented in Figure I.2.12.
Mean score in science, by national quarters of the PISA index of economic, social and cultural status (ESCS)

Note: Only countries and economies with available data are shown.
Countries and economies are ranked in descending order of science performance for students in the second quarter of national socio-economic status.
Source: OECD, PISA 2025 Database, Table I.B1.2b.2. See https://stat.link/xgs41b for the underlying data.
On average across OECD countries, socio-economically advantaged students (those in the top quarter of the distribution in the ESCS index in their country/economy) scored 85 points more in science than disadvantaged students (those in the bottom quarter of the distribution in their country/economy) (Table I.B1.2b.2). The gap between these two groups of students is higher than 85 score points in 25 countries or economies while the gap is under 50 points in 17 countries or economies. In Bulgaria, Germany, Hungary, Luxembourg, the Netherlands*, Romania, the Slovak Republic and Zambia, the gap between socio-economically advantaged and disadvantaged students is the highest, exceeding 100 score points.
Mean score in science, by international quarters of the PISA index of economic, social and cultural status (ESCS)

Note: Only countries and economies with available data are shown
Countries and economies are ranked in descending order of science performance for students in the second quarter of international socio-economic status.
Source: OECD, PISA 2025 Database, Table I.B1.2b.11. See https://stat.link/xgs41b for the underlying data.
As for science, socio-economically advantaged students scored 77 points more in reading and 83 score points more in mathematics, than disadvantaged students, on average across OECD countries (Tables I.B1.2b.3and I.B1.2b.4).
A complementary way to examine socio-economic gaps is to place all PISA students on a common international socio-economic scale, rather than defining advantage and disadvantage separately within each country or economy. This shows a similar overall pattern: in all participating countries and economies with available data, students in the highest international quarter of socio-economic status perform better in science than students in the lowest international quarter (Figure I.2.13). Socio-economic disparities in science performance are therefore visible whether socio-economic status is measured within countries/economies or on a common international scale.
These average gaps provide an important summary of socio-economic disparities in performance, but they do not show how disadvantage is linked to the risk of low achievement or, conversely, the extent to which some disadvantaged students succeed despite adversity. These questions are examined next.
Changes in socio-economic disparities
The strength in the relationship between science performance and socio-economic status has decreased across OECD countries (Table I.B1.2b.25). Across participating countries in PISA 2025, the strength of the relationship only increased in Indonesia, Macao (China) and the Philippines. Likewise, the strength in the relationship between both reading and mathematics performance and socio-economic status has also decreased across OECD countries (about 4 percentage points). As will be discussed next and shown in Figure I.2.14, in a number of systems, the reasons behind these decreases are possibly related to a decline in academic performance among socio-economically advantaged students while performance remained mostly unchanged among their more disadvantaged peers.
Changes in socio-economic disparities between 2022 and 2025 can be measured by the difference in average performance in science between socio-economically advantaged and disadvantaged students (hereafter, this will be referred to as the “socio-economic gap”). A narrower socio-economic gap means there is less disparity in performance between advantaged and disadvantaged students; by contrast, a wider gap indicates greater disparity.
A shrinking socio-economic gap does not necessarily mean a fairer system that cultivates and expands the opportunities for the most disadvantaged students. A smaller socio-economic gap can result from stagnating performance among disadvantaged students while the performance of advantaged students declines. This is what is observed in science, on average across OECD countries between PISA 2022 and 2025 (Table I.2.10); the socio-economic gap has been reduced by 13 score points on average, due to declining average scores among advantaged students rather than by improvements among disadvantaged students.
Change in science performance by students' socio-economic status¹

1. Socio-economic status is measured by the PISA index of economic, social and cultural status.
Only countries and economies with available data are shown.
Statistically significant differences are shown in a darker tone (see Annex A3).
Countries and economies are ranked in descending order of the change in mean performance in science among disadvantaged students between PISA 2022 and PISA 2025.
Source: OECD, PISA 2025 Database, Table I.B1.2b.22. See https://stat.link/xgs41b for the underlying data.
Note: Only countries and economies that can compare PISA 2022 and PISA 2025 results are shown.
The socio-economic status is measured by the PISA index of economic, social and cultural status.
Statistically significant differences are shown in a darker tone (see Annex A3).
Positive change in mean performance.
Non-significant change.
Negative change in mean performance.
Countries and economies are ranked, in ascending order of the change of socio-economic gap in science performance between 2022 and 2025.
Source: OECD, PISA 2025 Database, Table I.B1.2b.22.
The performance of disadvantaged students in science remained stable between 2022 and 2025 on average across OECD countries (mean score of 447 score points) and in 47 countries/economies (Table I.B1.2b.22). Declines were observed in only 5 countries/economies (Guatemala, Hong Kong (China), Latvia, Morocco and Paraguay).
Systems that achieved greater socio-economic fairness over time are those where the performance of the most disadvantaged students improved as much, or more, than that of their most advantaged peers. As shown in Table I.2.10, disadvantaged students’ performance in science improved in 21 countries/economies; and in all of these countries, the gap with their most advantaged peers either reduced or remained stable. The increase in performance ranged from 13 points (in France, Iceland and the United Kingdom) to over 40 points (in, Georgia, the United Arab Emirates and Uzbekistan). In the latter three countries, the mean score of disadvantaged students in PISA 2022 was lower than 400 points; in other words, these disadvantaged students improved their scores starting from a performance level that was very low (Table I.B1.2b.22).
Advantaged students’ performance in science declined on average across OECD countries (by 8 score points) and in 18 countries/economies, most of them OECD countries. Advantaged students’ performance declined in all cases by over 10 score points and by more than 20 points in 5 countries/economies (Denmark, Israel, Latvia, Slovenia and Sweden) (Table I.B1.2b.22).
The performance of advantaged students in science did not change significantly in 43 countries/economies, and it improved in 12 countries (one OECD country, Türkiye, only). These are countries/economies with very different profiles, where advantaged students’ performance in PISA 2022 was either among the highest across all PISA‑participating countries/economies (Macao (China) and Türkiye), in the middle range (Georgia and Montenegro), or below the baseline (Cambodia and the Philippines); in other words, these advantaged students improved their scores starting from very different performance levels (Table I.B1.2b.22).
Given that, in many countries and economies, science performance remained stable among disadvantaged and advantaged students, it is not surprising that in most, the socio-economic gap in science performance did not change between 2022 and 2025.
Similar patterns are observed in reading and mathematics, where recent changes in the socio-economic gap also need to be interpreted in light of how performance evolved among both advantaged and disadvantaged students.
In reading, on average across OECD countries, mean performance declined significantly among socio-economically advantaged students (by 20 score points), more than among disadvantaged students (by 4 score points). As a result, the socio-economic gap shrank by 17 score points, largely because of the greater decline among advantaged students (Table I.B1.2b.23). The socio-economic gap in reading performance decreased in 37 countries and economies. In 28 of these, performance among advantaged students decreased and was likely the main driver of the reduction in the socio-economic gap. The gap increased only in the Philippines; in the remaining countries and economies, the socio-economic gap in reading did not change (Table I.B1.2b.23).
In mathematics, on average across 35 OECD countries, mean performance declined significantly among socio-economically advantaged students (by 14 score points), while the decline was not significant among disadvantaged students. As a result, the socio-economic gap shrank by 11 score points, again because of the larger decline among advantaged students (Table I.B1.2b.24). The socio-economic gap in mathematics performance decreased in 29 countries and economies. In 22 of these, performance among advantaged students decreased and was likely the main driver of the reduction in the socio-economic gap. The gap increased only in Brazil, the Philippines and Türkiye. In the remaining countries and economies, the socio-economic gap in mathematics did not change between 2022 and 2025 (Table I.B1.2b.24).
Low performance and academically resilient students
As shown in Figure I.2.15, socio-economic disadvantage is strongly associated with a higher risk of low performance in science. On average across OECD countries, 37% of socio-economically disadvantaged students, but only 12% of advantaged students, scored below proficiency Level 2 in science (a gap of 25 percentage points). The difference in the percentage of low performers in science between advantaged and disadvantaged students is 20 percentage points or more in most countries and economies; in Romania it exceeds 50 percentage points and reaches 66 percentage points in Zambia (Table I.B1.2b.14).
Percentage of students who scored below proficiency Level 2 in science, by national quarters of the PISA index of economic, social and cultural status (ESCS)

Notes: Only countries and economies with available data are shown.
Countries and economies are ranked in descending order of the percentage of low performers in science for students in the second quarter of national socio‑economic status.
Source: OECD, PISA 2025 Database, Table I.B1.2b.14. See https://stat.link/xgs41b for the underlying data.
Nevertheless, some disadvantaged students achieve strong results. In PISA, “academically resilient students” are defined as students who are in the bottom quarter of the PISA index of economic, social and cultural status (ESCS) in their own country/economy, but who score in the top quarter of performance in that same country/economy. These students are considered academically resilient because, despite their socio-economic disadvantage, they have attained educational excellence by comparison with students in their own country.
As shown in Figure I.2.16, the percentage of academically resilient students in science varies from less than 10% in some countries/economies (Austria, Belgium, Brazil, Colombia, Ecuador, Germany, Luxembourg, Romania, the Slovak Republic, Sweden, and Zambia) to 22% or more in others (Cambodia, Kenya, Rwanda and Uzbekistan). On average across OECD countries, 12% of disadvantaged students scored in the top quarter of science performance in their own countries/economies and are considered academically resilient. In reading and mathematics, the percentage of academically resilient students is 13% and 12% respectively, on average across OECD countries (Tables I.B1.2b.3and I.B1.2b.4).
Percentage of socio-economically disadvantaged students who scored in the top quarter of science performance in their own country/economy

Notes: Only countries and economies with available data are shown.
Socio-economic status is measured by the PISA index of economic, social and cultural status.
Countries and economies are ranked in descending order of the percentage of resilient students in science.
Source: OECD, PISA 2025 Database, Table I.B1.2b.2. See https://stat.link/xgs41b for the underlying data.
Complementing these analyses, a multidimensional deprivation indicator based on PISA 2025 data captures the extent of student deprivation in terms of a lack of essential items and activities due to financial constraints, across two distinct thresholds: material deprivation and social deprivation. Analyses show that this indicator identifies forms of hardship that, while closely related to socio-economic status, are not fully captured by it. They also show that both lower living standards and more limited opportunities for social participation are associated with weaker learning outcomes (see Box I.2.5).
The multidimensional deprivation indicator derived from PISA 2025 data is a simple aggregated measure designed to capture whether students lack essential items and activities because of financial constraints, adding further detail to analyses based on the PISA index of economic, social and cultural status (ESCS).1 This approach reflects the idea that material hardship often involves the compounding of several disadvantages at once (Boarini and Mira d’Ercole, 2006[41]; Whelan, Layte and Maître, 2002[42]).
To provide a more detailed picture of the most socio-economically disadvantaged students, the indicator distinguishes between two dimensions: material deprivation and social deprivation. Material deprivation identifies students who lack basic goods such as basic clothing like shoes, that cannot afford new clothes,2 and do not have access to facilities such as bath or shower. Social deprivation captures a somewhat broader form of deprivation among students who might even have their basic needs met but lack opportunities for social participation, leisure and cognitive stimulation, such as paid leisure activities, indoor games, or outdoor leisure equipment.3 This distinction follows a broader tradition in deprivation research, which treats poverty not only as lack of income, but also as exclusion from the goods, activities and living conditions considered necessary for ordinary participation in society (Townsend, 1979[43]; Mack and Lansley, 1985[44]).
Across participating countries and economies, material and social deprivation are closely related (system-level correlation r = 0.8), indicating that they often overlap, even if they do not identify exactly the same students or the same forms of hardship. At the same time, deprivation is strongly associated with students’ socio-economic status, as measured by ESCS.4
On average across countries and economies, about 12% of students report at least one form of deprivation. Material and social deprivation are similarly prevalent overall, each affecting about 7% of students on average, although the balance between the two varies considerably across systems (Table I.B1.2b.19). In some countries and economies, students report similar levels of material and social deprivation. This is most often the case in systems where deprivation is relatively limited overall (10% or less), but it is also observed in some systems where more than one-quarter of students report any of the two forms of deprivation, as in Brunei Darussalam, El Salvador, Lebanon, Saudi Arabia and Thailand. In a second group of systems, material deprivation is more prevalent than social deprivation. These are often systems where deprivation is relatively widespread (at least one-quarter of students report any form of deprivation): in Indonesia, the Kurdistan Region (Iraq), Malaysia, the Philippines and Türkiye more than one-third of students report material deprivation. In a third group, social deprivation is more prevalent than material deprivation, especially in systems where more than 20% of students report at least one form of deprivation. In Cambodia, Ecuador, Guatemala and Jordan, at least one-third of students report social deprivation.
Both material and social deprivations are associated with students’ socio-economic status within countries and economies. On average, about 14% of students in the bottom quarter of ESCS report social deprivation, compared to 12% who report material deprivation (Table I.B1.2b.20). Cross-country variation is substantial. Looking only at social deprivation, more than half of socio-economically disadvantaged students report this form of deprivation in Cambodia, Colombia, Ecuador, Guatemala, El Salvador, Jordan, Peru, and the Philippines, whereas fewer than 5% do so in Austria, Croatia and Korea. In 24 out of 63 countries and economies with available data, more than one-quarter of socio-economically disadvantaged students experience social deprivation.
Percentage of students with material, social or any of the two types of deprivation

Notes: Only countries and economies with available data are shown.
Countries and economies are ranked in descending order of the percentage of students with any kind of deprivation.
Source: OECD, PISA 2025 Database, Table I.B1.2b.19. See https://stat.link/xgs41b for the underlying data.
Deprivation cannot be reduced to a narrow measure of basic material lack. Acute material hardship remains highly relevant. However, social deprivation captures another important dimension of disadvantage: exclusion from everyday opportunities for participation, leisure and stimulation. In some contexts, students may not be deprived of the most basic goods, but may still be excluded from activities and resources that support social participation and cognitive development. The indicator therefore helps to identify forms of hardship that may remain only partially visible in broader composite measures of socio-economic status, particularly when disadvantage is expressed through restricted opportunities for social and cognitive participation rather than through the absence of basic goods (Table I.B1.2b.20).
Deprivation is also consistently associated with lower performance in science. On average across participating countries and economies, students reporting any form of deprivation score 52 points lower in science than those who do not report deprivation, and this negative relationship is observed in most participating systems with available data (Table I.B1.2b.21). When the two dimensions are considered separately, material deprivation shows the stronger relationship with science performance, with an average gap of 64 score points, compared with 53 score points for social deprivation. The larger gap associated with material deprivation is consistent with the more severe nature of the items included in that dimension. At the same time, the sizeable gap associated with social deprivation shows that more socially mediated forms of exclusion are also closely linked to weaker learning outcomes.
These results suggest that deprivation provides an important additional lens for understanding disadvantage in PISA 2025. Although the average share of students reporting deprivation is relatively low, the performance gaps associated with deprivation are large. This indicates that the indicator is not merely capturing marginal differences in household resources, but forms of hardship that are strongly related to students’ educational opportunities and outcomes. This makes the multidimensional deprivation indicator a useful complement to ESCS: it identifies concrete forms of deprivation that are closely related to socio-economic position, but not fully reducible to it, and helps describe the conditions faced by students at the most disadvantaged end of the distribution (Tables I.B1.2b.20and I.B1.2b.21).
1. The multidimensional deprivation indicator is based on PISA 2025 data and is a simple aggregated indicator based on binomial variables designed to capture essential items and activities that students lack due to financial constraints, rather than tallying the technological or cultural goods they possess. It directly complements the traditional ESCS index, which often fails to accurately measure living conditions or deep poverty in lower-income contexts.
2. This indicator only considers having second-hand clothes when students reported that this is due to a lack of economic resources and therefore not by choice.
3. The items included in the material dimension are intended to capture more severe forms of deprivation, while those in the social dimension capture a wider form of exclusion from everyday opportunities. The bath/shower item can be described as having strong discriminatory value because it helps distinguish students at the most deprived end of the distribution. The items on shoes and new clothing may capture somewhat less extreme, but still basic, forms of deprivation, making the indicator sensitive to deep poverty. By contrast, lacking outdoor equipment, indoor games or the possibility of participating in paid leisure activities points to constraints on students’ participation in social and cognitively stimulating activities. A key strength of these measures is that most of the relevant PISA items identify enforced lack: students report lacking the item because their parents cannot afford it, rather than because of preference or choice. This is an important methodological principle in deprivation measurement, since robust indicators need to distinguish affordability constraints from voluntary non-consumption (Boarini and Mira d’Ercole, 2006[41]).
4. The share of students reporting either material or social deprivation is highest among those in the bottom quarter of the socio-economic distribution, and declines progressively among students in the second and third quarters and, further still, among socio-economically advantaged students (Table I.B1.2b.20).
Changes in socio-economic disparities at different levels of proficiency
Differences in performance by socio-economic status can also be examined by looking at changes in the proportions of advantaged and disadvantaged students who score below baseline proficiency Level 2 (“low performers”) and at proficiency Levels 5 or 6 (“top performers”) across PISA domains.
As shown in Table I.2.11, the percentage of disadvantaged students who scored below proficiency Level 2 in science did not change significantly on average across 35 OECD countries, although it decreased in 21 countries and economies (out of 73 with available data) between 2022 and 2025. In 9 of these countries and economies, the share of disadvantaged students scoring below Level 2 in science declined by more than 10 percentage points, and in seven it declined by more than 15 percentage points. This trend keeps the share of disadvantaged low performers at levels observed in previous cycles (2015 and 2018).
By contrast, in only three countries and economies, the share of disadvantaged students scoring below Level 2 in science increased. In all of these, over one in four disadvantaged students scored below proficiency Level 2 in science in PISA 2025, ranging from 26% in Hong Kong (China) to 33% in Latvia and 93% in Guatemala (Table I.B1.2b.28).
In 49 countries and economies, the percentage of disadvantaged students scoring below proficiency Level 2 in science did not change significantly between 2022 and 2025.
Among socio-economically advantaged students, the share of low performers in science increased on average across OECD countries (by about two percentage points) between 2022 and 2025. It rose in 12 countries and economies (mostly OECD countries), ranging from around 2 points in Singapore to more than 8 percentage points in Israel and Malta. Conversely, the share of low performers among advantaged students declined in 14 countries and economies, reaching decreases of up to 22 percentage points in Cambodia and 49 percentage points in Uzbekistan. In the large majority of countries and economies, this share did not change significantly.
Negative change in percentage of low performers.
Positive change in percentage of top performers.
Non-significant change.
Positive change in percentage of low performers.
Negative change in percentage of top performers.
Source: OECD, PISA 2025 Database, Tables I.B1.2b.28 and I.B1.2b.31.
In reading, the percentage of disadvantaged students scoring below proficiency Level 2 has increased steadily across cycles. About 42% of disadvantaged students scored below Level 2 in 2025, around two percentage points more than in 2022. In most countries and economies where this share increased, similar increases had already been observed in previous cycles. Among advantaged students, the share scoring below proficiency Level 2 has also risen: the 16% observed in 2025 represents five percentage points more than in 2022. Here too, most countries with increases in recent cycles had already reported increases in earlier cycles (Table I.B1.2b.29).
In mathematics, the share of disadvantaged students scoring below proficiency Level 2 increased in previous cycles and remained high in 2025. About 48% of disadvantaged students scored below Level 2 in 2025, a share not significantly different than that in 2022. Among advantaged students, the share scoring below proficiency Level 2 increased, reaching 18% in 2025, about four percentage points more than in 2022. As in reading, countries and economies with recent increases typically experienced similar patterns in earlier cycles (Table I.B1.2b.30).
As shown in Table I.2.11, between 2022 and 2025, among socio-economically advantaged students, the share of top performers in science decreased on average across OECD countries (by two percentage points) and in 11 countries and economies (all OECD countries), while it increased in three (Macao (China), Montenegro and Türkiye). Among disadvantaged students, the share of top performers in science remained unchanged on average across 35 OECD countries and in 68 countries and economies. It increased in only two countries (the Slovak Republic and the United Arab Emirates) and decreased in three (Indonesia, Hong Kong (China) and Norway*). In Norway*, the share of top performers declined by about 1 percentage point among disadvantaged students and by about 4 percentage points among advantaged students.
In reading, between 2022 and 2025, the share of top-performing advantaged students declined on average across 35 OECD countries (by four percentage points) and in 32 countries and economies, while it increased in only one (Türkiye). It stayed unchanged in the remaining countries and economies (Table I.B1.2b.32).
Among disadvantaged students, the share of top performers in reading remained unchanged on average across OECD countries and in most countries and economies. It increased in only one country (New Zealand*) and declined in four (Canada*, Hong Kong (China), Norway* and Spain) (Table I.B1.2b.32).
In mathematics, between 2022 and 2025, the share of top-performing advantaged students declined on average across 35 OECD countries (by three percentage points) and in 18 countries and economies, while it increased in only one (Türkiye). It stayed unchanged in the remaining countries and economies (Table I.B1.2b.33). In several systems (Canada*, Denmark, Finland, Hungary, and Spain), the decline observed in 2025 is part of a longer-term downward trend since 2015.
Among disadvantaged students, the share of top performers in mathematics remained unchanged on average across OECD countries and in most participating countries and economies. It increased in three countries (the Slovak Republic, New Zealand* and the United Arab Emirates,) and declined in four (Hong Kong (China), Hungary, Singapore and Spain) (Table I.B1.2b.33).
Overall, these results show that recent changes in socio-economic disparities across proficiency levels have been driven more by declining performance among advantaged students, particularly at the top of the distribution, than by sustained improvements among disadvantaged students.
Fairness in terms of student gender
While socio-economic status is one of the strongest predictors of student performance, it is not the only dimension along which educational opportunities and outcomes remain unevenly distributed. Gender is another important axis of inequality in education systems.
Over the past century, many countries have made significant progress in narrowing, and even closing, long-standing gender gaps in educational attainment (Van Bavel, Schwartz and Esteve, 2018[45]). Yet, PISA continues to reveal persistent, subject-specific gender divides, especially in reading and mathematics. Social and cultural contexts that reinforce stereotypical attitudes and behaviours may, in turn, be associated with differences in performance (OECD, 2015[46]; OECD, 2023[3]). These disparities are reflected not only in average results, but also in the composition of top- and low-performing groups. For example, girls remain under-represented among top performers in science and mathematics, which may partly help explain persistent gender gaps in science, technology, engineering and mathematics (STEM) careers (OECD, 2015[46]). By contrast, boys are strongly over-represented among low achievers in reading (OECD, 2023[3]).
Gender disparities in performance at age 15 may have long-term consequences for girls’ and boys’ personal and professional futures (OECD, 2015[46]). Boys who lag behind and lack basic proficiency in reading may face difficulties in gaining access to further education, desirable positions in the labour market, and comprehensive personal development.
To understand these divides more fully, it is necessary to look beyond mean performance and examine the extremes of the performance distribution. As in the earlier analyses of socio-economic disparities, gender differences are often more pronounced among the highest- or lowest-achieving students than they are at the mean (Baye and Monseur, 2016[47]).
Gender and mean performance
In PISA 2025, girls performed slightly above boys in science by one score point on average across OECD countries (mean score difference in Figure 2.18). While boys outperformed girls in science in 17 countries and economies, girls outperformed boys in another 35 countries or economies. The widest gaps in science performance in favour of girls (about 20 score points or more) were observed in North Macedonia, Jordan, Slovenia, Finland, Mongolia, Bulgaria, the Kurdistan Region (Iraq) and the Palestinian Authority, (in ascending order); the widest gaps in favour of boys (over 20 score points) were observed in Kenya and Rwanda. In 37 countries and economies, the mean difference in science performance between boys and girls is not statistically significant.
Figure I.2.18 shows not only differences in the average performance of boys and girls, but also differences at the extreme ends of the performance distribution. It is important to consider performance differences at these extremes because variation in student performance (as measured by the standard deviation) is greater among boys than girls in all subjects measured by PISA on average across OECD countries and in most countries/economies (Tables I.B1.2c.1, I.B1.2c.2 and I.B1.2c.3).
The science results illustrate particularly clearly why looking only at mean performance can be misleading: gender differences are small on average, but more pronounced at the lower and upper ends of the distribution.
In science, the highest-performing boys outperform the highest-performing girls on average across OECD countries (10 score points difference) and in the largest group of countries/economies. In seven countries/economies, the highest-performing girls outperformed the highest-performing boys. In the Kurdistan Region (Iraq) and the Palestinian Authority, they did so by more than 23 score points.
Among the 10% weakest-performing students, the pattern is reversed and girls outperformed boys on average across OECD countries (12 score point difference) and in 54 out of the 89 countries/economies with available data (Figure I.2.18). In Croatia, Finland, the Palestinian Authority and Slovenia, the weakest-performing girls outperformed the weakest-performing boys by more than 30 score points. These results suggest that the average gender differences are most likely being outweighed by the differences in the mid and bottom of the performance distribution.
In reading, girls outperformed boys on average mean score (by 30 score points), and at both extremes of the performance distribution (Table I.B1.2c.2). Girls outperformed boys in reading in all countries and economies, with three exceptions (in Kenya and Zambia, the difference in reading performance between boys and girls is not statistically significant, and in Rwanda, boys outperform girls by 6 score points). The widest gaps in reading performance in favour of girls (45 score points or more) were observed in Finland, Greece, Malta, Croatia, Bulgaria, Slovenia and the Palestinian Authority (in ascending order). Moreover, the weakest-performing girls outperformed the weakest-performing boys on average across OECD countries (40 score points difference) and in all countries/economies with the sole exceptions of Rwanda and Zambia (no statistically significant differences). Similarly, the highest-performing girls outperformed the highest-performing boys on average across OECD countries (by 19 score points) and in most countries/economies.
Score-point difference in mean science performance between boys and girls and between low- and high-performing boys and girls (10th and 90th percentiles)

Notes: Statistically significant differences are shown in a darker tone (see Annex A3).
Countries and economies are ranked in descending order of the score-point difference for the mean in science related to gender (boys minus girls).
Source: OECD, PISA 2025 Database, Table I.B1.2c.1. See https://stat.link/xgs41b for the underlying data.
In mathematics, boys outperformed girls on average mean scores (by 13 score points), as well as at both extremes of the performance distribution (Table I.B1.2c.3). Among the weakest-performing students, boys outperformed girls on average across OECD countries (by 3 score points) although in a majority of countries and economies there were no significant differences. The gender gap is much larger among the highest-performing students. At the upper end of the distribution, boys outperformed the highest-performing girls on average across OECD countries (by 24 score points) and in most countries/economies. Only in the Palestinian Authority the gender gap is reversed.
Changes in gender disparities
Table I.2.12 shows changes between 2022 and 2025 in the difference between boys and girls (hereafter, this difference will be referred to as the “gender gap”) in average science performance.
Notes: Only countries and economies that can compare PISA 2022 and PISA 2025 results are shown.
Positive change in mean performance.
Non-significant change.
Negative change in mean performance.
Source: OECD, PISA 2025 Database, Tables I.B1.2c.23, I.B1.2c.24 and I.B1.2c.25. See https://stat.link/xgs41b for the underlying data.
As shown in the table, the gender gap in science performance did not change between 2022 and 2025 on average across OECD countries, and in most countries/economies (64 out of the 75 with comparable data). The gender gap widened in favour of girls in four countries/economies and shrank in six. It widened in favour of boys in Hong Kong (China) only (Table I.B1.2c.25).
The gender gap in performance widened the most (16 score points) in Hong Kong (China) where boys’ and girls’ performance declined, but the drop was the largest among girls (33 score points). Moreover, Kosovo, Latvia and Chinese Taipei saw important gender-gap widening. Latvia is among countries where girls’ performance declined the most (by 19 score points), but boys’ performance dropped even more than for girls (by 32 score points).
Similarly, the gender gap widened in Mongolia, mainly driven by an increase in mean performance among girls (by 16 score points) while boys’ performance remained more stable.
On the opposite end, in Brunei Darussalam, the gap shrank and became non-significant due to a strong drop in performance among girls, while boys’ scores remained unchanged between 2022 and 2025. Something similar happened in Iceland, which saw an important decrease in the gap, pulled by a drop in girls’ scores in science. In Jordan and the United Arab Emirates, the narrowing gap was driven by an important increase in boys’ performance even if girls’ also increased albeit to a lesser extent.
Girls’ performance in science did not change between 2022 and 2025, on average across OECD countries. It declined in 15 countries/economies; it did not change significantly in another 45 countries/economies and improved in 15 countries/economies. Girls’ performance in science declined by more than 33 score points in Hong Kong (China) and about 24 points in Guatemala. On the opposite end, it increased by more than 85 score points in Uzbekistan and between 34 and 38 score points in Cambodia, Georgia and Montenegro.
Performance trends in science among boys were also predominantly stable. Boys’ performance did not change significantly, on average and in 48 countries/economies; it declined in 13 countries/economies and improved in 14. Boys’ performance in science declined by about 32 score points in Latvia, about 29 points in Israel, and over 20 points in Guatemala and Serbia.
In reading, the gender gap in performance widened in favour of girls between 2022 and 2025, on average across OECD countries (by five score points), and in 19 countries/economies. The gender gap narrowed in 7 countries/economies, and it remained unchanged in most countries/economies (Table I.B1.2c.28). In all countries and economies with no significant changes between 2022 and 2025, girls outperformed boys in reading; in 23 of these countries, girls’ performance declined in the same period. Of the 19 countries and economies where the gender gap widened, boys’ performance declined in 18 of them and girls’ performance declined in 8 (in all cases, the drop was smaller). Among countries and economies where the gender gap narrowed (i.e. in favour of boys), in Malaysia, girls’ performance did not change significantly while boys’ increased. In two others, girls’ performance decreased while boys’ performance remained stable (Brunei Darussalam), or also decreased but to a lesser extent (Hong Kong (China)). In other three countries (Jordan, the Philippines and the United Arab Emirates), both girls’ and boys’ performance increased but to a larger extent for boys (Tables I.B1.2c.26, I.B1.2c.27and I.B1.2c.28).
Girls’ performance in reading declined by 12 score points between 2022 and 2025, on average across the 35 OECD countries with comparable data for the two cycles. It also declined in 34 countries/economies; it did not change significantly in another 33 countries/economies and improved in 8 countries/economies. Girls’ performance in reading declined by about 30 points or more in Guatemala, Israel and Latvia. Girls’ performance in reading increased between 16 and 17 score points in Cambodia, Montenegro and the Philippines (Table I.B1.2c.26).
Trends among boys were also predominantly negative and performance in reading declined by 17 points, on average. Boys’ performance in reading declined in 48 countries/economies; it did not change significantly in 19 countries/economies and improved in 8. Boys’ performance in reading declined by about 52 points in Latvia, and about 46 points in Israel (Table I.B1.2c.27).
In mathematics, the gender gap in performance widened in favour of boys between 2022 and 2025, on average across 35 OECD countries (by four score points), and in 5 countries/economies – it also inverted in favour of boys in another 3 systems. The gender gap narrowed in Brunei Darussalam, Finland, the Philippines, Qatar and Serbia, and it remained unchanged in most countries/economies (in 61 out of the 75 with comparable data) (Table I.B1.2c.31). Yet, in most countries and economies with no significant changes between 2022 and 2025, boys outperformed girls in mathematics; in 32, boys’ performance in mathematics remained the same between the two cycles, in 23 it decreased in the same period. In Serbia, where the gender gap narrowed and virtually disappeared, performance in mathematics declined for both boys and girls, but the drop was larger for boys. In other three systems where the gender gap also became non-significant (Brunei Darussalam, Finland and Qatar), girls results were behind those of boys. Among countries and economies where the gender gap widened in favour of boys, in Canada* and Kazakhstan, the performance of boys and girls declined with larger drops for girls. In Argentina, only girls’ performance declined (Tables I.B1.2c.29, I.B1.2c.30and I.B1.2c.31).
Girls’ performance in mathematics declined by 11 score points on average between 2022 and 2025. It also declined in 36 countries/economies; it did not change significantly in another 32 countries/economies and it improved in 7 countries/economies. Girls’ performance in mathematics declined by more than 23 score points in Hong Kong (China) and Slovenia, between 21 and 23 points in Latvia and Malta, and over 20 points in Denmark and Israel. Girls’ performance in mathematics increased between 21 and 27 score points in Cambodia, Georgia and Jordan (Table I.B1.2c.29).
Performance trends among boys were also predominantly negative. Boys’ performance in mathematics declined by 7 points on average. It declined in 27 countries/economies, it did not change significantly in 39 countries/economies, and it improved in 9. Boys’ performance in mathematics declined by about 31 score points in Malta, between 28 and 29 points in Israel and Serbia, and about 25 points in Slovenia (Table I.B1.2c.30).
Gender and low performance
Differences at the lower end of the performance distribution are reflected in the share of students who did not attain baseline proficiency.
As shown in Figure I.2.19, on average across OECD countries in 2025, 27% of boys and 24% of girls are low performers in science. In 51 countries and economies, more boys than girls are low performers in science, whereas more girls than boys scored below proficiency Level 2 in science in 7 countries and economies.
Gender gaps in the share of low performers in science are generally small. The widest gender gaps in low science performance were observed in:
Mexico and Kenya (in ascending order), where the share of girls who did not attain proficiency Level 2 is greater than the corresponding share of boys by between 6 and 10 percentage points.
Croatia, Jordan, Bulgaria, Mongolia and the Palestinian Authority (in ascending order) where the share of boys who did not attain proficiency Level 2 is larger than the corresponding share of girls by between 10 and 16 percentage points.
In reading, differences are more pronounced: boys performed significantly worse than girls. On average across OECD countries in PISA 2025, 37% of boys and 25% of girls did not attain the baseline level of proficiency in reading. In 84 out of 89 countries and economies with comparable data, a larger share of boys than girls are low performers in reading; in Montenegro, Greece, the Palestinian Authority and Croatia (in ascending order) this difference is larger than 20 percentage points (Table I.B1.2c.15).
In mathematics, the differences between boys and girls are not significant in most countries and economies. On average across OECD countries, 33% of boys and 36% of girls did not attain the baseline level of proficiency in mathematics. In 32 out of 89 countries and economies with comparable data, a larger share of girls than boys are low performers, with gaps under 10 percentage points with the sole exception of Costa Rica, where this difference is about 13 percentage points (Table I.B1.2c.16).
Percentage of students who score below proficiency Level 2 in science, by gender

Notes: Statistically significant differences are shown in a darker tone (see Annex A3).
Countries and economies are ranked in descending order of the percentage of low-performing boys in science.
Source: OECD, PISA 2025 Database, Table I.B1.2c.14. See https://stat.link/xgs41b for the underlying data.
Gender and top performance
On average across OECD countries, about 8% of boys and 6% of girls scored at proficiency Level 5 or 6 in science (Figure I.2.20). In most countries and economies participating in PISA 2025, there are no statistically significant differences in the share of top-performing boys and girls in science. Among the 33 countries and economies where such differences are observed, most are small (i.e. lower than five percentage points). However, in B-S-J-Z (China), the share of top performers is about seven percentage points higher among boys than among girls. Only in Finland is the share of top performers larger among girls than among boys, by about two percentage points.
Percentage of students who score at proficiency Level 5 or above in science, by gender

Notes: Statistically significant differences are shown in a darker tone (see Annex A3).
Countries and economies are ranked in descending order of the percentage of top-performing boys in science.
Source: OECD, PISA 2025 Database, Table I.B1.2c.14. See https://stat.link/xgs41b for the underlying data.
On average across OECD countries, 5% of boys and 7% of girls scored at proficiency Level 5 or above in reading (Table I.B1.2c.15). In 32 countries and economies, a larger share of girls than boys are top performers in reading; only in New Zealand*, Singapore and Chinese Taipei is this difference larger than five percentage points. In most countries and economies, the difference between boys and girls in the share of top performers in reading is not statistically significant. In no country/economy is the share of top performers in reading larger among boys than among girls.
In mathematics, about 10% of boys and 6% of girls scored at proficiency Level 5 or above, on average across OECD countries (Table I.B1.2c.16). In most countries and economies, a larger share of boys than girls are top performers in mathematics. Only in B-S-J-Z (China), Hong Kong (China) and Macao (China) do the differences exceed 7 percentage points but remain below 10 percentage points. In no country/economy is the share of top performers in mathematics larger among girls than among boys.
These results show that gender disparities in performance vary markedly across subjects and across different parts of the performance distribution.
Changes in gender disparities at different levels of proficiency
As shown in Table I.2.13, the percentage of girls who scored below proficiency Level 2 in science did not change on average across OECD countries, nor in most countries/economies (45 out of 75 with available data), between 2022 and 2025. In 15 countries and economies, the share decreased. In Jordan, Montenegro, Saudi Arabia and Thailand, the share of girls scoring below Level 2 in science decreased by more than 10 percentage points, and in Cambodia, Georgia and Uzbekistan, this share decreased by more than 20 percentage points. In another 15 countries/economies, the percentage of girls who scored below proficiency Level 2 in science increased, especially in Hong Kong (China) (by over 10 percentage points).
Similarly, there was no significant average change among boys. Between 2022 and 2025, the share of low-performing boys in science did not change on average across OECD countries and in most countries/economies, it decreased in 13 countries/economies and increased in another 14. In Uzbekistan, the share of low-performing boys in science decreased by over 42 percentage points. At the opposite end, the share increased by over 10 percentage points in Latvia and Serbia.
Regarding top-performing girls in science, there was no significant change on average across OECD countries or in 68 of the 75 countries and economies with comparable data. Only five countries/economies (Georgia, Montenegro, Chinese Taipei, Türkiye and the United Arab Emirates) recorded increases, all of them under five percentage points. Decreases were observed only in Brunei Darussalam and Czechia, the largest being about two percentage points (Table I.2.13).
Among boys, the share of top performers in science did not change significantly on average across OECD countries or in 62 of 75 countries/economies; it increased in seven systems and decreased in six others. The largest decreases ranged between two and three percentage points in Denmark, Latvia and the Netherlands*. The largest increases were observed in Türkiye and the United Kingdom, at between three and five percentage points.
In reading, the percentage of girls who scored below proficiency Level 2 was 25% in 2025, representing an increase of 4 percentage points on average across 35 OECD countries between 2022 and 2025. This pattern was observed in 28 countries and economies. Yet in most systems, the share did not change between the two cycles. In 8 countries and economies, the share decreased (Table I.B1.2c.34).
A significant increase was also observed among boys. Between 2022 and 2025, the share of low-performing boys in reading was 36%, representing an increase of 6 percentage points on average across OECD countries. Most countries and economies (44) saw an increase, while the share decreased in 8 countries/economies.
Negative change in percentage of low performers.
Positive change in percentage of top performers.
Non-significant change.
Positive change in percentage of low performers.
Negative change in percentage of top performers.
Source: OECD, PISA 2025 Database, Tables I.B1.2c.32 and I.B1.2c.33.
Moreover, the percentage of top-performing girls – those who scored at Level 5 or above in reading – was 7% on average across 35 OECD countries, representing a decrease of 2 percentage points relative to 2022. While 20 countries and economies showed declines, in 54 systems, the share remained unchanged between the two cycles. Only in Türkiye was there an increase, of 3 percentage points (Table I.B1.2c.35).
Among boys, the findings are similar to those observed among girls: about 5% of boys reached top performance in reading in 2025, on average across OECD countries, representing a decline of 2 percentage points relative to 2022. In 27 systems, the share also declined. Here too, in most countries (47) the share remained unchanged, while in Türkiye it increased by 2 percentage points.
In mathematics, the percentage of girls who scored below proficiency Level 2 was 35% in 2025, representing an increase of 5 percentage points on average across 35 OECD countries between 2022 and 2025. This pattern was observed in 36 countries and economies. Yet in 33 systems, the share did not change between the two cycles. In 6 countries and economies, the share decreased (Table I.B1.2c.36).
A significant increase was also observed among boys. Between 2022 and 2025, the share of low-performing boys in mathematics was 32%, representing an increase of 3 percentage points on average across OECD countries. In 23 countries/economies, the share increased, while it did not change in 41 and decreased in 11 countries/economies.
Moreover, the percentage of top-performing girls – those who scored at Level 5 or above in mathematics – was 6% on average across OECD countries, representing a small decrease of less than 1 percentage point relative to 2022. While 13 countries and economies showed similar declines, in 60 systems the share remained unchanged between the two cycles. Only in Türkiye and the United Arab Emirates were increases observed, of 1 and 2 percentage points, respectively (Table I.B1.2c.37).
Among boys, the picture is similar to that observed among girls: about 10% of boys reached top performance in mathematics in 2025, on average across OECD countries, representing a decline of 1 percentage point relative to 2022. In 14 systems, the share also declined. Here too, in most countries and economies (58) the share remained unchanged, while in the Slovak Republic, Türkiye and the United Arab Emirates it increased by between 2 and 4 percentage points.
Fairness in terms of student immigrant background
A fair education system gives students with an immigrant background an equal opportunity to thrive at school and realise their full learning potential compared to those without an immigrant background. PISA defines immigrant students as students whose mother and father were both born in a country/economy other than that where the student took the PISA test. Non-immigrant students are students who have at least one parent born in the country of assessment. This section examines the extent to which the countries and economies that participated in PISA 2025 ensure that all students are on a level playing field, regardless of their background.
Overall, the results presented in this chapter show that non-immigrant students tend to outperform immigrant students in all PISA subjects in many, though not all, countries and economies. However, this raw performance gap is rarely a function of immigrant status alone. Instead, these students often navigate intersecting layers of disadvantage (Bowleg, 2012[48]; Cerna et al., 2021[49]) In some countries and economies, students with an immigrant background are disproportionately likely to come from socio-economically disadvantaged families compared to non-immigrant students (OECD, 2023[3]). Furthermore, a significant proportion of these students face the additional challenge of navigating an education system in a language different from the one they speak at home, a challenge that is particularly acute for first-generation immigrants and for those who arrive to a new country/economy later on in their educational trajectories (OECD, 2023[3]).
Once socio-economic status and the language spoken at home are taken into account, the picture often changes. In many education systems, immigrant students actually outperform their non-immigrant peers, demonstrating remarkable academic resilience and a strong drive to succeed (Cerna et al., 2021[49]; OECD, 2023[3]). This reversal suggests that the educational vulnerabilities associated with an immigrant background are not inevitable, but are instead largely shaped by features of education systems, as well as linguistic barriers.
Moreover, several countries and economies combine a large share of students with an immigrant background (i.e. over 30% of students) with high average levels of performance (Australia, Canada*, Macao (China), New Zealand* and Singapore) (Tables I.B1.2d.1 and I.B1.2d.10). PISA results support the view that policies aimed at dismantling cultural and linguistic barriers – through targeted language support, intercultural education, and the promotion of inclusive school climates that value diversity – can improve the outcomes of immigrant students (Cerna et al., 2021[49]; OECD, 2023[3]; Tarozzi, 2012[50]). At the same time, these results should be interpreted in light of differences in immigrant student profiles across countries and economies. In some systems, immigration policies and selection mechanisms may shape the socio-economic background, language proficiency and other characteristics of immigrant populations, and may partly explain the positive outcomes observed among immigrant students.
Education systems around the world vary greatly in terms of how large their immigrant student population is (Table I.B1.2d.1). In almost half of the countries and economies in PISA 2025 (42 out of 87), the share of 15-year-old students with an immigrant background is small (less than 5%). But in 24 countries and economies, the share of immigrant students is higher than 15%; in 14 countries and economies it is higher than 25%; and in Luxembourg, Macao (China), Qatar and the United Arab Emirates, more than half of students have an immigrant background. On average across 29 OECD countries with available data, 18% of students have an immigrant background. The composition of immigrant student populations can also vary considerably within countries and economies, with students differing by country of origin, language spoken at home, socio-economic background, and cultural proximity to the host country. As a result, average outcomes for students with an immigrant background may mask important differences between immigrant sub-groups within the same education system.
Students with an immigrant background can be distinguished between first- and second-generation immigrants. First‑generation immigrants are students born outside the country of assessment and whose parents were also born outside the country of assessment. Second-generation students are students born in the country of assessment but whose parent(s) were born outside the country of assessment. The share of second-generation immigrants is 10% and the share of first-generation immigrants 8% on average across OECD countries in PISA 2025 (Table I.B1.2d.1).
These differences in the size and composition of immigrant student populations provide important context for interpreting performance gaps between immigrant and non-immigrant students across education systems.
Immigrant students and socio-economic status
Students with an immigrant background typically have a more disadvantaged socio-economic profile than non-immigrant students.
As shown in Figure I.2.21, the share of disadvantaged students is about 41% among immigrant students and 21% among non-immigrant students, on average across 29 OECD countries. When considering countries and economies where at least 5% of students have an immigrant background, in Austria, Denmark, France, Greece, Iceland, Italy, and Norway*, the difference in the share of disadvantaged students by immigration background is the largest, with a gap of more than 30 percentage points, indicating an importantly larger share of immigrant students that are socio-economically disadvantaged (Table I.B1.2d.4).
There are, however, two countries and economies where the opposite pattern is observed, Montenegro and Singapore, where the share of disadvantaged students is greater among non-immigrant than immigrant students by more than 5 percentage points.
In ten of these countries and economies, the share of disadvantaged students is not statistically significantly different by immigration background.
Percentage of students in the bottom quarter of socio-economic status, by immigrant background

Notes: Only countries and economies where at least 5% of students have an immigrant background are shown.
Statistically significant differences are shown in a darker tone (see Annex A3).
Socio-economic status is measured by the PISA index of economic, social and cultural status (ESCS).
Countries and economies are ranked in descending order of the percentage of disadvantaged students among non-immigrant students.
Source: OECD, PISA 2025 Database, Table I.B1.2d.4. See https://stat.link/xgs41b for the underlying data.
Immigrant students and language spoken at home
Across OECD countries, on average, most students with an immigrant background speak a language at home that is different from the language in which they took the PISA assessment (Figure I.2.22). This is especially the case for first-generation immigrant students, though not necessarily for second-generation immigrants. This language barrier can be particularly hard to overcome for first-generation immigrant students who not only were born, but in some cases completed part of their education, in countries where the language is different from that of the host country.
In 2025 and earlier assessments, PISA asked students which language they spoke at home most of the time. On average across 29 OECD countries with comparable data in PISA 2025, 16% of all students (regardless of their immigrant background) speak a language at home that is different from the language in which they took the PISA assessment (Table I.B1.2d.6). This proportion is greater among immigrant students than non-immigrant students, on average across 29 OECD countries (a difference of 53 percentage points) and in 67 out of 87 countries/economies with available data (including countries/economies where less than 5% of students have an immigrant background) (Table I.B1.2d.6).
Among first-generation immigrant students, the percentage of students who mainly speak another language at home is 71% on average across 29 OECD countries, whereas it is 47% among second-generation immigrant students (Table I.B1.2d.6). As shown in Figure I.2.22, in Czechia, Finland, Iceland and Slovenia more than 90% of first-generation immigrant students reported that they mainly speak another language at home. In Lebanon, about 87% of second-generation immigrant students mainly speak another language at home.
These differences in socio-economic profile and language spoken at home help explain why raw performance gaps between immigrant and non-immigrant students should not be interpreted as reflecting immigrant background alone.
Percentage of first- generation and second- generation immigrant students who do not speak the language of assessment at home

Notes: Only countries and economies where at least 5% of students have an immigrant background are shown.
Countries and economies are ranked in descending order of the percentage of first-generation immigrant students who do not speak the language of assessment at home.
Source: OECD, PISA 2025 Database, Table I.B1.2d.6. See https://stat.link/xgs41b for the underlying data.
Proportion of students with immigrant background and systems’ average performance
PISA 2025 provides no basis for the claim that larger proportions of students with an immigrant background are related to poorer education outcomes in host countries.
PISA data show a positive relationship between the share of immigrant students and mean performance in science in PISA 2025, meaning that, on average, countries with larger shares of immigrant students also tend to show higher mean performance in science. Among countries that have between 5 and 15 percent of immigrant students, there is wide variation in mean performance; for example, Estonia and Iceland have similar shares of immigrant students (about 10%) but very different mean performances in science (441 points in Iceland and 527 in Estonia). By contrast, among countries/economies where the share of immigrant students is between 15% and 40%, the correlation is much stronger: Australia, Canada*, New Zealand* and Singapore, are examples of countries/economies that receive many immigrant students and show strong performances (Tables I.B1.2a.1 and I.B1.2d.6).
Luxembourg, Macao (China), Qatar and the United Arab Emirates and are outliers in the sense that their share of immigrant students is much higher (i.e. more than 50% of the student population) than that of all other PISA-participating countries/economies. Each should therefore be examined in its own context (i.e. the social and demographic profile of the immigrant population, immigration policies, and educational policies towards immigrant students). Macao (China) has one of the highest levels of science performance; by contrast, Luxembourg, Qatar and the United Arab Emirates performed below the OECD average in science (Tables I.B1.2a.1 and I.B1.2d.10).
These results should be interpreted carefully because they do not take national income into account, even though national income is correlated with both mean performance and the share of immigrant students. After accounting for national income, the correlation between the share of immigrant students and mean performance in science in PISA 2025 becomes very weak or close to zero.
Performance gap according to student’s immigrant background
When student performance is compared between immigrant and non-immigrant students within countries and economies, net differences (i.e. differences after accounting for socio-economic and linguistic backgrounds) in science performance by immigrant background are typically smaller than raw differences (i.e. before accounting for these backgrounds) (Figure I.2.23). Immigrant students tend to have more disadvantaged socio-economic status and a home language more likely to be different from the language of instruction in their schools.
Difference in science score between non-immigrant students and immigrant students (immigrant students - non-immigrant), before and after accounting for socio-economic status and language spoken at home

Notes: Only countries and economies where at least 5% of students have an immigrant background are shown.
Statistically significant differences are shown in a darker tone (see Annex A3).
Socio-economic status is measured by the PISA index of economic, social and cultural status (ESCS).
Countries and economies are ranked in descending order of the gap in science performance related to immigrant background, after accounting for students' socio-economic status and language spoken at home.
Source: OECD, PISA 2025 Database, Table I.B1.2d.10. See https://stat.link/xgs41b for the underlying data.
As shown in Figure I.2.23, in two countries (Argentina and Luxembourg), non-immigrant students outperformed immigrant students in science before accounting for other variables, but after accounting for student socio-economic status, the net score-point difference was no longer statistically significant.
After accounting for students’ socio-economic status and language spoken at home, immigrant students scored higher in science than non-immigrant students in 13 countries/economies, while non-immigrant students scored higher in science than immigrant students in 21 countries/economies (as on average across 29 OECD countries with comparable data). The difference between immigrant and non-immigrant students is not statistically significant in 10 countries/economies after accounting for students’ socio-economic status and language spoken at home.
In reading and mathematics, patterns similar to those observed in science are found.
Trends in disparities in performance by immigrant background
Between 2022 and 2025, disparities in science performance by students’ immigrant background remained unchanged, on average across 29 OECD countries, after accounting for students' socio-economic status and language spoken at home (Table I.B1.2d.10). They only widened in favour of immigrant students in Qatar and Singapore, among countries with more than 5% of immigrant students in PISA 2025.
In Qatar, the gap in science performance increased by 12 score points, after accounting for students’ socio-economic status and language spoken at home, between 2022 and 2025. In Singapore, the gap in science performance in terms of immigrant background more than doubled from 15 score points in 2022 to 32 score points in 2025 (Table I.B1.2d.10).
In the same period, among countries with more than 5% of immigrant students, disparities in science performance widened in favour of non-immigrants in Iceland, Portugal and Spain, after accounting for students’ socio-economic status and language spoken at home. Particularly large increases occurred in Iceland and Portugal (28 and 14 score points, respectively), where there were no such disparities in PISA 2022 (Table I.B1.2d.10).
Finally, in Serbia, disparities in favour of immigrant students shrank and became non-significant between 2022 and 2025, after accounting for students' socio-economic status and language spoken at home. In Hong Kong (China), disparities in favour of immigrant students also decreased in the same period, although they remained significant after accounting for students' socio-economic status and language spoken at home (Table I.B1.2d.10).
References
[17] Altamura, L., C. Vargas and L. Salmerón (2023), “Do New Forms of Reading Pay Off? A Meta-Analysis on the Relationship Between Leisure Digital Reading Habits and Text Comprehension”, Review of Educational Research, Vol. 95/1, pp. 53-88, https://doi.org/10.3102/00346543231216463.
[22] Avvisati, F. (2017), “Does the quality of learning outcomes fall when education expands to include more disadvantaged students?”, PISA in Focus, No. 75, OECD Publishing, Paris, https://doi.org/10.1787/06c8a756-en.
[6] Avvisati, F. and P. Givord (2023), “The learning gain over one school year among 15-year-olds: An international comparison based on PISA”, Labour Economics, Vol. 84, p. 102365, https://doi.org/10.1016/j.labeco.2023.102365.
[7] Avvisati, F. and P. Givord (2021), “How much do 15-year-olds learn over one year of schooling? An international comparison based on PISA”, OECD Education Working Papers, No. 257, OECD Publishing, Paris, https://doi.org/10.1787/a28ed097-en.
[16] Baron, N., R. Calixte and M. Havewala (2017), “The persistence of print among university students: An exploratory study”, Telematics and Informatics, Vol. 34/5, pp. 590-604, https://doi.org/10.1016/j.tele.2016.11.008.
[47] Baye, A. and C. Monseur (2016), “Gender differences in variability and extreme scores in an international context”, Large-scale Assessments in Education, Vol. 4/1, https://doi.org/10.1186/s40536-015-0015-x.
[41] Boarini, R. and M. Mira d’Ercole (2006), “Measures of Material Deprivation in OECD Countries”, OECD Social, Employment and Migration Working Papers, No. 37, OECD Publishing, Paris, https://doi.org/10.1787/866767270205.
[24] Borgonovi, F. et al. (2017), “Youth in Transition: How Do Some of The Cohorts Participating in PISA Fare in PIAAC?”, OECD Education Working Papers, No. 155, OECD Publishing, Paris, https://doi.org/10.1787/51479ec2-en.
[38] Bourdieu, P. (2018), Cultural Reproduction and Social Reproduction, Routledge, https://doi.org/10.4324/9781351018142.
[48] Bowleg, L. (2012), “The Problem With the Phrase “Women and Minorities”: Intersectionality—an Important Theoretical Framework for Public Health”, American Journal of Public Health, Vol. 102/7, pp. 1267-1273, https://doi.org/10.2105/ajph.2012.300750.
[49] Cerna, L. et al. (2021), “Promoting inclusive education for diverse societies: A conceptual framework”, OECD Education Working Papers, No. 260, OECD Publishing, Paris, https://doi.org/10.1787/94ab68c6-en.
[25] Chmielewski, A. (2019), “The Global Increase in the Socioeconomic Achievement Gap, 1964 to 2015”, American Sociological Review, Vol. 84/3, pp. 517-544, https://doi.org/10.1177/0003122419847165.
[37] Coleman, J. (1988), “Social capital in the creation of human capital.”, American Journal of Sociology, 94, pp. S95-S120.
[27] De Witte, K. et al. (2013), “A critical review of the literature on school dropout”, Educational Research Review, Vol. 10, pp. 13-28, https://doi.org/10.1016/j.edurev.2013.05.002.
[10] Duke, N. and P. Pearson (2009), “Effective Practices for Developing Reading Comprehension”, Journal of Education, Vol. 189/1-2, pp. 107-122, https://doi.org/10.1177/0022057409189001-208.
[33] Duncan, G., J. Brooks-Gunn and P. Klebanov (1994), “Economic Deprivation and Early Childhood Development”, Child Development, Vol. 65/2, p. 296, https://doi.org/10.2307/1131385.
[32] Eriksson, K. et al. (2021), “Socioeconomic Status as a Multidimensional Predictor of Student Achievement in 77 Societies”, Frontiers in Education, Vol. 6, https://doi.org/10.3389/feduc.2021.731634.
[21] GEM Report UNESCO (2015), Education for All Global Monitoring Report 2015: Education for All 2000-2015: Achievements and challenges, GEM Report UNESCO, https://doi.org/10.54676/lbsf6974.
[31] Gubbels, J., C. van der Put and M. Assink (2019), “Risk Factors for School Absenteeism and Dropout: A Meta-Analytic Review”, Journal of Youth and Adolescence, Vol. 48/9, pp. 1637-1667, https://doi.org/10.1007/s10964-019-01072-5.
[29] Hanushek, E. and L. Woessmann (2008), “The Role of Cognitive Skills in Economic Development”, Journal of Economic Literature, Vol. 46/3, pp. 607-668, https://doi.org/10.1257/jel.46.3.607.
[13] Kamil, M. (ed.) (2000), Engagement and Motivation in Reading, Lawrence Erlbaum.
[36] Kao, G. and J. Thompson (2003), “Racial and Ethnic Stratification in Educational Achievement and Attainment”, Annual Review of Sociology, Vol. 29/1, pp. 417-442, https://doi.org/10.1146/annurev.soc.29.010202.100019.
[44] Mack, J. and S. Lansley (1985), Poor britain, London: G. Allen & Unwin.
[15] Mol, S. and A. Bus (2011), “To read or not to read: A meta-analysis of print exposure from infancy to early adulthood.”, Psychological Bulletin, Vol. 137/2, pp. 267-296, https://doi.org/10.1037/a0021890.
[20] OECD (2026), Every Day Counts: Understanding, Preventing and Responding to School Attendance Problems, OECD Publishing, Paris, https://doi.org/10.1787/7c6f6c3e-en.
[23] OECD (2026), “Towards a stronger link between PISA and PIAAC: Two assessments, one story?”, OECD Education Working Papers, No. 349, OECD Publishing, Paris, https://doi.org/10.1787/95e96165-en.
[4] OECD (2025), Education at a Glance 2025: OECD Indicators, OECD Publishing, Paris, https://doi.org/10.1787/1c0d9c79-en.
[9] OECD (2025), Results from TALIS 2024: The State of Teaching, TALIS, OECD Publishing, Paris, https://doi.org/10.1787/90df6235-en.
[3] OECD (2023), PISA 2022 Results (Volume I): The State of Learning and Equity in Education, PISA, OECD Publishing, Paris, https://doi.org/10.1787/53f23881-en.
[8] OECD (2023), PISA 2022 Results (Volume II): Learning During – and From – Disruption, PISA, OECD Publishing, Paris, https://doi.org/10.1787/a97db61c-en.
[5] OECD (2023), PISA 2025 Learning in the digital world framework (2nd draft), OECD Publishing, Paris.
[1] OECD (2023), PISA 2025 Science framework (Draft), OECD Publishing, Paris.
[14] OECD (2021), 21st-Century Readers: Developing Literacy Skills in a Digital World, PISA, OECD Publishing, Paris, https://doi.org/10.1787/a83d84cb-en.
[19] OECD (2021), The State of School Education: One Year into the COVID Pandemic, OECD Publishing, Paris, https://doi.org/10.1787/201dde84-en.
[2] OECD (2016), Low-Performing Students: Why They Fall Behind and How To Help Them Succeed, PISA, OECD Publishing, Paris, https://doi.org/10.1787/9789264250246-en.
[46] OECD (2015), The ABC of Gender Equality in Education: Aptitude, Behaviour, Confidence, PISA, OECD Publishing, Paris, https://doi.org/10.1787/9789264229945-en.
[40] OECD (2011), Against the Odds: Disadvantaged Students Who Succeed in School, PISA, OECD Publishing, Paris, https://doi.org/10.1787/9789264090873-en.
[35] Paino, M. and L. Renzulli (2012), “Digital Dimension of Cultural Capital”, Sociology of Education, Vol. 86/2, pp. 124-138, https://doi.org/10.1177/0038040712456556.
[26] Pfeffer, F. (2008), “Persistent Inequality in Educational Attainment and its Institutional Context”, European Sociological Review, Vol. 24/5, pp. 543-565, https://doi.org/10.1093/esr/jcn026.
[34] Richards, M. and M. Wadsworth (2004), “Long term effects of early adversity on cognitive function”, Archives of Disease in Childhood, Vol. 89/10, pp. 922-927, https://doi.org/10.1136/adc.2003.032490.
[18] Salmerón, L. et al. (2024), “Reading comprehension on handheld devices versus on paper: A narrative review and meta-analysis of the medium effect and its moderators.”, Journal of Educational Psychology, Vol. 116/2, pp. 153-172, https://doi.org/10.1037/edu0000830.
[11] Scherer, M. (ed.) (2016), The challenge of challenging text, ASCD, Alexandria VA.
[12] Snow, C. (2002), Reading for understanding: Toward an R&D program in reading comprehension, Rand Corporation.
[30] Spaull, N. (2017), “Who Makes It Into PISA?: Understanding the Impact of PISA Sample Eligibility Using Turkey as a Case Study (PISA 2003 - PISA 2012)”, OECD Education Working Papers, No. 154, OECD Publishing, Paris, https://doi.org/10.1787/41d175fc-en.
[28] Spaull, N. and S. Taylor (2015), “Access to What? Creating a Composite Measure of Educational Quantity and Educational Quality for 11 African Countries”, Comparative Education Review, Vol. 59/1, pp. 133-165, https://doi.org/10.1086/679295.
[50] Tarozzi, M. (2012), “Intercultural or multicultural education in Europe and the United States”, in Languages in a Global World: Learning for Better Cultural Understanding, OECD Publishing, Paris, https://doi.org/10.1787/9789264123557-28-en.
[43] Townsend, P. (1979), Poverty in the United Kingdom: a survey of household resources and standards of living., Univ of California Press.
[45] Van Bavel, J., C. Schwartz and A. Esteve (2018), “The Reversal of the Gender Gap in Education and Its Consequences for Family Life”, Annual Review of Sociology, Vol. 44/1, pp. 341-360, https://doi.org/10.1146/annurev-soc-073117-041215.
[51] Ward, M. (2020), “PISA for Development: Out-of-school assessment: Results in Focus”, PISA in Focus, No. 110, OECD Publishing, Paris, https://doi.org/10.1787/491fb74a-en.
[42] Whelan, C., R. Layte and B. Maître (2002), “Multiple deprivation and persistent poverty in the European Union”, Journal of European Social Policy, Vol. 12/2, pp. 91-105, https://doi.org/10.1177/0952872002012002101.
[39] Willms, J. (2006), Learning divides: Ten Policy Questions About the Performance and Equity of Schools and Schooling Systems, UNESCO Institute for Statistics, Montreal.
← 1. In PISA 2025, computational problem solving is a key component of the Learning in the Digital World (LDW) framework. LDW refers to students’ capacity to engage in iterative and self-regulated knowledge building and problem solving using computational tools and practices. Computational problem solving provides the operational basis for this process. It is through computational problem solving that students construct and refine executable digital artefacts — for example, models or algorithms — that allow them to explore problems, test solutions and build understanding in digital environments.
← 2. When comparing mean performance across countries/economies, only differences that are statistically significant should be considered (see Box 1 in Reader’s Guide)
← 3. The standard deviation summarises variation in performance among 15-year-old students within each country/economy. The average standard deviation in science performance within OECD countries is 99 score points. If the standard deviation is larger than 99 score points, it indicates that student performance varies more from a particular country’s/economy’s average performance than it varies internationally. A smaller standard deviation means that student performance varies less in a country/economy than it varies internationally
← 4. The self-regulation component of the PISA 2025 Learning in the Digital World assessment will be analysed in a separate report.
← 5. The explained variance is the R squared from a regression of computational problem-solving on science performance, gender and students' and schools' socio-economic profile. The variation uniquely associated with science performance is measured as the difference between the R squared of the full regression and the R squared of the same regression without science performance. A smaller proportion of the variation in student performance – around 14% – can be accounted for by student gender and student and school socio-economic profile (i.e. student background variables).
← 6. Relative performance is determined through a cubic polynomial regression. This regression analysis predicts a student's computational problem-solving score based on their science, mathematics or reading score using data pooled from all participating countries. The calculation produces a "residual" score. This is the difference between the student's actual computational problem-solving score and the predicted (expected) score generated by the model.
← 7. The same analysis was performed for reading and mathematics. The results are available, together with those for science, in Table I.B1.2a.20.
← 8. Cambodia, Guatemala and Paraguay participated for the first time in PISA in 2017 as part of the PISA for Development initiative. Therefore, the first reference year in the analysis of trends in these systems is 2017. The first reference year for Ecuador and El Salvador is 2022.
← 9. The Coverage Index 3 (CI3) in PISA is the weighted number of participating students divided by the total population of 15-year-olds. Low values of CI3 may reflect 15-year-olds who are not enrolled in school, who are enrolled below Grade 7, who dropped out during the school year, or who were excluded from the PISA assessment. For this reason, CI3 should be interpreted as a measure of PISA population coverage, rather than as a direct measure of inclusion in education.
When estimating the share of all 15-year-olds who have not reached baseline proficiency, the analysis assumes that 15-year-olds not covered by the assessed PISA sample would perform below Level 2. This assumption should be interpreted as a conservative sensitivity assumption, not as an observed result for excluded students. It is likely to be more plausible for 15-year-olds who are not enrolled, enrolled below Grade 7, or who have dropped out, than for students excluded from the assessment for other reasons. In countries where assessment exclusions account for a sizeable share of non-coverage, the resulting estimates should therefore be interpreted with caution.
← 10. The assumption that 15-year-olds not covered by the PISA sample would perform below Level 2 is supported by evidence from PISA for Development, which assessed 14- to 16-year-olds who were not in school or were enrolled below the PISA target grades. In the five countries that participated in the PISA for Development out-of-school assessment, only a very small share of these youth reached Level 2 in reading or mathematics. This suggests that, where non-coverage reflects non-enrolment, dropout or delayed progression below Grade 7, assuming that non‑covered 15-year-olds are below baseline proficiency is plausible (Ward, 2020[51]).
← 11. The slope of the socio-economic gradient indicates the degree of the disparity in average performance between two students whose socio-economic status differs by one unit in the PISA index of economic, social and cultural status. A positive value for the slope of the socio-economic gradient signals that advantaged students generally performed better than disadvantaged students in PISA 2025.