This chapter offers a concise overview of several key dimensions of student learning highlighted by the PISA 2025 results. Drawing on evidence from the 2025 assessment and questionnaires, it highlights three core elements for high-functioning education systems: the characteristics of competent learners, the importance of safe and fair learning environments, and the role of supportive families and schools. The chapter also examines students’ readiness to address environmental challenges.
PISA 2025 Results (Volume I)
Future-Ready Students

Abstract
Are young people prepared to thrive – and eventually lead – in an increasingly complex and interconnected world? As societies and labour markets change at an accelerating pace, it is important for students to develop knowledge, skills and attitudes that form the foundation for lifelong learning. Upskilling and reskilling have become indispensable to ensure that individuals are able to adapt to changing demands and thrive in their personal and professional lives over time. Much of learning will need to take place beyond formal education systems. As a result, learners are increasingly required to take ownership of what they learn, how and where they learn, and when learning occurs across their lives. In response, education systems need to consider ways to better foster engagement, learner agency and the development of effective learning strategies.
Learning is a dynamic process shaped by cognitive, emotional, social and physical dimensions, all of which interact continuously with the surrounding learning environment and context.1 Reflecting this complexity, PISA examines student learning from multiple perspectives, with competent learners characterised across several dimensions including academic performance, curiosity, perseverance and self-regulation. As illustrated in Figure I.1.1, the PISA framework for competent learners situates learners within their contexts and relationships, recognising how environments, conditions and experiences are intertwined with learning. Safe and fair learning environments comprise students’ sense of belonging and a positive school climate where students feel safe and which is associated with more student engagement and higher proficiency. Supportive families and schools are equally as important in regard to students’ development of competencies needed to succeed in school and beyond, and involve support from parents/guardians, family members and teachers, as well as sufficient teaching resources and staff in schools.
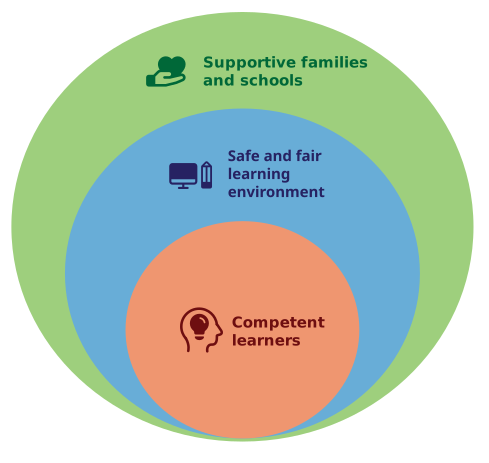
Figure I.1.22 below uses PISA 2025’s multidimensional approach to extract several key characteristics of competent learners, safe and fair learning environments, and supportive families and schools. Competent learners are defined here by the combination of two key dimensions: student proficiency and engagement in learning.
An interactive version of Figure I.1.2 is available in the PISA Dashboard, where users can select a country or economy of interest and generate visualisations of multidimensional student learning.
When interpreting PISA results, it is important to consider that differences in results should be examined in light of various contexts such as socio-economic status, cultural and language backgrounds, and institutional characteristics. Moreover, PISA reflects the cumulative learning experiences of students up to age 15, rather than outcomes attributable to a single point in time or specific policy.
OECD average and top three education systems
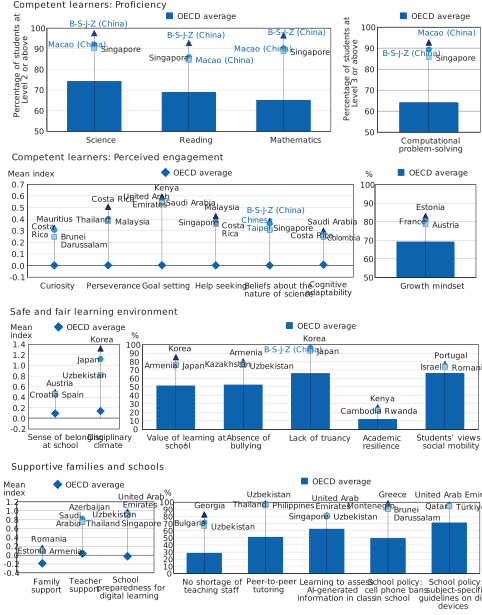
1. The value of learning at school is measured by the percentage of students who disagree or strongly disagree that "School has done little to prepare me for adult life when I leave school".
Source: OECD, PISA 2025 Database, Tables I.B1.1.3, I.B1.2a.10, I.B1.2a.11, I.B1.2a.12, I.B1.2a.13, I.B1.2b.2, I.B1.3.1, I.B1.3.9, I.B1.3.16, I.B1.3.30, I.B1.3.40, I.B1.3.44, I.B1.3.49, I.B1.3.62, I.B1.3.70, I.B1.4.14, I.B1.4.47, I.B1.4.68, I.B1.4.71, I.B1.4.101, I.B1.4.113, I.B1.4.120, I.B1.4.132, I.B1.4.138 and I.B1.4.158. See https://stat.link/3r8tyd for the underlying data.
Proficient and/or engaged learners
Competent learners are those who not only understand what they have learned, but can also use that knowledge and skills effectively, apply it with confidence in real‑world situations, and continue to apply it throughout their lives, beyond formal education settings. This also requires a willingness to learn, supported by curiosity and perseverance. As a working definition, competent learners can be understood in terms of two key dimensions: proficiency and engagement.
Across multiple indicators of the proficiency dimension on science, reading, mathematics and computational problem-solving,3 a consistent group of education systems emerges as the top-performing systems across different domains (Figure I.1.2, first panel). Details of student proficiency in these domains are discussed in Chapter 2.
Results of students’ self-reported engagement indicators are more varied, with different systems leading different measures. While student engagement is discussed in detail in Chapter 3, an overview is provided in Figure I.1.2 (second panel):
The first two indicators are related to students’ motivation to learn: curiosity and perseverance.
The next two concern self-regulated learning, especially focusing on goal setting and help seeking.
The last three are learning-related beliefs and behaviours, including growth mindset, beliefs about the nature of science and cognitive adaptability.
Comparing the first and the second panels, systems leading the proficiency dimension only partially overlap with those leading the engagement dimension. This contrast suggests that strong academic performance does not necessarily lead to high levels of student perceived engagement, and the reverse is also true, underscoring the need for policies that address learning outcomes as multidimensional.
When comparing student self-reports across countries and economies, it is important to note that results may be influenced by differences in student response styles and cultural norms. Therefore, caution is needed when interpreting cross-national comparisons, as the data reflect students’ perceptions rather than objective measures. Nonetheless, presenting these results remains valuable, as they provide meaningful insights into how young people perceive and report their own engagement, offering an important perspective on students’ experiences.
Systems’ economic and social conditions
The economic and social conditions of different countries/economies, which are often beyond the control of education policymakers and educators, can influence student performance. For example, the relative prosperity of some countries allows them to spend more on education while other countries find themselves constrained by a lower national income. It is therefore important to keep the national wealth of countries in mind when interpreting the performance of education systems across countries and economies. In a simple bivariate relationship, 50% of the variation in countries’/economies’ average scores is related to per-capita GDP (9% in OECD countries). Countries with higher national incomes tend to score higher in PISA assessments. However, the relationship is not linear and it flattens among those with relatively higher national incomes (Tables I.B1.2a.1 and I.B3.2.1).
While per-capita GDP reflects the potential resources available for education in each country, it does not directly measure the financial resources actually invested in education. Figure I.1.3 compares countries’ cumulative spending per student from the age of 6 up to 15, after accounting for purchasing power parity, (hereafter, “spending per student”) with average student performance in science. Education systems with higher spending per student tend to achieve higher scores in science, but only up to a point. Above approximately USD 85 000 per student, the two begin to decouple. This shows that education needs to be adequately resourced and is often under-resourced in developing countries. At the same time, beyond a certain threshold of spending, higher spending per student does not automatically relate to higher performance scores. Increased spending needs to be accompanied by the effective allocation and use of financial resources if it is to translate into improvement in education.4
Unlike the proficiency dimension, student engagement shows no clear association with education spending. Across education systems, there is no consistent relationship between spending and students’ self‑reported curiosity (see online Figure I.1.o1). While a negative relationship is observed between spending and students’ self‑reported perseverance, this association is weak (see online Figure I.1.o2). These findings suggest that greater investment does not automatically guarantee stronger engagement, as perceived by students, and strong perceived engagement can exist even with lower levels of spending.5

Note: Only countries and economies with available data are shown. Please refer to the Reader’s Guide for countries’ and economies’ ISO codes.
Source: OECD, PISA 2025 Database, Tables I.B1.2a.1 and I.B3.2.2. See https://stat.link/3r8tyd for the underlying data.
Global talent pool of future science innovators
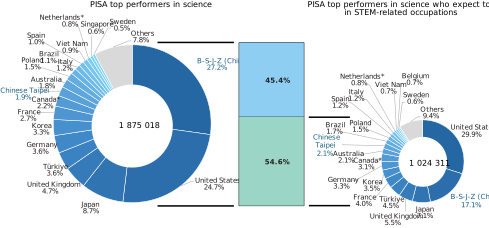
Among the many possible ways to measure the global talent pool of future contributors to scientific innovation, Figure I.1.4 presents one scenario based on students’ proficiency in science and their willingness to contribute to STEM (science, technology, engineering and mathematics) occupations in the future. A strong foundation in scientific proficiency enables students to understand complex problems, think critically and develop effective solutions. At the same time, motivation and readiness to engage in STEM fields drive students to apply their knowledge in real-world contexts, collaborate with others and pursue innovation. Together, these aspects foster the knowledge, skills and attitudes needed to achieve scientific advancements and address global challenges.
The left panel of Figure I.1.4 below presents the estimated number of top performers in science, i.e. those who are proficient at Level 5 or 6. Around 1.9 million students are considered top performers in science across the 91 countries and economies that participated in PISA 2025. The figure also shows how much each country and economy contribute to the global talent pool.
The size of countries and economies should be considered when looking at countries/economies’ contributions to the global pool of top-performing students. For example, even though the proportion of top performers in science is comparatively small in the United States*, because of its population size and the overall number of 15-year-old students that the PISA sample represents, this country represents one-fourth of the total top performers shown in the left panel of Figure I.1.4. In contrast, Singapore, which has one of the largest shares of 15-year-olds performing at Level 5 or 6 on the PISA science scale, contributes less than 1% to the global pool of top-performing students because its population is relatively small.
The right panel of Figure I.1.4 excludes, from the global pool of top performers, students who reported that they do not expect to work in STEM-related occupations at age 30, leaving 1.02 million students in the global talent pool of future science innovators. In other words, 55% of top performers in science expect to engage in STEM-related occupations.
The proportion of top performers who expect to engage in STEM-related occupations varies across countries and economies. Therefore, the proportions of individual countries/economies’ contributions to the talent pool differ between two panels. On the right panel, the United States* contributes by 30%, B-S-J-Z (China) by 17%, Japan by 7%, the United Kingdom by 5%, and Türkiye and France by 4%.
The estimated total number of top performers in science who expect to engage in STEM-related occupations, and individual countries/economies’ contributions to the global talent pool
Note: These figures cover all 91 countries and economies that participated in PISA 2025 in order to present the broadest possible global picture. However, some of these participants did not meet one or more PISA sampling standards (see the Reader’s Guide for details), and their results should therefore be interpreted with caution.
Source: OECD, PISA 2025 Database. See https://stat.link/3r8tyd for the underlying data.
Trends over time
The average trend across OECD countries is negative (Figure I.1.5). Performance in PISA 2025 was the lowest in all subjects, significantly below the mean performance observed in any earlier assessment (except PISA 2022, in science). In mathematics, performance remained close to the 2003 level through all assessments up to 2018, then dropped sharply between 2018 and 2025. In reading and science, the strongest performance was observed in 2012 and 2009, respectively, then the trajectory turned negative. See Chapter 2 for further details about PISA trends over time.
OECD average-23
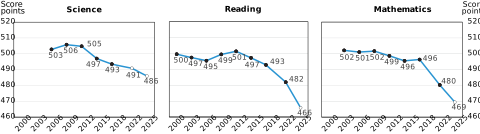
Note: White dots indicate mean-performance estimates that are not statistically significantly above/below PISA 2025 estimates.
Source: OECD, PISA 2025 Database, Tables I.B1.2a.36, I.B1.2a.37 and I.B1.2a.38. See https://stat.link/3r8tyd for the underlying data.
OECD average-23
Note: White dots indicate mean-performance estimates that are not statistically significantly above/below PISA 2025 estimates.
Source: OECD, PISA 2025 Database, Tables I.B1.2a.39, I.B1.2a.40 and I.B1.2a.41. See https://stat.link/3r8tyd for the underlying data.
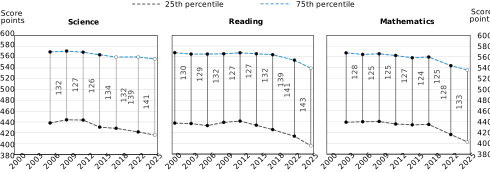
The magnitude of performance declines varies across achievement levels. As shown in Figure I.1.6, students at the lower end of the performance scale (the 25th percentile) experience steeper declines than those at the higher end (the 75th percentile). Over the last 10 years, between 2015 and 2025, low-achievers’ scores declined by 15 points in science, 38 points in reading and 32 points in mathematics. In contrast, over the same period, high-achievers’ scores declined by 8 points in science, 27 points in reading and 23 points in mathematics. Box I.2.2 in Chapter 2 provides context for interpreting changes in PISA scores, showing that average yearly learning gains are equivalent to roughly 20 score points in any subject. However, learning gains vary widely across systems due to differences in schooling, resources and education quality, and they also change over time; so a snapshot at age 15 may not reflect gains over subsequent years. Furthermore, average performance gains may not reflect those at the higher or lower ends of the performance distribution.
Trends in perceived engagement
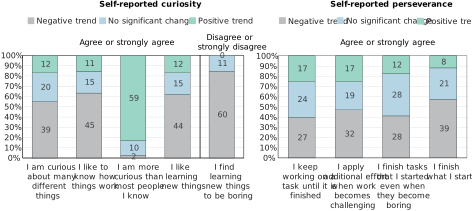
Some engagement items measuring curiosity and perseverance were implemented both in PISA 2022 and 2025.6 Figure I.1.7 presents the number of countries and economies that recorded positive, negative or no significant changes between 2022 and 2025 for each item measuring self-reported curiosity and perseverance. With one exception, the results show negative trends, indicating reduced self-reported curiosity and perseverance in most education systems in 2025. The exception is a rise in the proportion of students in 2025 who report being more curious than most people they know in 59 countries and economies.
Number of countries and economies with positive, negative or no significant change in students’ reported engagement between 2022 and 2025
Source: OECD, PISA 2025 Database, Tables I.B1.3.2 and I.B1.3.10. See https://stat.link/3r8tyd for the underlying data.
Proficiency and perceived engagement
Relationships in PISA 2025
Student proficiency and engagement are closely interrelated, as examined in Chapter 3. Although they often influence one another in shaping learning outcomes, this section treats them as analytically distinct in order to enable clearer examination of systems’ strengths and the challenges they face.7
Figure I.1.8 shows where individual education systems stand in light of learner proficiency and engagement. While proficient and engaged learners could be defined in many different ways, this figure provides an example focusing on certain aspects. Proficient learners are defined based on students’ performance in science, reading, mathematics and computational problem-solving.8 Engaged learners are defined based on curiosity, perseverance, goal setting and help seeking.9 Competent learners are those who meet the criteria for both proficient and engaged learners.

Note: Only countries and economies with available data are shown.
Countries and economies are ranked in descending order of the percentage of competent learners, who are both proficient and engaged.
Source: OECD, PISA 2025 Database, Tables I.B1.1.1 and I.B1.1.2. See https://stat.link/3r8tyd for the underlying data.
When these two perspectives are combined, on average across OECD countries, 14% of students both report the set of engagement-oriented attitudes and perform above certain proficiency levels (Figure I.1.8). Even among the countries and economies where over two-thirds of students are proficient, only in Singapore and B-S-J-Z (China) do more than one-quarter also report this broader engagement profile (28% and 33%, respectively). Conversely, among the countries and economies where fewer than 10% of students are proficient across all PISA domains, Kenya, Kosovo and Morocco still show over one-third of students with this engaged but non-proficient profile, ranging from 35% to 38%.
These contrasts suggest that proficiency and engagement overlap but do not align with each other completely. Stronger academic performance does not automatically imply stronger motivational engagement, just as positive attitudes towards learning do not always coincide with equally strong academic results.
Distinct patterns in proficiency and engagement are also evident when individual education systems are plotted across the two measures, as shown in Figure I.1.9. Education systems with below-average proficiency compared to the OECD average tend to report higher levels of student engagement (i.e. those located in the bottom-right quadrant). By contrast, among systems with around-average or above-average proficiency, the share of engaged learners varies. It is below average in some systems (top-left quadrant) and above average in others (top-right quadrant).
For education systems, these distinct patterns in proficiency and engagement matter because they indicate that engagement in learning should not be viewed simply as a by-product of academic success, nor should academic performance be used as a proxy for students’ broader engagement with learning. Each outcome warrants attention in its own right. The challenge for schools, therefore, is to create conditions that enable more students to develop both the competencies and the orientations that support learning over time.

Note: Only countries and economies with available data are shown. Please refer to the Reader’s Guide for countries’ and economies’ ISO codes.
Source: OECD, PISA 2025 Database, Table I.B1.1.1. See https://stat.link/3r8tyd for the underlying data.
Relationships between trends
Trends in student proficiency and engagement are closely interrelated. Countries and economies that show more negative trends in performance also tend to show more negative trends in engagement.
For example, in a majority of countries and economies, fewer students in 2025 agreed or strongly agreed that they are curious about many different things than in 2022, as shown in Figure I.1.7. Those with more negative declines in curiosity between 2022 and 2025 tend to show steeper performance declines in reading, as shown in Figure I.1.10. Conversely, systems showing positive (or less negative) performance trends in reading between 2022 and 2025 tend to show positive (or less negative) trends in self-reported curiosity during the same period.
Trends in students’ views on the usefulness of school are also closely related to performance trends. In over half of countries and economies with available data, less students in 2025 reported that school has been a waste of time than in 2022 (Table I.B1.3.71). Between 2022 and 2025, countries and economies with a steeper increase in students’ views on the usefulness of school are also those showing a steeper increase in reading performance (Figure I.1.10).
While Box I.2.3 in Chapter 2 provides a detailed discussion on potential drivers for the declines in reading performance, it is important to highlight here that not only performance, but also other key outcomes are declining simultaneously in many systems. This makes it even more important to consider students’ learning from a multidimensional perspective, rather than isolating performance from other key outcomes.

Note: Only countries and economies with available data are used.
Source: OECD, PISA 2025 Database, Tables I.B1.2a.37, I.B1.3.2 and I.B1.3.71. See https://stat.link/3r8tyd for the underlying data.
Student proficiency and engagement are developed within specific contexts of safe and fair learning. The third panel of Figure I.1.2 illustrate these contexts.
The third panel of Figure I.1.2 considers:
Students’ sense of belonging at school and their views on the value of schooling. These are discussed in Chapter 3.
How the school environment is conducive to learning, which includes disciplinary climate, the absence of bullying and low levels of truancy. These are discussed in the latter half of Chapter 4.
The fairness of the learning environment, where students’ socio-economic background does not determine their future. More specifically, academic resilience and students’ views on social mobility. The former is discussed in Chapter 2 and the latter is discussed in Box I.1.1.
Students’ sense of belonging at school, their views on the value of schooling, school disciplinary climate, the absence of bullying, and low levels of truancy all show positive relationships with most of the outcomes included in the first and second panels of Figure I.1.2. For example, students’ sense of belonging at school is positively related to performance in science, curiosity, perseverance, goal setting, help seeking and three other indicators included in the second panel (see Table I.3.1 in Chapter 3). Similarly, disciplinary climate is positively associated with performance in science, curiosity, perseverance, goal setting and help seeking (see Table I.4.1 in Chapter 4). These results should be interpreted with caution as they do not, on their own, establish causal relationships.
Academic resilience reflects fairness in education systems. Academically resilient students are those from disadvantaged socio‑economic backgrounds who nevertheless perform among the top students in science in their country or economy. Students who perceive higher levels of social mobility are more likely to be academically resilient (Box I.1.1).
The fourth panel of Figure I.1.2 consists of two groups of indicators. The first group covers the following four indicators which are related to various key outcomes as shown in Table I.4.1 in Chapter 4:
Parents’ or guardians’ interest in students’ day-to-day learning and school experience is measured by family support.
Adequate and supportive teachers and peer-to-peer support are measured by teacher support, no shortage of teaching staff, and peer-to-peer tutoring.
The second group consists of digitalisation-related indicators discussed in detail in Chapter 4:
School capacity to enhance teaching and learning using digital resources is measured by school preparedness for digital learning, as principals in higher-performing systems tend to report they are prepared on this front.
School-level digital policies such as cell phone bans in school and subject-specific guidelines for the use of digital devices are shown, as these policies are related to distraction in class.
AI-related learning opportunities at school, such as how often students undertake a task to assess AI‑generated information in school lessons is shown, as students who frequently have access to such learning opportunities and use AI for learning tend to achieve higher scores.
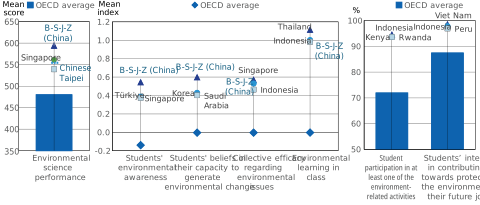
Figure I.1.11 provides an overview of the key indicators discussed in Chapter 5. The first three are key components of environmental agency and the last one regards learning opportunities in school:
Environmental knowledge and skills are measured by student performance in environmental science.
Students’ attitudes towards the environment cover students' environmental awareness, their beliefs in their own capacity to generate environmental change, and their beliefs in collective efficacy regarding environmental issues.
Students’ commitment to protecting the environment includes student involvement in at least one of the environment-related activities included in the questionnaire and their interest in contributing towards protecting the environment in their future career.
Students’ learning opportunities at school regarding environmental challenges are measured by opportunities for environmental learning in class.
Performance, attitudes and commitment are interrelated and go hand-in-hand. Furthermore, students who reported more frequent opportunities for learning how to address environmental challenges in class tend to have higher levels of performance, more positive attitudes and greater commitment. Despite the positive relationship between performance, attitudes and commitment, there is some proportion of students who care for the environment, but do not commit to protecting the environment. These students tend to have less frequent opportunities for environmental learning in class.
Source: OECD, PISA 2025 Database, Tables I.B1.5.1, I.B1.5.6, I.B1.5.11, I.B1.5.18, I.B1.5.33, I.B1.5.41 and I.B1.5.54. See https://stat.link/3r8tyd for the underlying data.
Social mobility is essential to ensuring that all students can fulfil their potential. To capture students’ beliefs about social mobility, PISA 2025 introduced a new item asking students whether they agreed with the statement: “Your status in society is something that you can’t really change very much.” Agreement with this statement reflects lower perception of social mobility, while disagreement indicates stronger beliefs in opportunities for social mobility.
Who perceives greater opportunities for social mobility?
On average across OECD countries, two out of three students disagreed or strongly disagreed that social status in society is something that cannot really change very much (Table I.B1.1.3). This varies across countries and economies, from less than 40% in Thailand, the Philippines and Indonesia, to around 75% or more in Portugal and Israel. Perhaps reassuringly, students perceive greater social mobility as the real social mobility in their societies increases, measured by the Global Social Mobility Index (World Economic Forum, 2020[1]), (see online Figure I.1.o3). However, students in some countries and economies, such as Indonesia, the Philippines, Thailand and Malaysia, appear to be particularly pessimistic when their perceived social mobility is compared against the observed mobility in their societies. On the other hand, students in Portugal, Israel, Romania, Georgia and Armenia perceive their societies to be more fluid than what would be expected according to the Global Social Mobility Index.
Socio-economically disadvantaged students are less likely than advantaged students to believe in the availability of opportunities for social mobility, on average and in a majority of countries and economies (Table I.B1.1.4). On average across OECD countries, this amounts to a 12 percentage-point difference. The gap is smallest in the Palestinian Authority and Malaysia (less than a 5 percentage-point difference), and greatest in Romania, Mauritius, Brunei Darussalam and Hong Kong (China) (at least an 18 percentage-point difference).
The share of boys and girls who believe in a more fluid social structure is similar across OECD countries and in nearly half of countries and economies (Table I.1.4). In other systems, the gender gap varies, with a greater share of boys reporting such beliefs in some education systems and girls in others.
How social mobility, growth mindset and academic resilience are interrelated
PISA 2025 findings show that students who perceive greater opportunities for social mobility are more likely to endorse a growth mindset, which in turn is associated with a higher likelihood of academic resilience. Academically resilient students also tend to perceive stronger prospects for social mobility (Figure I.1.12). Although these associations do not establish causal relationships, they suggest a mutually reinforcing set of beliefs and outcomes. From a policy perspective, this pattern underscores the potential value of education policies that strengthen students’ perceptions of social mobility – such as promoting fairness, transparency and opportunity within education systems – alongside interventions that foster growth mindset.
Social mobility and growth mindset. Students reporting a growth mindset are three times more likely to perceive opportunities for social mobility than students reporting a fixed mindset, on average across OECD countries and across all countries and economies (Table I.B1.1.5). This result remains unchanged even after accounting for students and schools’ socio-economic profile. This gap in likelihood exceeds five times in the Philippines and Dushanbe (Tajikistan).1
Growth mindset and academic resilience. Across OECD countries and in nearly all countries and economies, the majority of students who are academically resilient also report a growth mindset (Table I.B1.1.6). On average, nearly four out of five students who are academically resilient hold a growth mindset. Conversely, among students who are from disadvantaged socio-economic backgrounds and not among the top performers, around three out of five students report a growth mindset.
Academic resilience and social mobility. The majority of students who are academically resilient hold beliefs in opportunities for social mobility, on average and in nearly all countries and economies (Table I.B1.1.3). Across OECD countries, more than seven out of ten students who are academically resilient also perceive opportunities in social mobility. Among students who are from disadvantaged socio-economic backgrounds and not among the top performers, less than six out of ten students perceive opportunities in social mobility.

1. This positive relationship is observed at the system level as well. Countries and economies with more students reporting growth mindset tend to be the ones where more students believe in social mobility (r = 0.84) (Tables I.1.3 and I.B1.3.17).
References
[2] Rychen, D. and L. Salganik (eds.) (2003), Key Competencies for a Successful Life and a Well-functioning Society, Hogrefe & Huber.
[1] World Economic Forum (2020), The Global Social Mobility Report 2020, World Economic Forum, Cologny/Geneva, https://www3.weforum.org/docs/Global_Social_Mobility_Report.pdf.
← 1. The OECD Definition and Selection of Competencies (DeSeCo) framework defines competency as a multifaceted concept that brings together cognitive, socio-emotional and practical resources. These elements are combined and applied in context to respond effectively to complex demands (Rychen and Salganik, 2003[2]).
← 2. Definitions: Values that are not reported as percentages correspond to mean values of the corresponding questionnaire indices. Percentages are defined as follows: Percentage of students scoring above a baseline level of proficiency: students scoring at or above Level 2 in science, reading and mathematics; at or above Level 3 in computational problem solving; Growth mindset: Percentage of students who disagree or strongly disagree with the statement “You have a certain amount of intelligence, and you really can’t do much to change it”; Value of learning at school: Percentage of students who disagree or strongly disagree that “School has done little to prepare me for adult life when I leave school”; Absence of bullying: Percentage of students who reported never or almost never being victim of any type of bullying act (among a list of five different types of acts); Lack of truancy: Percentage of students who did not report that in the two weeks prior to the PISA test they had skipped at least one class or day of school; Academic resilience in science: Percentage of students from the bottom quarter of socio-economic status (disadvantaged students) who scored in the top quarter of performance amongst students in their own country/economy; Beliefs in social mobility: Percentage of students who disagree or strongly disagree with the statement “Your status in society is something that you can’t really change very much”; No shortage of teaching staff: Percentage of students in schools whose principal reported that the school’s capacity to provide instruction is not at all hindered by a lack of teaching staff; Peer-to-peer tutoring: Percentage of students in schools whose principal reported that peer-to-peer tutoring is provided; Learning to assess AI-generated content in class: Percentage of students who reported that, in their school lessons, they assess the quality of information generated by Artificial Intelligence chatbots (e.g. ChatGPT) sometimes, often or very often; School policy: cell phone bans in school: Percentage of students in schools whose principal reported that the use of cell phones is not allowed on the school premises; School policy: subject-specific guidelines on digital devices: Percentage of students in schools whose principal reported that the school has formal guidelines for the use of digital devices for teaching and learning in specific subjects.
← 3. Computational problem solving was measured as a part of the PISA 2025 innovative domain, “learning in the digital world.”
← 4. Several cautions should be kept in mind when interpreting this figure. First, total expenditure on education across all types of institutions is measured as the sum of direct spending by both public and private institutions over the grades and education levels in which 6- to 15-year-olds are typically enrolled. However, it does not include costs borne by families outside formal schooling, such as private tutoring or cram schools. Second, the cross-sectional relationship should not be interpreted as causal. The figure does not preclude the possibility that increased spending in countries already above the USD 85 000 per student threshold may be associated with improved performance, particularly when the additional resources are used effectively. Third, science performance represents only one of many education outcomes. While it is used here as a key proxy, it may not fully reflect all important dimensions of educational outcomes.
← 5. The results need to be interpreted with caution, as students’ responses may be influenced by differences in student response styles and cultural norms. Furthermore, the first and second cautions described in Note 2 are also relevant in this context.
← 6. The indices of curiosity and perseverance are not comparable between PISA 2022 and PISA 2025. In 2022, a broader set of items was used to measure these constructs, whereas fewer items were included in 2025.
← 7. This distinction is not intended to imply that they are mutually exclusive, oppositional or dichotomous, but rather to support a more nuanced understanding of how each contributes to the broader learning process. Furthermore, this section adopts a simplified approach to capturing overall engagement in order to examine its association with academic performance. However, it is important to recognise that engagement is inherently multi-faceted. These dimensions may vary in combination across students, with strengths in some areas potentially compensating for weaknesses in others, suggesting multiple pathways to becoming a competent learner.
← 8. Proficient learners are operationally defined in this section as students who are at proficiency Level 2 or above in science, reading and mathematics as well as at proficiency Level 3 or above in computational problem solving.
← 9. Engaged learners are operationally defined in this section as students who agreed or strongly agreed with the following three statements: “I like learning new things” (curiosity); “I apply additional effort when work becomes challenging” (perseverance); and “I ask for help when I have trouble learning” (help seeking); as well as reported to do the following often or very often: “I change my approach to studying if it is not successful” (goal setting).