Japan
Japan’s contribution to data for development
Japan has been providing support to strengthen statistical capacities and systems in developing countries for many years. Support focuses on national statistical systems and is offered through technical assistance and funding for equipment, in particular with the aim of contributing to improve statistical production and the statistical literacy of data users and to strengthen data dissemination.
Japan offers its support through bilateral and multilateral channels. Bilateral assistance is offered by the Statistics Bureau of Japan and Japan International Cooperation Agency (JICA), which provide capacity building to developing countries’ national statistical offices to help them carry out population and economic censuses, other surveys, and statistical studies. Japan’s Statistics Bureau has been providing expertise in particular to the national statistical offices of Cambodia, Egypt, Indonesia and Nepal. Japan has also made both cash and in-kind contributions to the United Nations Statistical Institute for Asia and the Pacific, which has implemented training and other activities to build the capacities of 16 139 participants from national statistical offices of 137 developing countries/regions since 1970.
According to the 2017 Partner Report on Support to Statistics (PRESS) dataset, Japan committed on average USD 4.3 million per year to finance national statistical capacities and systems in developing countries in 2013-15.
Financial flows from Japan to developing countries
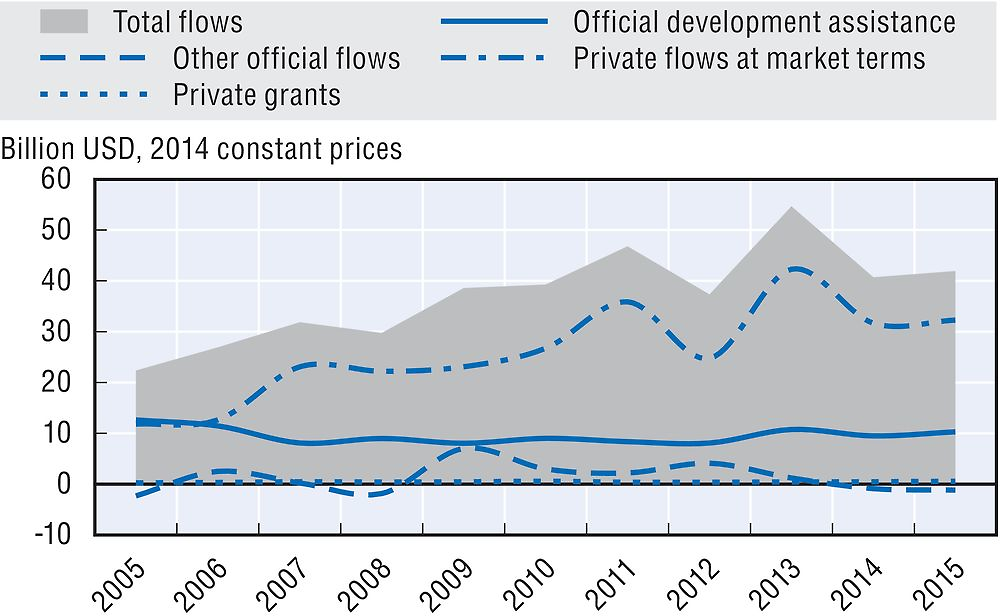
Japan’s use of ODA to mobilise other resources for sustainable development
-
USD 2.9 million of official development assistance (ODA) was committed to the mobilisation of domestic resources in developing countries, e.g. to support the development of their tax systems, in 2015.
-
USD 11.8 billion of ODA (+37.6% in real terms from 2014) was committed to promote aid for trade and improve developing countries’ trade performance and integration into the world economy in 2015.
Japan’s performance against commitments for effective development co-operation
Japan’s official development assistance
In 2016, Japan provided USD 10.4 billion in net ODA (preliminary data). This represented 0.20% of gross national income (GNI) and a 0.9% increase in real terms from 2015 due to a slight increase in its bilateral ODA. In 2015, the untied share of Japanese total bilateral ODA, excluding technical co-operation, was 82.3%, a decrease of 7.3 percentage points from 2014. Japan’s ODA includes a large technical co-operation programme, but Japan does not report its tying status. The share of total Japanese bilateral aid reported as untied was 74.6% in 2015.1 The grant element of total ODA was 87.5% in 2015.
Japan did not report in-donor refugee costs as ODA in 2016.
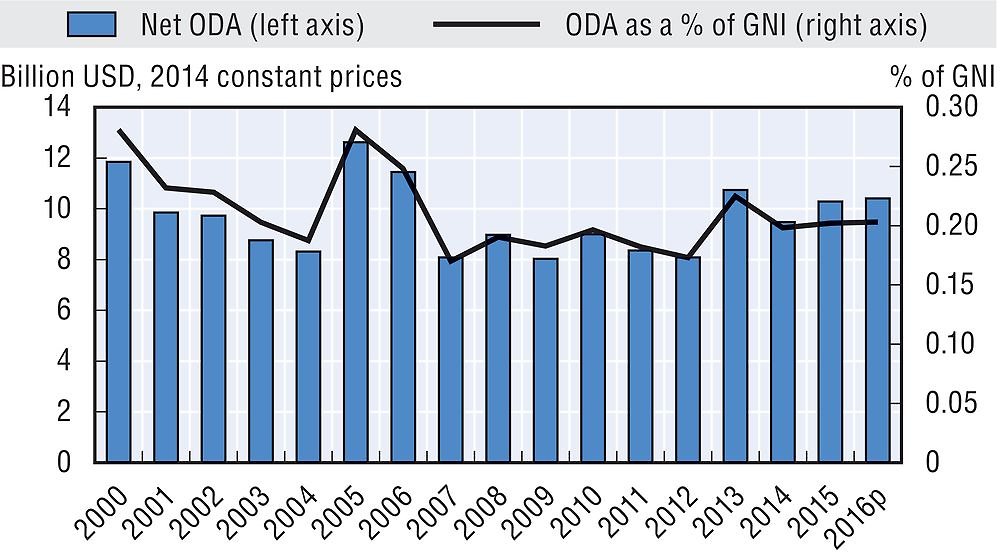
p: Preliminary data.
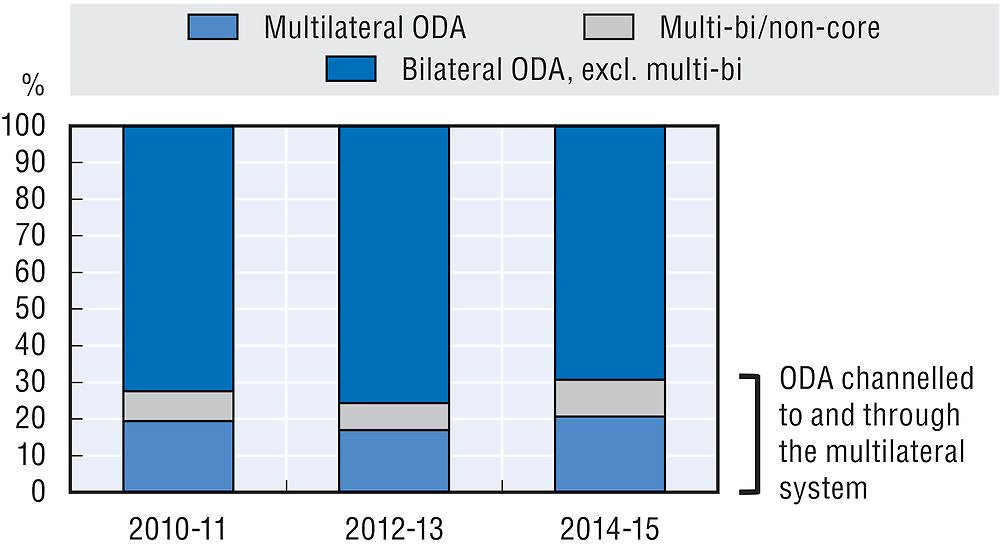
In 2015, 79.7% of ODA was provided bilaterally. Japan allocated 20.3% of total ODA as core contributions to multilateral organisations, compared with the DAC country average of 26.2%. In addition, it channelled 13.9% of its bilateral ODA for specific projects implemented by multilateral organisations (multi-bi/non-core contributions).
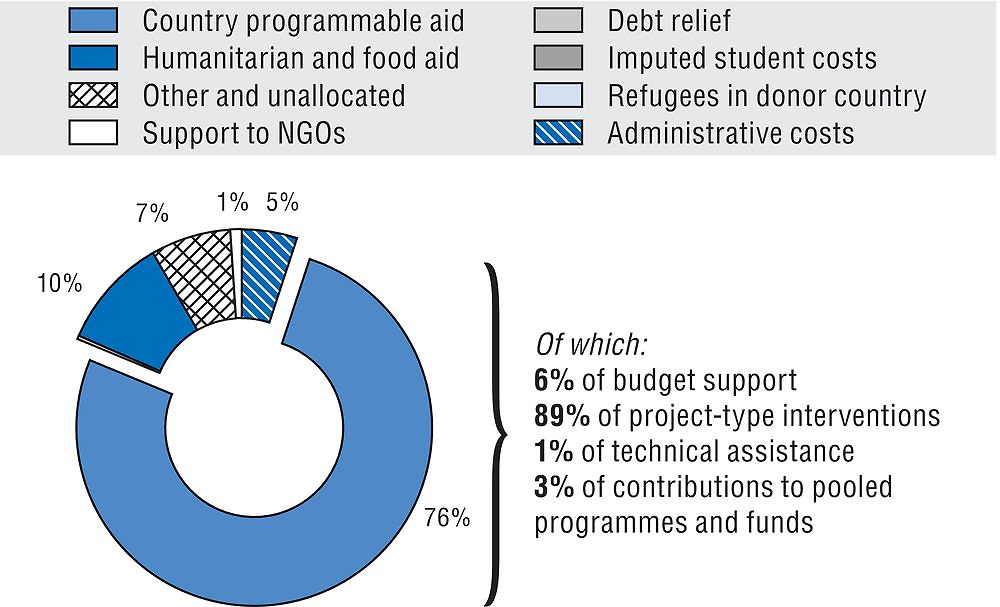
In 2015, Japan programmed 76.2% of bilateral ODA with partner countries. Japan’s share of country programmable aid was above the DAC country average of 48.8% in 2015. Project-type interventions totalled 89.4% of this aid.
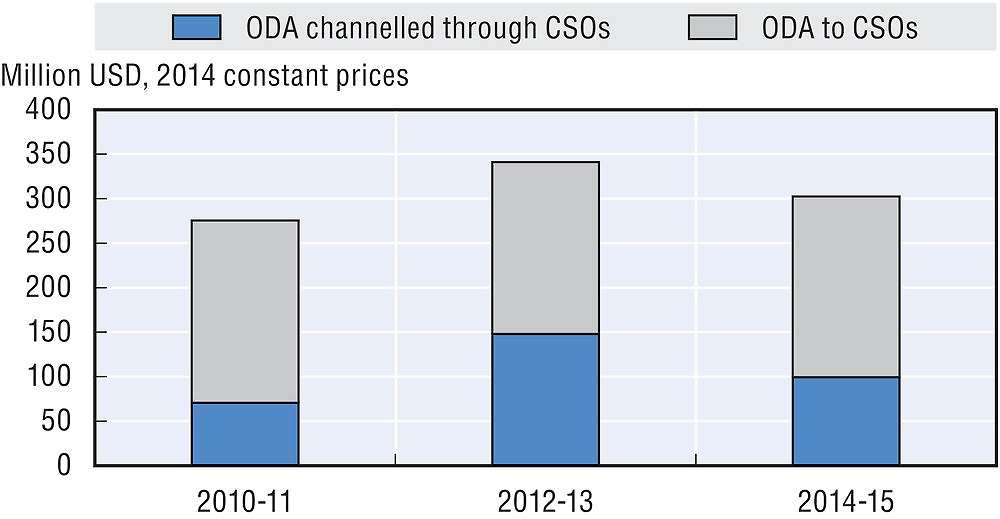
In 2015, USD 280.3 million of bilateral ODA was channelled to and through civil society organisations (CSOs). Between 2014 and 2015 Japan’s aid channelled to and through CSOs increased in terms of volume (+7.5%) and remained stable as a share of bilateral ODA (2.3% in 2014 and 2015). The DAC country average for aid to and through CSOs was 16.9% in 2015.
Bilateral ODA was heavily focused on Asia. In 2015, USD 3.4 billion was allocated to south and central Asia and USD 3.2 billion to Far East Asia. USD 1.5 billion was allocated to sub-Saharan Africa.
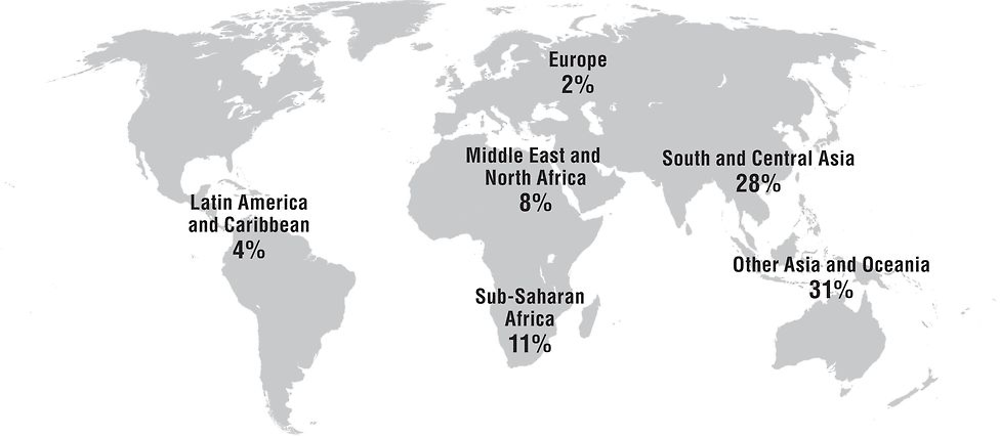
Note: 15% of bilateral ODA allocated was unspecified by region in 2014-15. This share is not represented on the map.
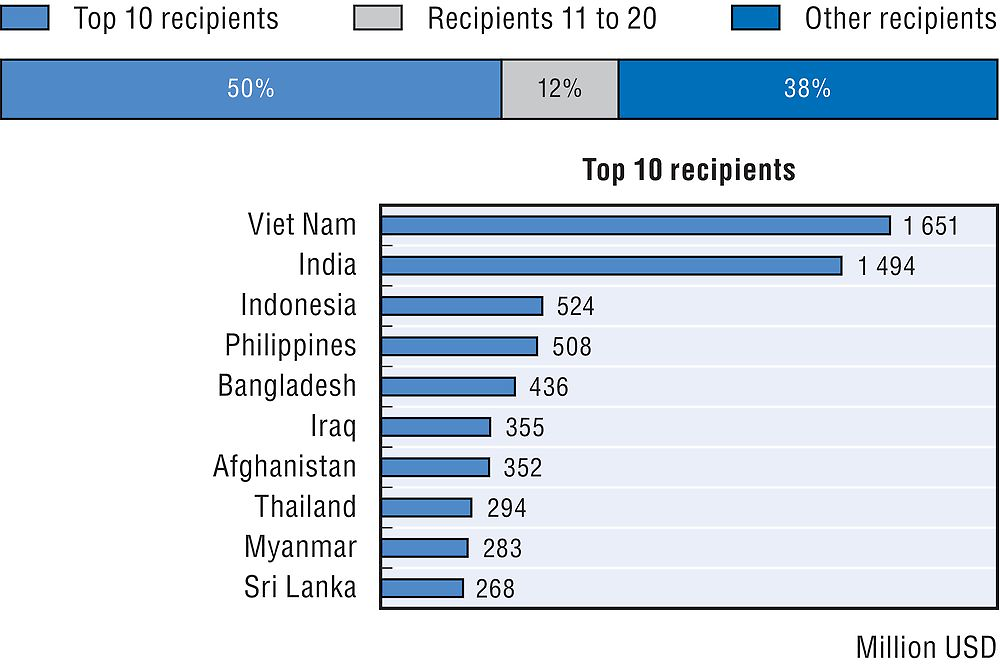
In 2015, 49.5% of bilateral ODA went to Japan’s top 10 recipients. In line with its stated use of ODA as a diplomatic tool, Japan has a bilateral programme in over 140 countries. In 2011-12, 37% of Japanese bilateral ODA went to 5 recipient countries and 66% to the top 20 recipients. Japan’s support to fragile contexts reached USD 3.6 billion in 2015 (29.7% of gross bilateral ODA).
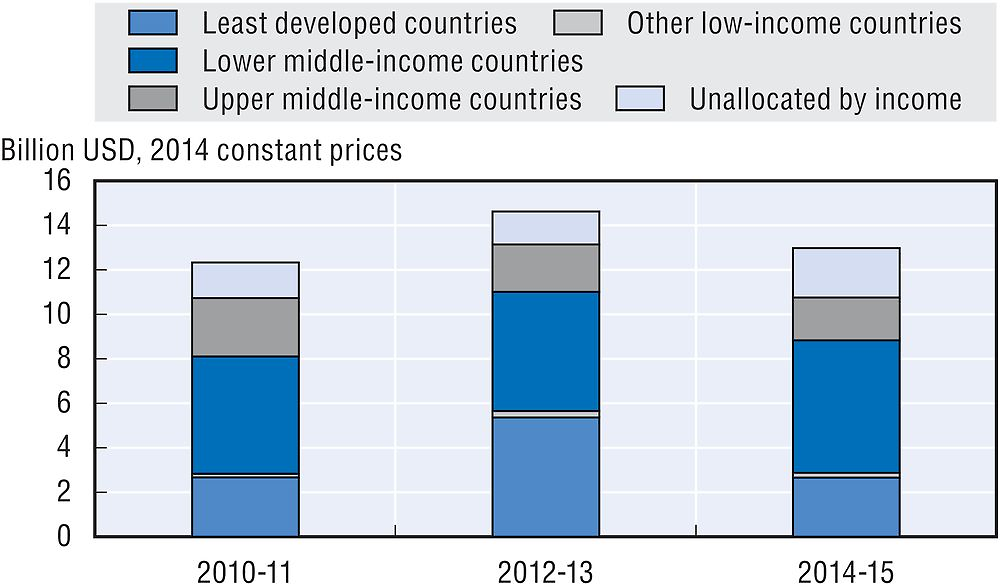
In 2015, 21.6% of bilateral ODA was provided to least developed countries (LDCs), amounting to USD 2.6 billion. This is an increase from 2014 (19.2%), but remains lower than the 2015 DAC country average of 24.3%. Lower middle-income countries received the highest share of bilateral ODA in 2015 (44.8%).
At 0.08% of GNI in 2015, total ODA to LDCs was lower than the UN target of 0.15% of GNI.
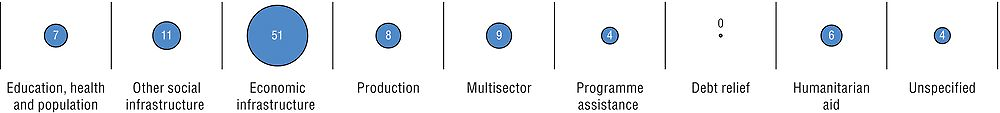
In 2015, 52.9% of bilateral ODA was allocated to economic infrastructure and services, or a total of USD 10.3 billion, with a strong focus on transport and storage (USD 6.4 billion) and energy generation and supply (USD 3.8 billion). USD 1.7 billion was allocated to water and sanitation, USD 712.4 million to health, and USD 530.7 million to education, as a part of social infrastructure and services. Humanitarian aid amounted to USD 1.1 billion.
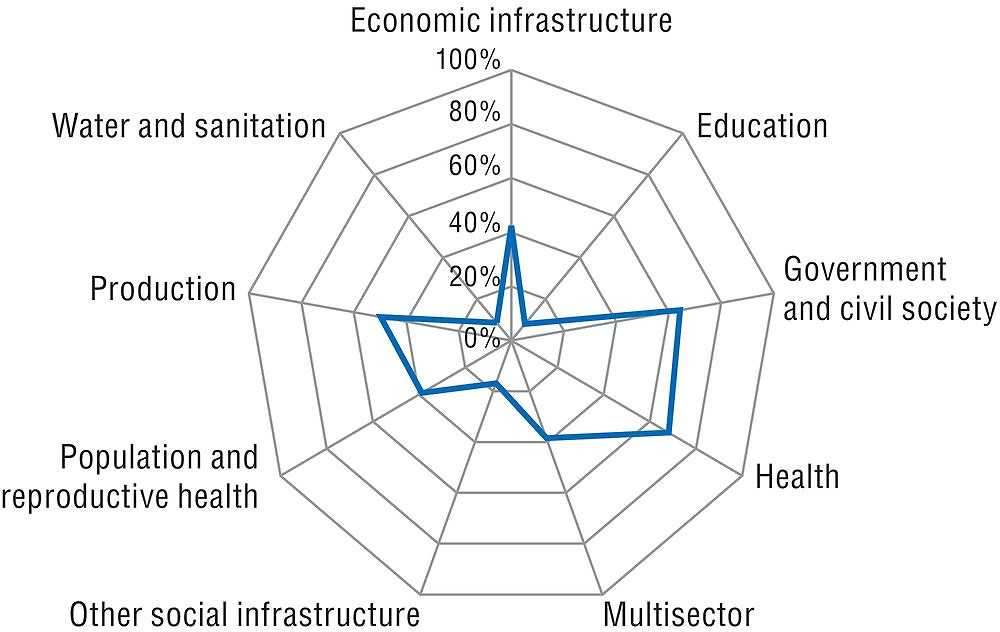
USD 7.2 billion of bilateral ODA supported gender equality in 2015. In 2015, 41.2% of Japan’s bilateral allocable aid had gender equality and women’s empowerment as a principal or significant objective, compared to the DAC country average of 36.3%. This was up from 2014 when it was at 22.6%. Japan’s aid to health and government and civil society focuses on gender. In 2013, the government of Japan announced a new and significant emphasis on women’s empowerment in its development co-operation. This was further emphasised in the 2015 Development Co-operation Charter.
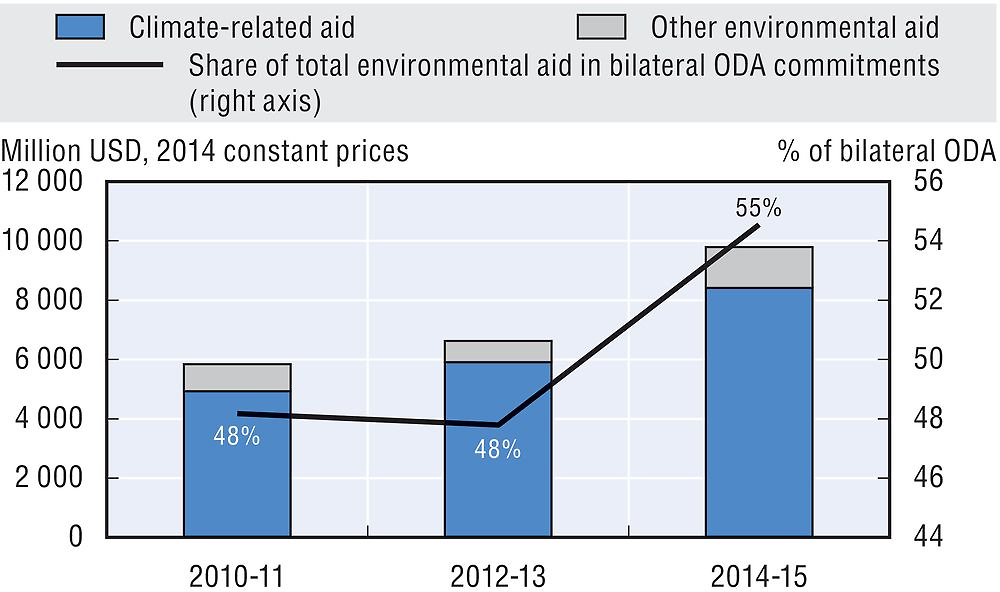
USD 9.7 billion of bilateral ODA supported the environment in 2015. Japan has maintained strong financial commitments to the environment and climate change. In 2015, 52.7% of its bilateral allocable aid supported the environment and 48.8% (USD 9 billion) focused particularly on climate change, compared with the respective DAC country averages of 33.2% and 26.2%.
Note to reader: Annex B provides “Methodological notes on the profiles of Development Assistance Committee members”.
References
OECD (2014), OECD Development Co-operation Peer Reviews: Japan 2014, OECD Publishing, Paris, https://doi.org/10.1787/9789264218161-en.
OECD (2008), DAC Recommendation on Untying ODA to the Least Developed Countries and Heavily Indebted Poor Countries, OECD, Paris, www.oecd.org/dac/41707972.pdf.
← 1. Japan interprets the Accra and Busan commitments on untying to be restricted only to ODA covered by the DAC Recommendation on Untying ODA to Least Developed Countries and Heavily Indebted Poor Countries (OECD, 2008). With respect to the implementation of the recommendation, Japan notified the DAC during the 2014 Peer Review that, in accordance with paragraph 21 of this recommendation, it reserves the right to use tied aid as part of its ODA to all non-LDC highly-indebted poor countries (HIPCs).