Family
The living arrangements of youth are important for a variety of reasons. Moving out of the parental home is an important step on the way to adulthood as is cohabitation, marriage or having children. The living arrangements of youth can also influence their welfare and poverty rates – those living with their parents may have a lower risk of poverty as they can depend more on their parents financially and may face little or no costs for housing, food or other daily expenses.
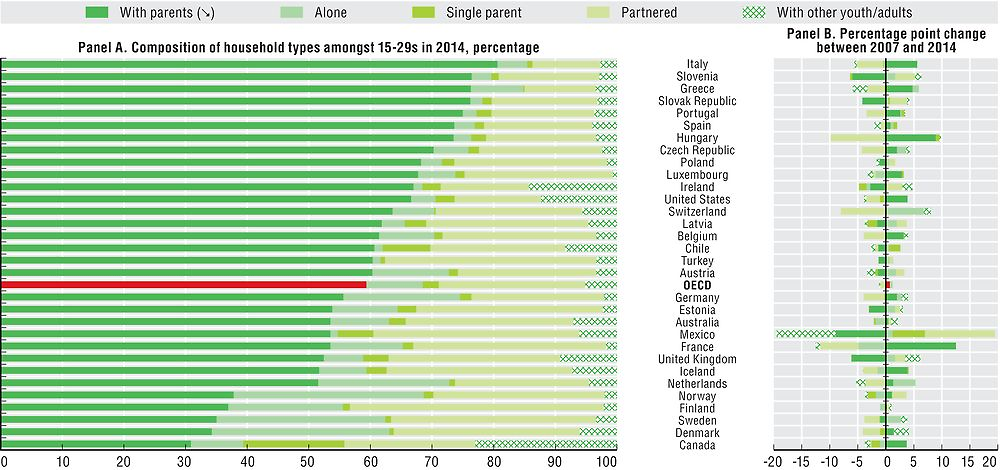
Large variation in the living arrangements of youth exists across the OECD. In countries such as Italy, Slovenia and Greece over three quarters of 15-29 year-olds live with their parents (Figure 3.10, Panel A). In others, notably Canada and the Nordic countries, a small proportion live with their parents and youth are much more likely to live independently, particularly on their own. On average, around a quarter of young people live with a partner ranging from 11% in Italy to 41% in Finland.
The recession appears to have had a small overall impact on the living arrangements of youth across the OECD but the average change masks larger changes in some countries (Figure 3.10, Panel B). For example, in France there was a 12.5 percentage point rise in the share of youth living with their parents. Countries hit strongly by the crisis, such as Greece and Italy saw smaller increases but these countries already had some of the highest shares of youth living in their family home before the crisis hit. Overall across the OECD there was an increase of 0.7 percentage point in the proportion of youth living with their parents and a 1 percentage point decline in the proportion of youth living with partners or spouses. This seems to suggest that the recession may have lengthened the time young people live at home and delayed their transition to forming their own families.
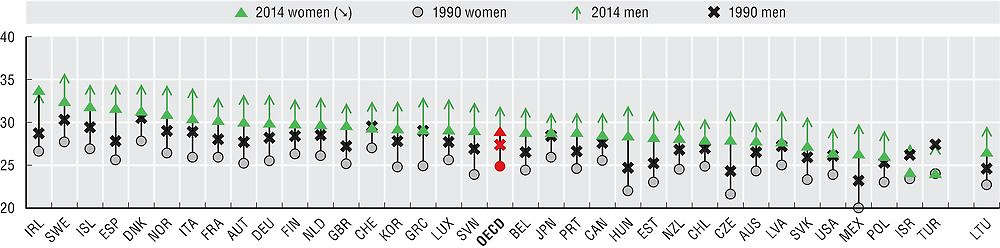
Across the OECD the average age of those getting married has significantly increased (Figure 3.11). At the start of the 1990s the average age at first marriage across OECD countries was 24.9 for women and 27.4 for men. By 2014, this average age had increased from 28 years old to 31 for women and from 31 years old to 34 for men. Despite common declining trends in increasing ages at first marriage, there remain notable differences between countries. The average age is very high in the Nordic countries. In Israel and in Turkey, by contrast, the average age of women at first marriage is below 25 and of men is less than 28. The difference between countries points to a variety of transition paths towards the formation of long-term partnerships: cohabitation has become an important form of long-term partnership in, for example, the Nordic countries, postponing and frequently replacing marriage as the partnership standard.
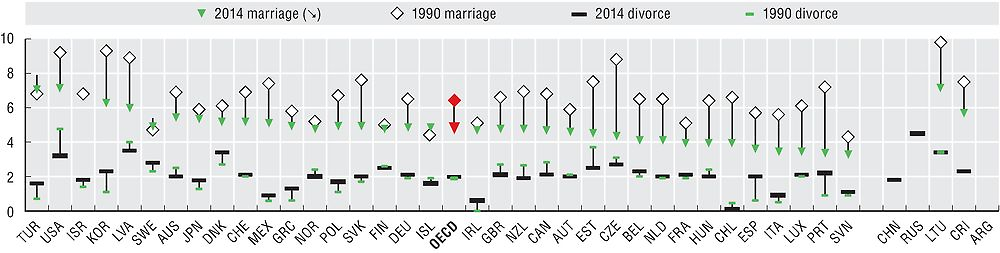
Higher ages of marriage were accompanied by declining marriage rates and stabilising divorce rates. In 2014, crude marriage rates were between 4 and 5.5 marriages per 1 000, with the OECD average standing at 4.6 (Figure 3.12). But rates are very low in Italy, Luxembourg, Portugal, Spain and Slovenia at 3.5 or fewer marriages per 1 000 people, while rates are almost twice that at 6 per 1 000 or above in Israel, Korea, Turkey and the United States. In contrast, in 1990 most OECD countries had a marriage rate of around five to seven marriages per 1 000 people. Only Sweden and Turkey experienced an increase in marriage rates between 1990 and 2014. Crude divorce rates also vary across countries, from as low as 0.1 divorces per 1 000 people in Chile to above 3 per 1 000 in Denmark and the United States in 2014. Between 1990 and 2014, the picture was mixed: they increased in 21 OECD countries but decreased in 14 others. Decline was most pronounced in the United States, from 4.8 divorces per 1 000 in 1992 to 3.2 in 2014.
Household types are defined as follows: “alone” describes a young person living on their own; “single parent” means that the young person lives with at least one dependent child and no partner; "partnered’ describes a young person living with a spouse or cohabiting partner (and potentially with children in the same household); “with other youth/adults” describes a young person living with at least one other young person or adult (aged 30 years or older) and potentially with children in the same household; “with parents” means that the young person lives in a household with at least one of their parents.
The mean age at first marriage is defined as the mean average age in years of marrying persons at the time of first marriage. This measure is disaggregated by sex with separate averages for men and women.
The crude marriage rate is defined as the number of legal civil unions or marriages each year per 1 000 people. The crude divorce rate (CDR), defined as the number of legal civil unions or marriages that are dissolved each year per 1 000 people.
Figure notes
Figure 3.10: Data for 2014 refer to 2013 for Switzerland, 2012 for Turkey and 2011 for Canada; data for 2007 refer to 2006 for Chile and 2008 for Switzerland and Mexico. No data for Israel, Japan, Korea and New Zealand.
Figure 3.11: Median age at first marriage for Australia, Israel, New Zealand and United States; civil unions are included in New Zealand; data refer to all marriages for Mexico.
Source: OECD calculations based on EU-SILC, HILDA (Australia), SLID (Canada), CASEN (Chile), HLFS (New Zealand) and CPS (United States).
Source: OECD Family Database (Indicator SF3.1) based on national statistical offices and Eurostat.
Source: OECD Family Database (Indicator SF3.1) based on national statistical offices and Eurostat.