Chapter 30. Norway
This chapter presents 2015 road safety data for Norway along with provisional data from 2016. It looks at trends in traffic and road safety from the years 1990 to 2015 and road user behaviour patterns with a special focus on the ageing population. Sections include data on speed, drink driving, drugs and driving, distracted driving, fatigue and seat belt usage. The chapter reviews Norway’s road safety strategy and national targets to 2029 and the progress achieved thus far. It also provides details of all recently implemented safety measures and current and ongoing research.1
In 2015, Norway registered 117 road deaths, the lowest number of fatalities recorded since 1945 and a 20% decrease over 2014. This equates to a fatality rate of 2.3 per 100 000 inhabitants, the lowest rate among IRTAD member countries for 2015. Provisional data indicate that there were 135 road deaths in 2016, a 15% increase over 2015’s exceptional figures, but still lower than 2014 level.
Road safety data collection
Definitions applied in Norway
-
Road fatality: Person killed in a traffic crash or from injuries within 30 days of the crash.
-
Seriously injured: Person suffering life threatening injuries, or injuries that lead to lasting injury, or other larger injuries that are not life-threatening.
-
Slightly injured: Person with minor fractures and wounds not requiring a hospital stay.
Currently in Norway the Maximum Abbreviated Injury Scale of three or more (MAIS3+) is not used to classify serious injuries, but this will hopefully be the case in the future when such injury data is provided by hospitals.
Data collection
Crash data are collected by the police and consolidated at the national level by Statistics Norway and the Public Roads Administration.
Less severe crashes and injuries are often not reported to the police, and may therefore be under-represented in the figures. This concerns in particular light injuries and single bicycle crashes. At the moment injury data is collected by police, but in 2014 and 2016 the University Hospital in Oslo collected data for bicycle accidents and accidents with pedestrians.
Most recent safety data
Road crashes in 2016 – provisional data
Based on provisional data, there were 135 road deaths in 2016, representing an increase of more than 15% compared to 2015, which was an exceptional year as it had the lowest number of road deaths on record since 1945. When compared to 2014 the number of fatalities in 2016 was reduced by 8%.
Road crashes in 2015
In 2015, there were 117 road deaths in Norway, a decrease of more than 20% when compared to 2014 and the lowest number of road deaths since 1945. In particular, there were fewer fatalities during the first semester. However, the number of people killed in the 18-20 age group was the highest since 2010. The number of deaths among those aged 65 and above was about half of the number in 2014, with a particularly low number for the over-80 age group.
Trends in traffic and road safety (1990-2016)
Traffic
In 2015, around 44 250 million vehicle-kilometres were registered on Norwegian public roads. Since 1990, vehicle-kilometres have increased by almost 60% on public roads. The number of registered vehicles increased by 66% for the same time period. In the last few years, there has been an increase in cyclists in the largest cities.
Road safety
The number of road deaths peaked in 1970 with 560 fatalities. The relatively low numbers of deaths in Norway are subject to annual fluctuations. However, the long-term trend shows a steady improvement in road safety. Between 2010 and 2015, the number of road deaths decreased by nearly 44%.
In 2014, the Norwegian Institute of Transport Research investigated what could explain the decline in number of traffic fatalities and serious injuries between 2010 and 2012 (TØI‐report 1299/2014). The decline observed during this period was larger than in any other period of the same duration since 1970. The study indicates that the two most important factors that have contributed to the decline in the number of fatalities and serious injuries is the increasing market penetration of various safety features on cars and the tendency, seen most clearly after 2006, for the mean speed of traffic to go down. Other factors that have contributed include a change in the age distribution of riders of large motorcycles (mean age has increased), a decline in the number of young drivers involved in accidents, a decline in the number of accidents involving children as pedestrians or cyclists, a decline in the number of accidents involving young moped riders, the construction of motorways and other roads with median barriers, and increased use of speed cameras.
Rates
Norway had a fatality rate of 2.9 deaths per 100 000 inhabitants in 2014 and 2.3 in 2015. This rate, as well as the rate of deaths per 10 000 registered vehicles are half of the rates of 2010.
Analysis of seriously injured data
In 2015, 668 persons were seriously injured in road traffic crashes, compared to 674 in 2014. In 2015, while few fatalities were recorded for pedestrians and cyclists, they accounted for a large share of those seriously injured.
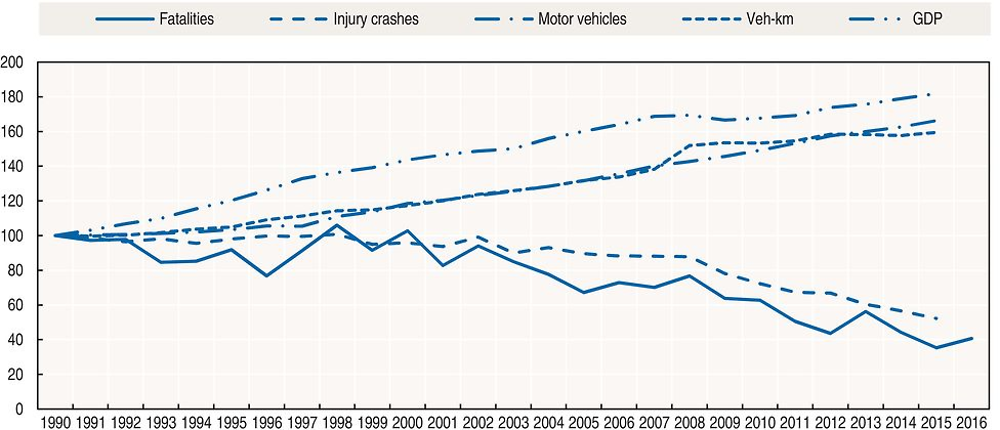
Source: World Bank (2017) (GDP; constant prices).
Road safety by user group
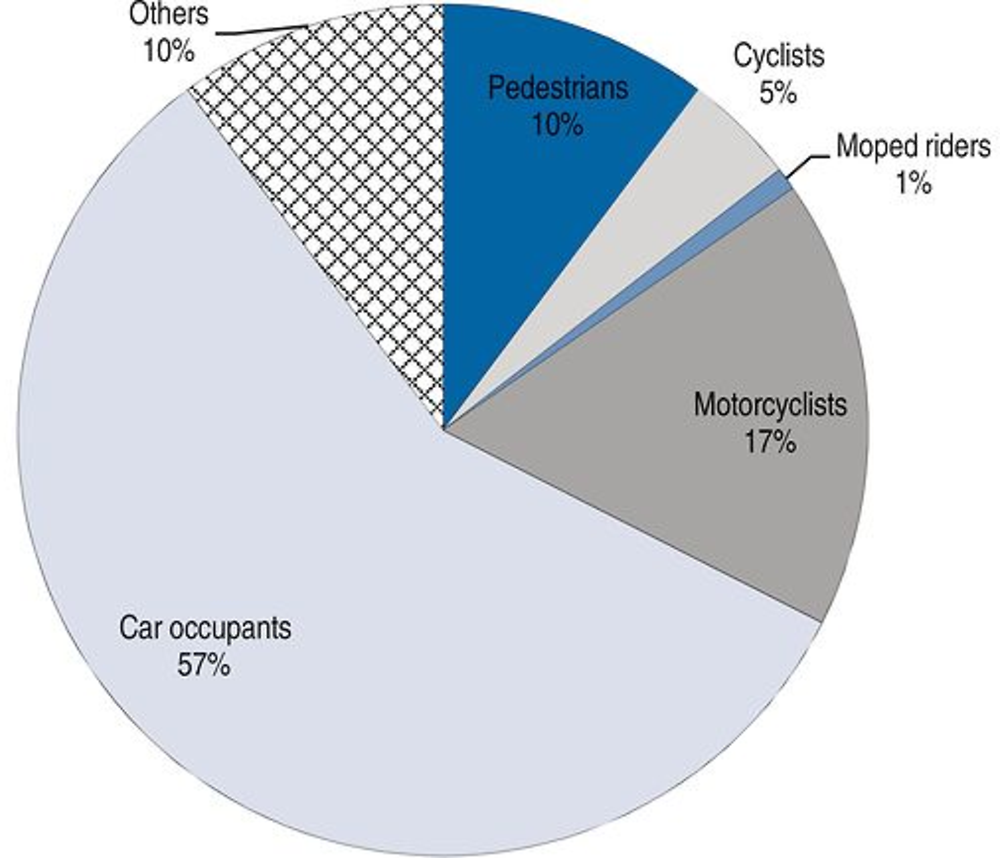
Since 2000, road safety improvements have benefited pedestrians and car occupants the most, while there has been less progress for cyclists and motorcyclists.
In 2015, all user groups benefited from safety improvements, except motorcyclists. The number of killed pedestrians decreased by a third, while the reduction among car occupants was less marked. The number of car drivers who lost their lives was reduced from 63 in 2014 to 58 in 2015. Their share of all fatalities, however, increased from 33% in 2014 to 49% in 2015.
In 2014, 12 cyclists were killed, a marked increase compared to previous years. However, the number of cyclists killed dropped to five in 2015 and then increased to 12 in 2016 (preliminary number). Nevertheless, an overall increase in the number of seriously injured cyclists was observed, from 54 in 2010 to 87 in 2015 and 85 in 2016 (preliminary data).
Road safety by age group
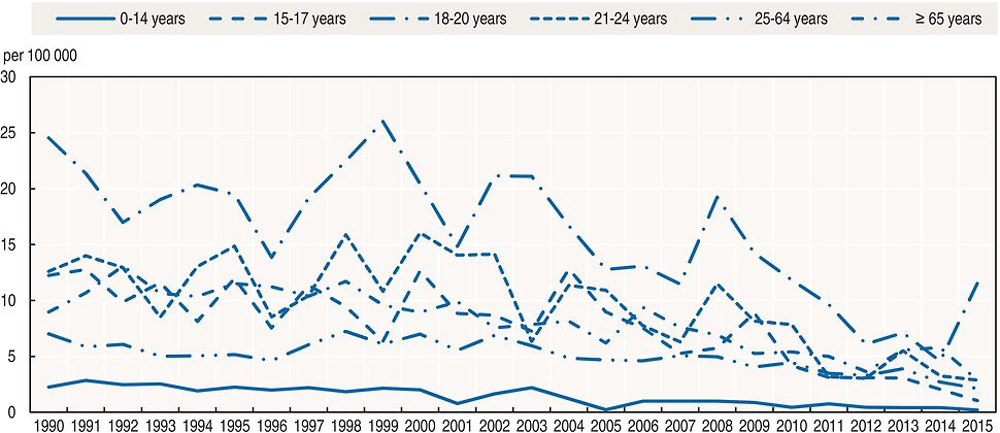
Since 1990, safety improvements have benefited all age groups, in particular children and young people.
In 2015, no children under 6 were killed in traffic, and only four young people under 18 lost their lives, compared to 9 in 2014. At the same time, in 2015 the fatality numbers as well as fatality rate increased significantly for the 18- 20 year old group following stable year-on-year improvements since 2008.
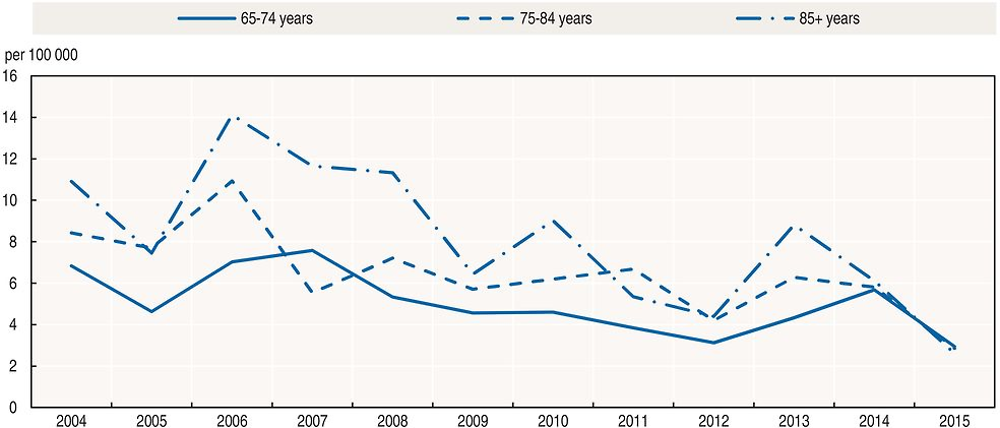
In the 65+ age group, 24 persons were killed in road traffic crashes, accounting for 20% of all fatal crashes in 2015. The corresponding share in 2014 was 32%. The older population had in 2014 a fatality rate twice that of the average, but this rate decreased twofold in 2015.
According to Statistics Norway, the share of people aged 75 and above will increase from 7% in 2015 to 11.5% in 2040. This raises a number of safety challenges, as older people are more fragile and have a much higher risk in traffic especially as drivers or pedestrians.
Several steps are being taken in co-operation with a wide range of stakeholders in order to ensure safer mobility for an ageing population including a review of the licensing renewal process.
Road safety by road type
In 2015, approximately 85% of road fatalities occurred outside densely populated areas. Of these, 52% were killed in head-on crashes or in run-off-road crashes.
During the last five years the number of killed and severely injured in head-on collisions and single vehicle crashes has decreased.
Economic costs of traffic crashes
Traffic crashes represent a significant cost for Norwegian society, estimated, in 2012, at around EUR 1.93 billion (excluding property damage costs). Costs are calculated on a willingness-to-pay approach.
Recent trends in road user behaviour
Speed
Studies in Norway show that excessive speed or high speeds incompatible with road conditions like snow, ice, fog or rain are an important element in fatal crashes and their consequences.
The average speed on Norwegian roads with an 80 km/h speed limit has decreased by about 1 km/h during the last five years. This is partly due to an increase in the share of older drivers and the fact that older drivers drive more slowly than younger drivers. Even though the changed age composition of the driver population explains part of the speed decrease, the decrease is also due to other factors, including higher traffic volume and decreased prevalence of large speeding violations (TØI, 2016).
The table below summarises the main speed limits in Norway.
Drink driving
The legal maximum blood alcohol content (BAC) is 0.2 g/l. The number of drivers impaired due to alcohol seems to be fairly stable or slightly reduced. In 2015, 22% of the fatal crashes were due to drunk drivers.
Drugs and driving
The number of impaired drivers due to drugs seems to be fairly stable.
Distraction
In Norway, the law stipulates that mobile phones must be correctly attached to the instrument panel in the vehicle, as close as possible to the driver. Hands-free devices can be used. There are no good estimations on the number of fatal crashes due to the use of mobile phones, but research shows that this is a factor to be watched carefully.
Sleepiness and fatigue
In-depth studies show that fatigue and sleepiness were the cause of 10% of all fatal crashes in Norway in 2015. Some of these crashes are also associated with illness or the consumption of alcohol or drugs.
Seat belts and helmets
Seat belt use has been compulsory in front seats of light vehicles since 1975 and in rear seats since 1985. Child restraints are compulsory for children under 135 cm in height. For children over 135 cm a child restraint should be used if available. In Norway it is recommended that children under the age of four should be seated facing backward.
The use of seat belts by drivers of light vehicles increased sharply between 2006 and 2013 as a result of enforcement and awareness campaigns. The seat belt wearing rate among drivers now stabilises at around 96-97%. There is no monitoring of seat belt use in rear seats, but it is estimated to be 7-8 percentage points lower. For children aged 1-3, the use of dedicated rear facing child restraints increased from 20% in 2010 to 49% in 2015, showing wider scope for improvement. The use of seat belts by heavy vehicle drivers increased from 53% in 2010 to 87% in 2015.
An analysis of fatal crashes in 2015 estimates that 37% of car occupants killed were not wearing a seat belt.
All riders of powered two-wheelers are required to wear helmets. The helmet-wearing rate is close to 100%.
There is no mandatory helmet-use law for cyclists. Helmet use by cyclists over the age of 12 in 2015 was 56%. In 2015, 3 out of the 10 cyclists killed on the roads were not wearing a helmet.
National road safety strategies and targets
Organisation of road safety
Traffic safety policy is co-ordinated by the Norwegian Public Roads Administration (NPRA). In addition to the NPRA, the police, the public health and education administrations, together with leading non-governmental organisations, are the main national stakeholders. At regional and local levels, counties and municipalities play a very important role. The Norwegian road safety policy relies on this broad and collaborative approach, a common and shared strategy and co-ordination among all stakeholders.
Road safety strategy for 2018-29
Norway’s parliament adopted Vision Zero in 2001. The Norwegian Vision Zero involves all modes of transport. The main focus is to reduce crashes that can lead to fatalities and serious injuries. The highest priority is given to the reduction of head-on crashes, single-vehicle crashes and collisions with cyclists and pedestrians. Special attention is also paid to high-risk road users, such as young drivers, elderly road users and motorcyclists.
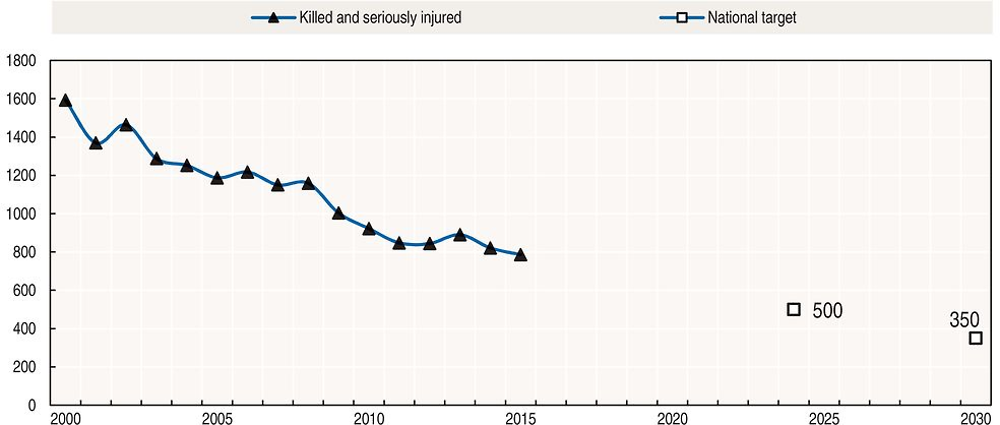
The coming National Transport Plan will cover the period 2018-29 and will include a new target of no more than 350 killed and seriously injured by 2030. The National Plan of Action for Road Traffic safety is published every four years and will soon be published for next period (2018-21). The current plan covers the period 2014-17 and is embedded into the National Transport Plan (NTP) 2014-24.
Road safety targets
The current plan includes a target of no more than 500 killed and seriously injured by 2024. The forthcoming plan includes a target of no more than 350 killed and seriously injured by 2030.
In 2015, a research programme Better Safety in Traffic (BEST) followed up on preliminary estimates of the potential for reducing the number of killed or seriously injured road users (TØI, 2015). The results show that it is possible to reduce the number of traffic fatalities in Norway by more than 50%. The number of seriously injured road users could be reduced by about 40%. These reductions are possible by implementing all currently used road safety measures to the maximum conceivable extent. If measures based on new technology which are ready for large scale implementation are used in addition to the current road safety measures, fatalities could be reduced by about 60% and serious injuries by about 45%.
Recent safety measures (2014-17)
Road safety campaigns
-
The speed campaign has been updated with a focus on young drivers. The campaign on road sharing (cyclists and cars) is ongoing and the seat belt campaign has been updated to include wearing seat belts in buses.
Vehicles
-
The NPRA uses a camera system for number plate recognition as a tool to carry out inspection tasks. The system is one of many measures adopted in order to achieve inspection objectives more efficiently. In 2015, the NPRA started a pilot project aiming to enforce compliance with the new requirement of an electronic toll payment tag for business vehicles. The requirement applies to both Norwegian and foreign vehicles on Norwegian roads.
Recent and ongoing research
-
The NPRA is conducting a 5-year (2013-17) research programme Better Safety in Traffic (BEST). The purpose of the programme is to assess the potential for reducing the numbers of fatalities and seriously injuries and identify areas where the greatest returns can be made in the coming years. In 2015 and 2016, there was specific research and analysis on all cyclist and pedestrians accidents registered by the emergency centre of Oslo.
-
The Institute of Transport Economics published, in 2017, a compendium of road safety measures, which summarises state-of-the-art knowledge on the effects of 34 types of road safety measures on fatalities and injuries (TØI report 1556/2017). www.toi.no/getfile.php/Publikasjoner/T%C3%98I%20rapporter/2017/1556-2017/1556-2017-%20sum.pdf (accessed 3 July 2017).
-
The Institute of Transport Economics published, in 2016, a study on speed and age which analyses the extent to which the increased share of older drivers has contributed to the recent decrease in average speeds (TØI report 1462/2016). www.toi.no/getfile.php/Publikasjoner/T%C3%98I%20rapporter/2016/1462-2016/1462-2016-sum.pdf (accessed 3 July 2017).
-
The Institute of Transport Economics published, in 2016, a study entitled “Safety in numbers: Uncovering the mechanisms of interplay in urban transport”, which assessed the impact on safety of an increased number of cyclists on the road (TØI report 1466/20164).
-
See more TØI reports at: www.toi.no (accessed 3 July 2017).
References
TOI (2015), “The potential for reducing the number of killed or seriously injured road users: Preliminary estimates”, TØI Report 1417/2015, Report with summary in English, www.toi.no/getfile.php/Publikasjoner/T%C3%98I%20rapporter/2015/1417-2015/1417-2015-sum.pdf (accessed 3 July 2017).
TØI (2016), “Speed and age: Changes in speed level on Norwegian roads with 80 km/h limit”, TOI report 1462/2016 TOI Institute of Transport Economics, Oslo, www.toi.no/getfile.php/Publikasjoner/T%C3 %98I%20rapporter/2016/1462-2016/1462-2016-sum.pdf (accessed 3 July 2017).
World Bank (2017), “GDP (constant US$)”, World Development Indicators, http://databank.worldbank.org/data/reports.aspx?source=world-development-indicators (accessed 23 February 2017).
Websites
-
Public Road Administration: www.vegvesen.no, National Road Safety Plan: www.vegvesen.no/en/Traffic/Road+safety/Road+safety (accessed 3 July 2017).
-
TØI – Research Institute for Transport Economics: www.toi.no (accessed 3 July 2017).
-
International Research Institute: www.iris.no (accessed 3 July 2017).
-
SINTEF: www.sintef.no (accessed 3 July 2017).
-
Norwegian Institute of Public Health: www.fhi.no (accessed 3 July 2017).
-
COWI: www.cowi.no (accessed 3 July 2017).
Note
← 1. All data stem from Public Roads Administration unless otherwise noted. For more information please contact: [email protected].