Health expenditure in relation to GDP
How much a country spends on health care over time relative to spending on all other goods and services in the economy can be down to both growth in health spending itself as well as how well the economy is performing overall. In 2016, health spending is estimated to have accounted for 9.0% of GDP on average across OECD countries, largely unchanged in recent years. This comes after a period of health spending growth above that of the overall economy in the 1990s and 2000s that saw health expenditure as a share of GDP rise sharply in many OECD countries.
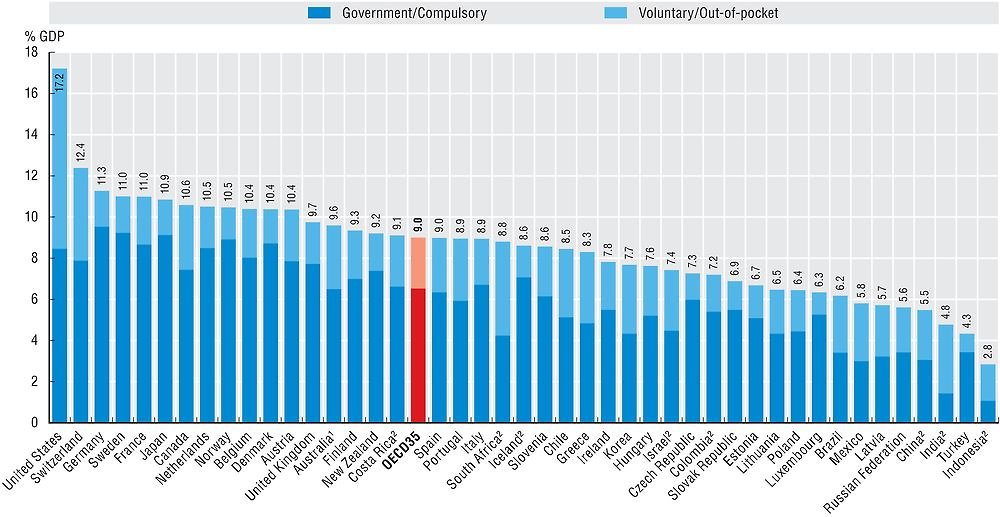
In 2016, the United States spent 17.2% of GDP on health, almost five percentage points above Switzerland, the next highest country, and more than eight percentage points above the OECD average (Figure 7.3). A group of ten high-income OECD countries, including Germany, France, Japan and Canada, follow with around 11% of GDP going on health services. Another large group of countries spanning Europe, as well as Australia and New Zealand (and South Africa) fit roughly within a band of between 8-10% of GDP. A similar sized group of mainly Central and Eastern European countries, such as Hungary, the Czech Republic and Poland allocate between 6-8% of their GDP to health. Only Mexico, Latvia and, notably Turkey at 4.3%, spend less than 6% of GDP on health services. Turkey’s health spending as a share of GDP is at a similar level to that in India.
Note: Expenditure excludes investments, unless otherwise stated.
1. Australian expenditure estimates exclude all expenditure for residential aged care facilities in welfare (social) services.
2. Includes investments.
Source: OECD Health Statistics 2017, WHO Global Health Expenditure Database.
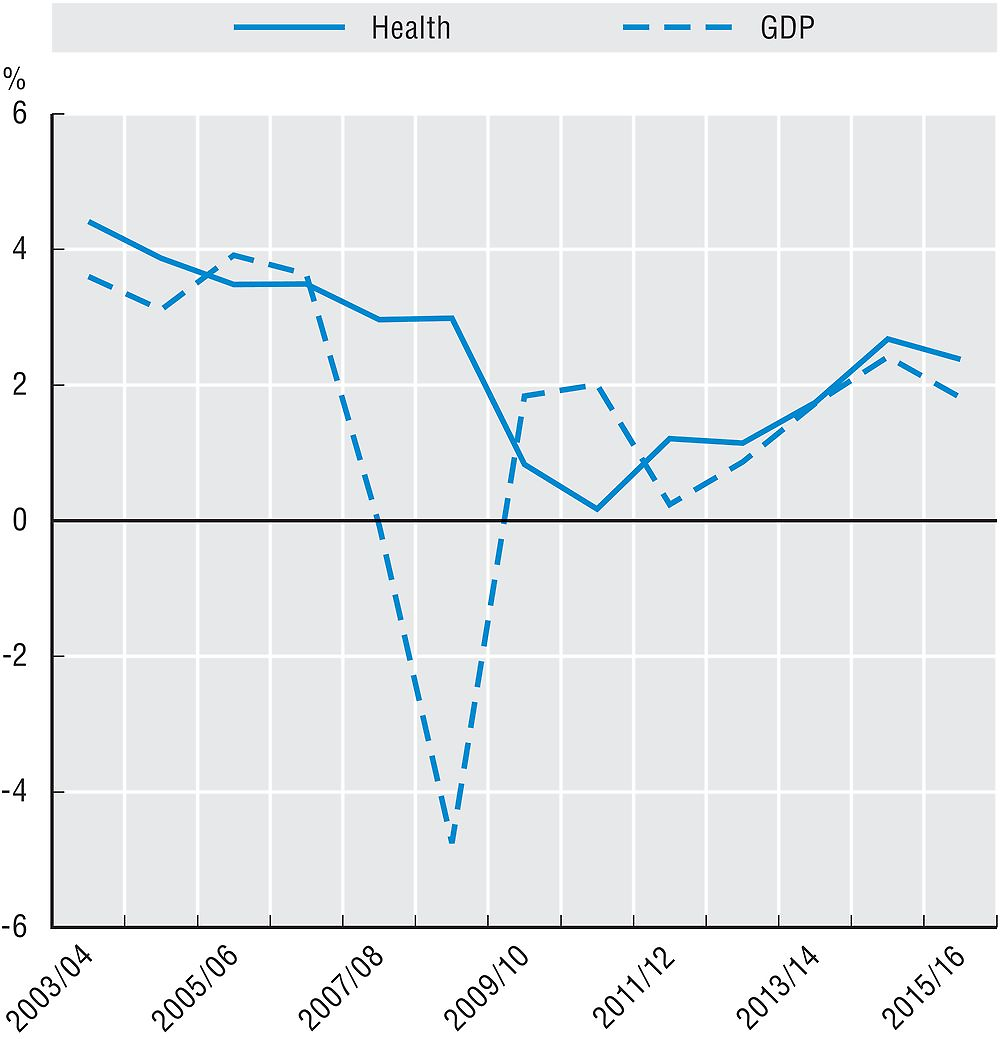
Looking at changes over time, the average health spending to GDP ratio jumped sharply in 2009 as overall economic conditions deteriorated rapidly in many countries while health spending growth was sustained at around 3% on average in 2008 and 2009 (Figure 7.4). While subsequent health spending growth also significantly declined – approaching zero growth on average in 2010/11 – this step increase in the health spending to GDP ratio has been largely maintained as the rate of health spending growth has tended to closely track the growth in the overall economy since 2012.
Source: OECD Health Statistics 2017.
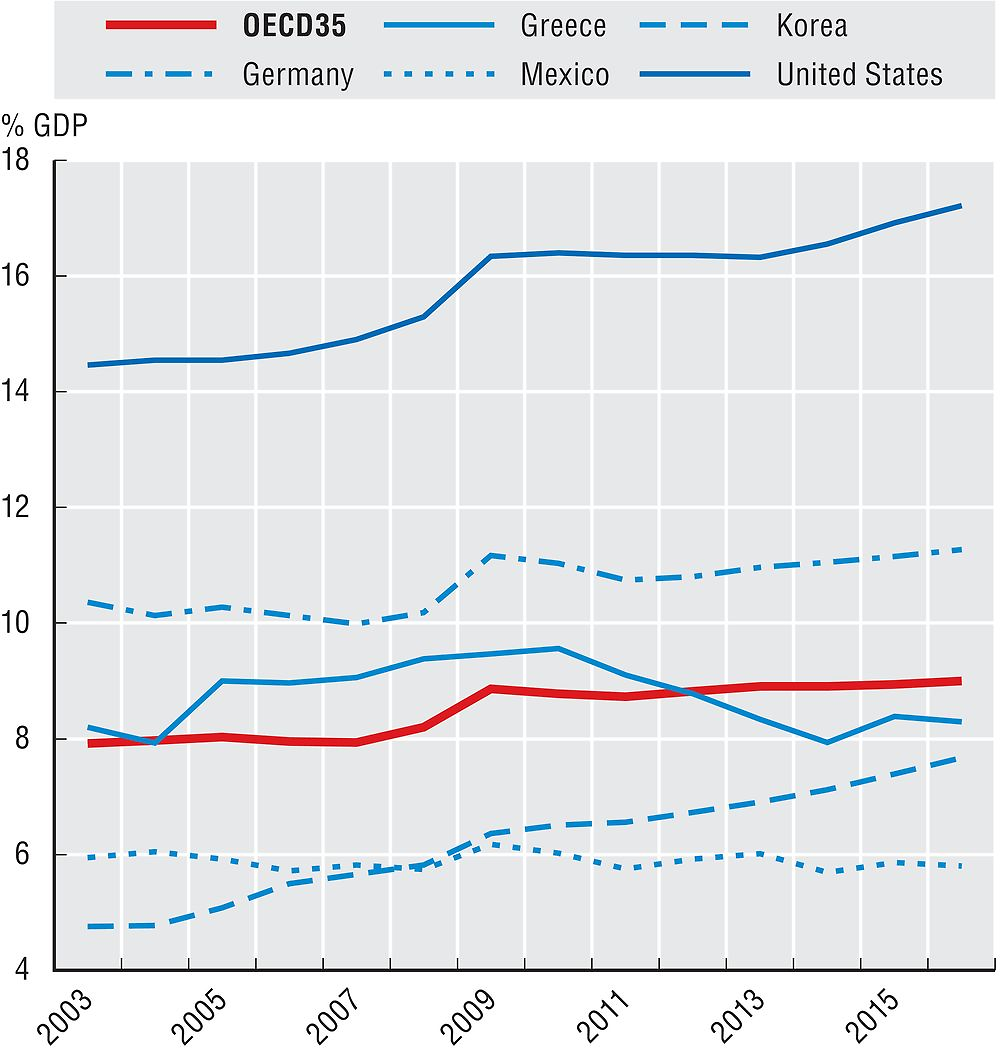
However, behind the overall OECD average, some different patterns emerge on a country by country basis. In the United States, after a number of years (2009-14) when the ratio of health spending to GDP has been stable at around 16.4%, 2015 and 2016 have seen this increase again to reach the 17.2% in 2016 (Figure 7.5). This mirrors the period before the economic crisis when health spending rose almost a percentage point between 2003 and 2008. Korea has seen the most notable increase in the share of economic resources allocated to health over time with a significant progression in the ratio over many years on the back of growing wealth and increased health coverage for the population. In 2003, health spending in Korea accounted for only 4.3% whereas in 2016 it was estimated to have reached 7.2%. At the other end of the scale, no discernible impact can be seen for Mexico which has seen its health spending to GDP ratio remain relatively constant throughout the period at around 6% of GDP.
Source: OECD Health Statistics 2017.
In Europe, Germany has seen its health spending to GDP ratio stabilise since 2009 as health spending growth has aligned with economic growth with a slow but steady increase to reach 11.3% in 2016, almost one percentage point above the level in 2003. Greece, on the other hand, where there have been significant cuts in health spending since 2009, has seen the health spending to GDP ratio fluctuate – approaching close to 10% in 2010 – before returning to a similar level to that in the early 2000s at around 8% of GDP.
See indicator on “Health expenditure per capita” for a definition of expenditure on health.
Gross Domestic Product (GDP) = final consumption + gross capital formation + net exports. Final consumption of households includes goods and services used by households or the community to satisfy their individual needs. It includes final consumption expenditure of households, general government and non-profit institutions serving households.
In countries, such as Ireland and Luxembourg, where a significant proportion of GDP refers to profits exported and not available for national consumption, GNI may be a more meaningful measure than GDP.
Note that data for 2016 are based on preliminary figures provided by the country or estimates made by OECD Secretariat.
References
OECD/Eurostat/WHO (2017), A System of Health Accounts 2011: Revised edition, OECD Publishing, Paris, https://doi.org/10.1787/9789264270985-en.