Spain
-
The gap in GDP per capita relative to the most advanced OECD countries is large. Potential GDP per capita growth has fallen since the crisis owing to a lower trend employment rate and sluggish total factor productivity growth.
-
Inequality as measured by the Gini coefficient has increased from 2008 to 2013 and is above the OECD average. This has been partly driven by the increase in unemployment and the fall in the share of income going to the poorest share of the population.
-
Wage moderation has increased in recent years. Thus, making wages more responsive to economic and firms’ conditions is no longer considered a current priority. The government has strengthened activation policy in 2015 and 2016 via higher spending and greater conditionality as well as implemented a new framework agreement for public private partnerships in intermediation. An education reform enacted in 2013 aimed at tackling early school drop-out rates has continued to be rolled out in 2015/2016.
-
Continuing to shift the tax burden from direct to indirect taxes and narrowing exemptions would improve further the growth friendliness and efficiency of the tax system. Improving access to vocational and higher education as well as the labour market content of programmes would boost skills and productivity. Further reducing barriers in service sectors would bring employment and productivity gains.
-
Higher taxes on environmentally damaging activities will make the tax system more efficient and help reduce pollution.
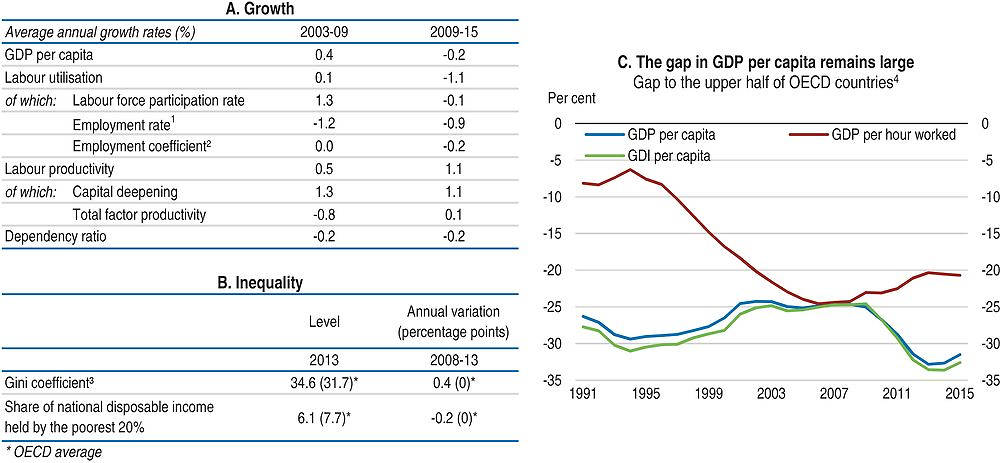
1. The employment rate is defined with respect to the economically active population; a positive growth rate corresponds to a decline in the structural unemployment rate and vice-versa.
2. This adjustment variable is added to the decomposition to capture the impact of non-resident workers.
3. The Gini index measures the extent to which the distribution of disposable income among households deviates from perfect equal distribution. A value of zero represents perfect equality and a value of 100 extreme inequality.
4. Percentage gap with respect to the weighted average using population weights of the highest 17 OECD countries in terms of GDP per capita, GDP per hour worked and GDI per capita (in constant 2010 PPPs).
Source: Panel A: OECD, Economic Outlook No. 100 Database; Panel B: OECD, Income Distribution Database; Panel C: OECD, National Accounts and Productivity Databases.
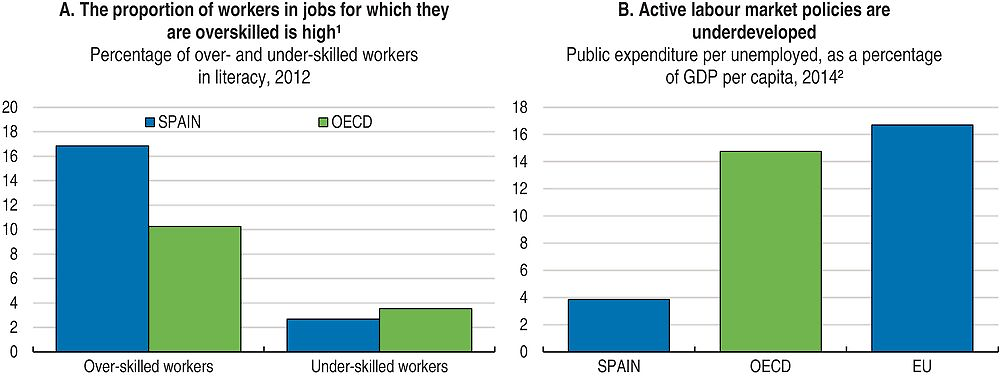
1. Over- (under-) skilled workers are those whose proficiency score is higher (lower) than that corresponding to the 95th (5th) percentile of self-reported well-matched workers in their country and occupation.
2. Data refer to 2013 for Spain.
Source: Panel A: OECD (2013), OECD Skills Outlook 2013: First Results from the Survey of Adult Skills; Panel B: OECD, Public expenditure and participant stocks on LMP and Economic Outlook Databases.
Going for Growth 2017 priorities
*Improve the efficiency and progressivity of the tax system.*1 Despite the 2014 tax reform, revenue still relies heavily on labour taxes and there are exemptions to the income tax that benefit mostly the better-off.
Recommendations: Further reduce the labour tax wedge on low-wage workers on both permanent and temporary contracts. Broaden the tax base by narrowing exemptions to the income, corporate, VAT and environmental taxes. Improve VAT administration and enforcement. Increase environmental taxes, including taxes on road transport fuel and the per-litre tax on diesel to at least the level of the tax on gasoline.
Improve access to vocational and higher education and ensure that associated programmes adapt to labour market needs. School drop-out rates, while have fallen, remain high and higher education programmes are ill adapted to job market needs, reducing workers’ employability and productivity.
Actions taken: The 2013 reform of the education and training system (LOMCE) that aims at improving schooling performance and curb early school drop-outs continued to be rolled out in 2015/16. As part of the LOMCE, basic vocational education training (VET) programmes for 15 year-olds are being introduced to make vocational education an attractive alternative to early drop out and a new dual VET system was introduced.
Recommendations: Improve student performance by improving the quality of teaching through adequate university training for teachers and on-the-job training. Continue the development and modernisation of VET, expand dual VET and ensure greater role of employers in designing curricula and training students. Increase university specialisation. Do not reduce average university grants until other financing alternatives, such as loans with income-contingent repayments, are available.
Strengthen active labour market policies. Without effective activation and training, the long-term unemployed are at risk of labour market and social exclusion.
Actions taken: Since 2014 policy actions to improve the framework for activation are being implemented, including stronger conditionality in the allocation of funds to regions based on the evaluation of results, streamlining services to jobseekers, providing training closer to labour market needs, and more individualised assistance by the public employment services. In 2015, the new framework agreement for public private partnerships in intermediation services started to operate. An action programme to improve assistance to the long-term unemployed started to be implemented in 2016.
Recommendations: Continue boosting resources and efforts to improve the efficiency of public employment services to effectively improve the delivery of activation policies. Make effective the 2015 reform of the training system for the unemployed, introduce systematic evaluation of training schemes and evaluate wage subsidies. Re-skill the long-term unemployed via the VET system and second-chance schools.
Reduce labour market duality. A high and persistent share of temporary jobs increases unemployment risks, especially for youth, and reduces productivity.
Actions taken: No action taken.
Recommendations: Pursue greater convergence of termination costs between permanent contracts and temporary contracts.
Lower entry barriers in non-manufacturing industries. High regulatory barriers to entry in certain sectors, such as professional services or maritime transport, hold back productivity and job creation.
Actions taken: No action taken.
Recommendations: Reduce the number of professions requiring membership in a professional body and the cost of membership. Reduce regulatory barriers to entry in rail and maritime transport. Speed up the sectorial adaptation of the Market Unity Law and its full implementation to all economic activities.
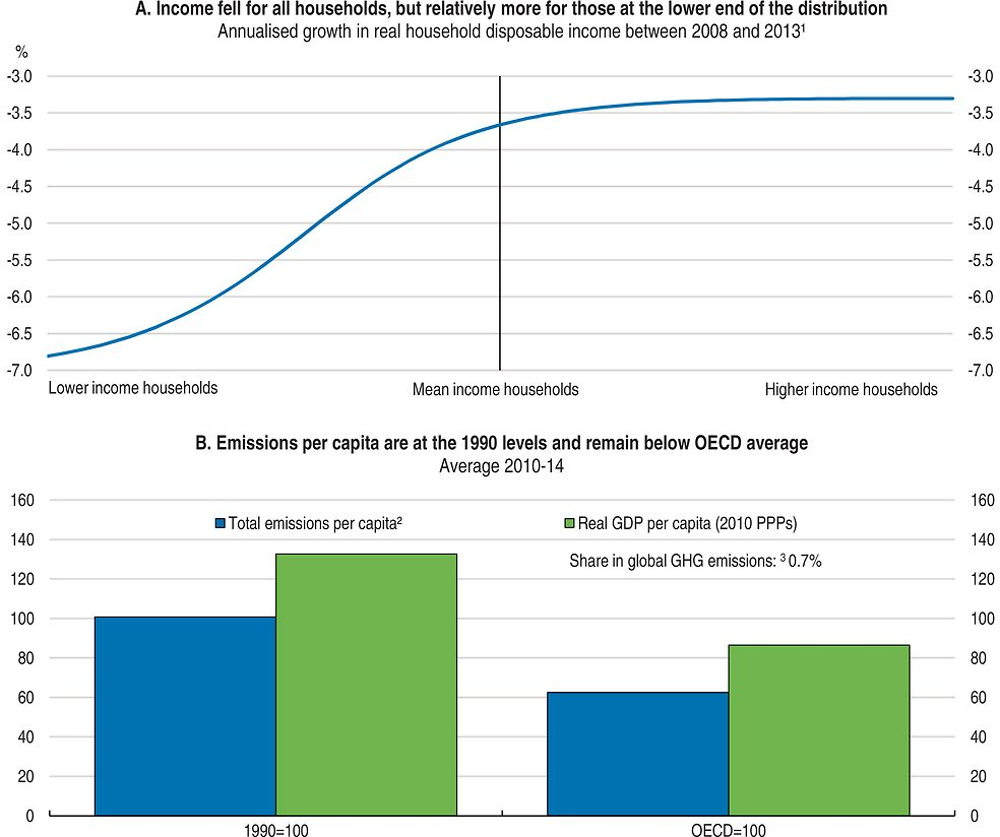
1. The data show average annual growth rates in disposable income (i.e. income after tax and transfers) across the distribution and refer to the period between 2008 and 2013. Disposable incomes cover the full population. Income data are expressed in constant prices (OECD base year 2010).
2. Total GHG emissions including LULUCF in CO2 equivalents (UNFCCC). The OECD average (excluding Israel and Korea) is calculated according to the same definition.
3. Share in world GHG emissions is calculated using International Energy Agency (IEA) 2010 data.
Source: Panel A: OECD, Income Distribution Database; Panel B: OECD, National Accounts and Energy (IEA) Databases, United Nations Framework Convention on Climate Change (UNFCCC) Database.
Note
← 1. New policy priorities identified in Going for Growth 2017 (with respect to Going for Growth 2015) are preceded and followed by an “*”.