Lithuania1
-
The gap in GDP per capita relative to the most advanced OECD countries is gradually narrowing but remains large. Labour utilisation has improved while labour productivity growth has been rapid, following Lithuania’s entry into the Eurozone and successive growth-enhancing reforms in domestic product markets.
-
Inequality is high by OECD standards but has slightly decreased in the five years after the financial crisis. The poverty rate is one of the highest among European countries. Child poverty and individuals’ health status remain strongly dependent on socio-economic background and there is a risk of a vicious circle linking socio-economic backgrounds, economic opportunities and life expectancy.
-
Policy reforms could put Lithuania on a stronger and more inclusive growth path. Measures that reduce the high tax wedge and strengthen active labour market programmes can help support employment growth. At the same time, improvements in the quality of education are needed to ensure that employers can find workers with the right skills. Inclusive growth can also be fostered by improvements in the governance of state-owned enterprises and measures to reduce the poverty rate, such as the expansion of unemployment benefits and improved efficiency and effectiveness of the health system.
-
New spending for health and education can be enabled by higher taxation of activities that are harmful to the environment. Lithuania has no car tax or road-user charges for passenger cars, and taxes on motor fuels and fuel used for heating are among the lowest in the European Union.
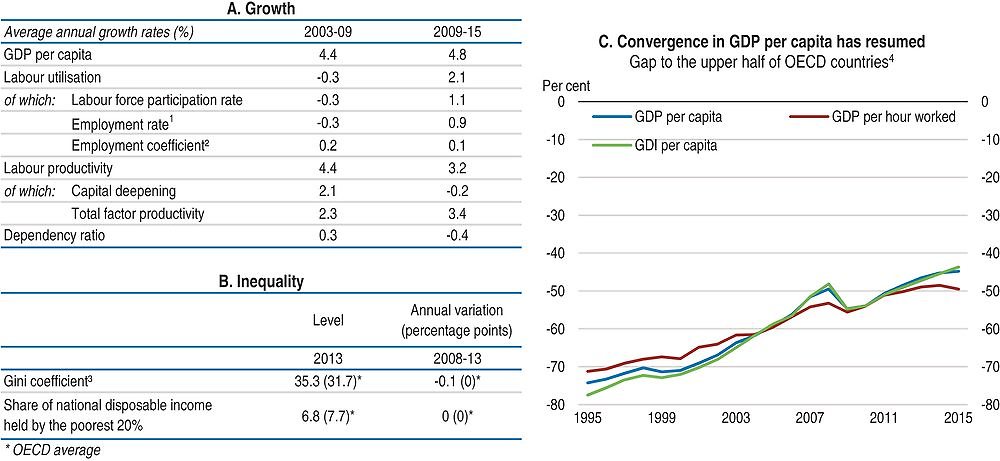
1. Labour utilisation is defined as the ratio of total employment over population.
2. This adjustment variable is added to the decomposition to capture the impact of non-resident workers.
3. The Gini index measures the extent to which the distribution of disposable income among households deviates from perfect equal distribution. A value of zero represents perfect equality and a value of 100 extreme inequality.
4. Percentage gap with respect to the weighted average using population weights of the highest 17 OECD countries in terms of GDP per capita and GDP per hour worked (in constant 2010 PPPs).
Source: Panel A: OECD, Economic Outlook No. 100 Database; Panel B: OECD, Income Distribution Database; Panel C: OECD, National Accounts and Productivity Databases; World Bank, World Development Indicators (WDI) Database.
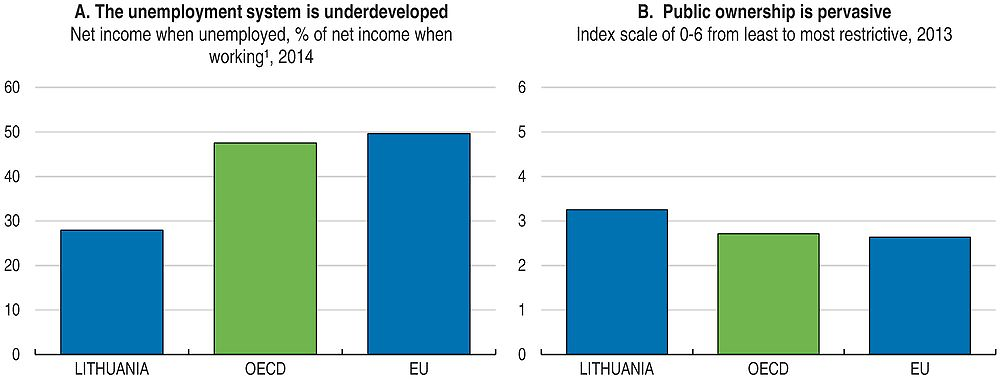
1. Simple average of the net replacement rates for the following households situations: single with no child and with two children at 67% and 100% AW, one-earner married couple with no child and with two children at 67% AW and 100% AW. After tax and including unemployment benefits, social assistance, family and housing benefits in the 60th month of benefit receipt.
Source: Panel A: OECD, Tax-Benefit Models; Panel B: OECD, Product Market Regulation Database.
Going for Growth 2017 priorities
Reduce the tax wedge for low-paid workers. The unemployment rate is particularly high for low-paid workers. Employer social security contributions accounted for 58% of the tax wedge in 2014, compared to 39% on average in OECD countries.
Recommendations: Employer social security contributions for low-paid workers should be lowered. The coverage of in-work benefits for social assistance recipients who take a low-paid job should be increased to raise the incentive to work and increase incomes at the lower end of the distribution.
Strengthen activation and extend unemployment benefits. Spending on active labour market policies as a share of GDP is currently below the OECD average. Labour market matching is poor, evidenced by Lithuania’s high structural unemployment rate which is estimated to exceed 10%.
Recommendations: Bolster active labour market programmes, the capacities of public employment services and unemployment benefits. Such reforms will be particularly important once planned reforms to relax employment protection legislation come into effect. The resources of public employment services, which are currently understaffed, should be increased. Expand the coverage and generosity of unemployment benefits to enhance the job search capacity of the unemployed.
Ensure that workers acquire job-relevant skills. A high proportion of Lithuanian firms cite an inadequately educated workforce as a significant obstacle to growth. The participation rate in pre-primary education is below the OECD average.
Recommendations: Increase the role of workplace training so qualifications better match labour market needs. Introduce more teacher development programmes to attract higher-performing graduates to the teaching profession. Better enforce the participation of pre-primary students in education.
Improve SOEs governance. Many state-owned enterprises perform poorly, with return on equity well below the target set by the government.
Recommendations: Improve corporate governance of SOEs to enhance their productivity. Ensure that the ownership and regulatory functions of SOEs are not performed by the same government ministry. Increase the proportion of independent non-executive board members on SOE boards.
Improve effectiveness and efficiency of the health system. Life expectancy is around six years below the OECD average and disparities in health status between urban and rural areas are large.
Recommendations: Promote healthy lifestyles and primary care services, especially in rural areas. Improve prevention policies and out-patient care by general practitioners, nurses and the recently established network of public health bureaus. Promote generic drugs to reduce currently large out-of pocket payments for pharmaceutical products.
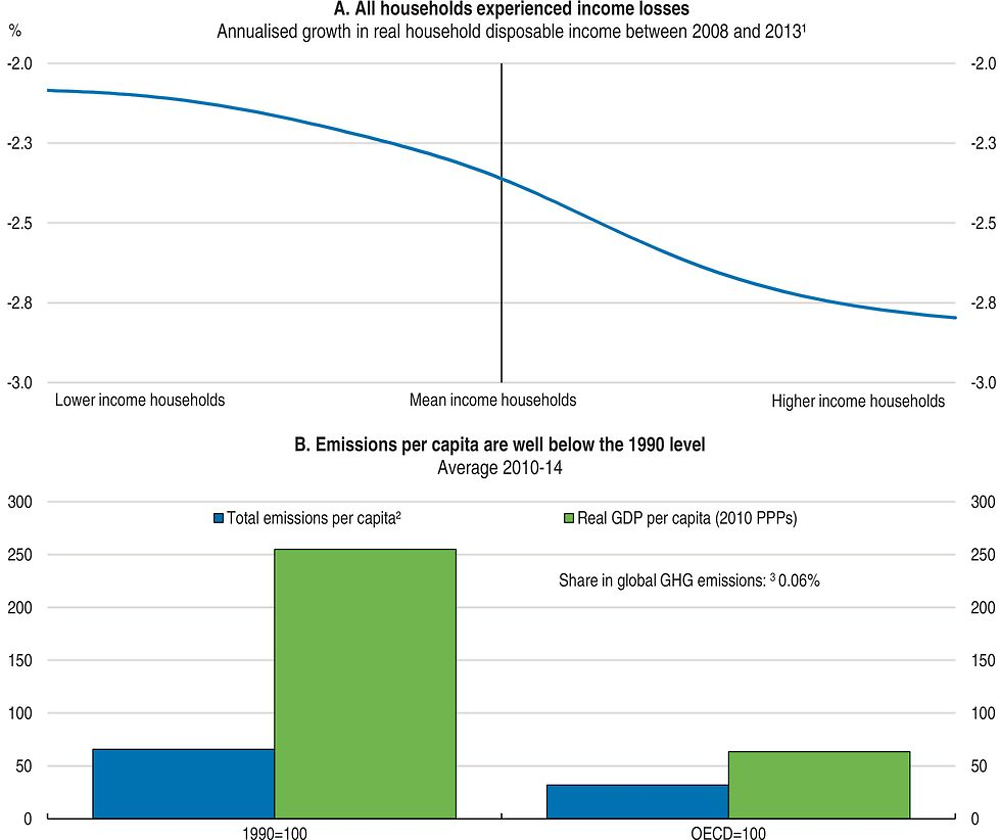
1. The data show average annual growth rates in disposable income (i.e. income after tax and transfers) across the distribution and refer to the period between 2008 and 2013. Disposable incomes cover the full population. Income data are expressed in constant prices (OECD base year 2010).
2. Total GHG emissions including LULUCF in CO2 equivalents (UNFCCC). The OECD average (excluding Israel and Korea) is calculated according to the same definition.
3. Share in world GHG emissions is calculated using International Energy Agency (IEA) 2010 data.
Source: Panel A: OECD, Income Distribution Database; Panel B: OECD, National Accounts and Energy (IEA) Databases, United Nations Framework Convention on Climate Change (UNFCCC) Database.
Note
← 1. Since this country is covered for the first time in Going for Growth, structural reform priorities are all new by definition, which implies that there is no follow-up on actions taken on those priorities