Assessment and recommendations
Income convergence may have resumed but growth needs to become more inclusive
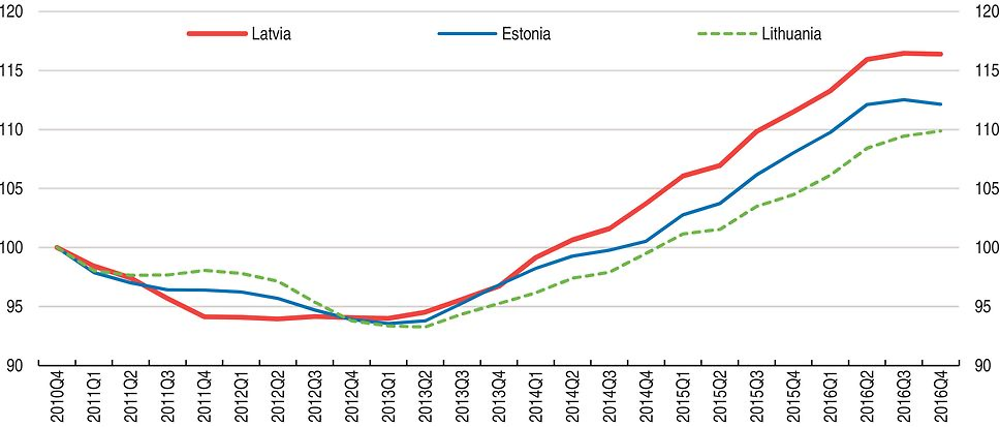
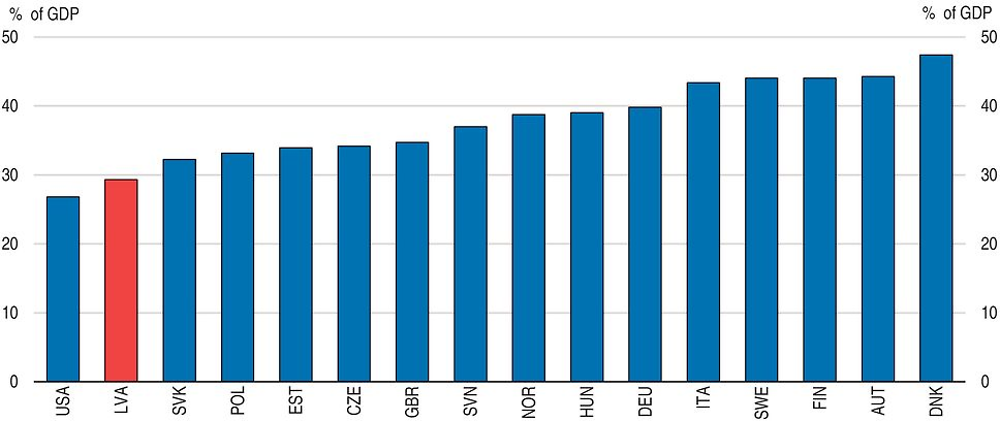
Latvia’s economy has grown robustly in recent years (Figure 1), although it suffered in the global recession and faces a challenging environment as exports to Russia have fallen. Latvian exporters have gained market share. Rising wages have supported growth in household consumption. The fiscal position is solid, with a balanced government budget in 2016 and government debt near 40% of GDP. Private sector indebtedness has fallen to relatively low levels. Modest government and private debt and a solid financial sector underpin strong financial market confidence. The Riga metropolitan area is a key driver of economic growth, hosting the country’s nascent high-tech sectors, and contributes about 69% to national GDP.
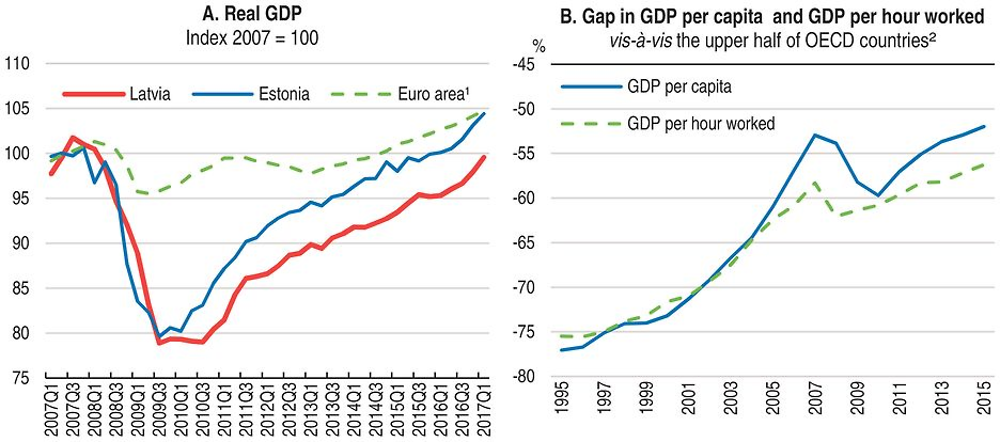
1. Euro area countries which are OECD members.
2. Percentage gap with respect to the weighted average using population weights of the highest 17 OECD countries in terms of GDP per capita and GDP per hour worked (in constant 2010 PPPs).
Source: OECD (2017), OECD Economic Outlook: Statistics and Projections (database), OECD (2017), OECD National Accounts Statistics (database) and OECD Productivity Statistics (database).
Recent progress on structural reform priorities can lay the base for invigorating growth and well-being. Latvia stands out as the country which has taken most action on structural reform priorities identified in OECD’s Going for Growth (OECD, 2017a). The quality of education and training has improved and active labour market policies have been upgraded with EU funds. Administrative burdens to entrepreneurship have been reduced, the efficiency of the judiciary has been enhanced by consolidation of small district courts and efforts to boost tax revenue collection have born some fruit.
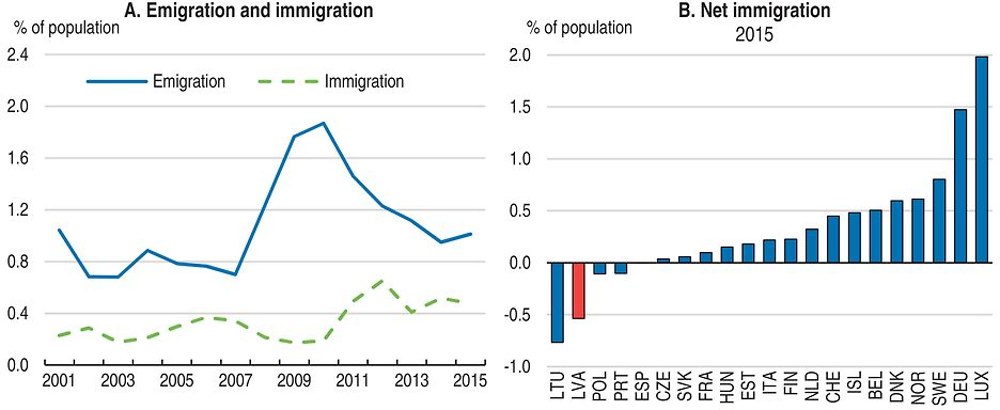
Despite these advances, the gap in income and productivity to high income OECD countries remains large. This gap also remains larger than in other Baltic countries or Central European countries. Productivity growth has slowed since the crisis, in Latvia as elsewhere (OECD 2016g). Diversification of export products and destinations have improved, still participation in global value chains remains concentrated on low-value-added activities. Unemployment has fallen but remains above 8%, and the incidence of long-run unemployment is still high, despite the short duration of unemployment benefit entitlements, which contributes to high poverty. Informal economic activity is still widespread, weighing on productivity, poverty and on tax revenues. Large emigration, mostly of young Latvians, contributes to skill shortages. As data from the Latvian Statistical Office show, a third of Latvian emigrants were between 20 and 30 years old in 2015. Geographic disparities in growth, employment and wellbeing are large.
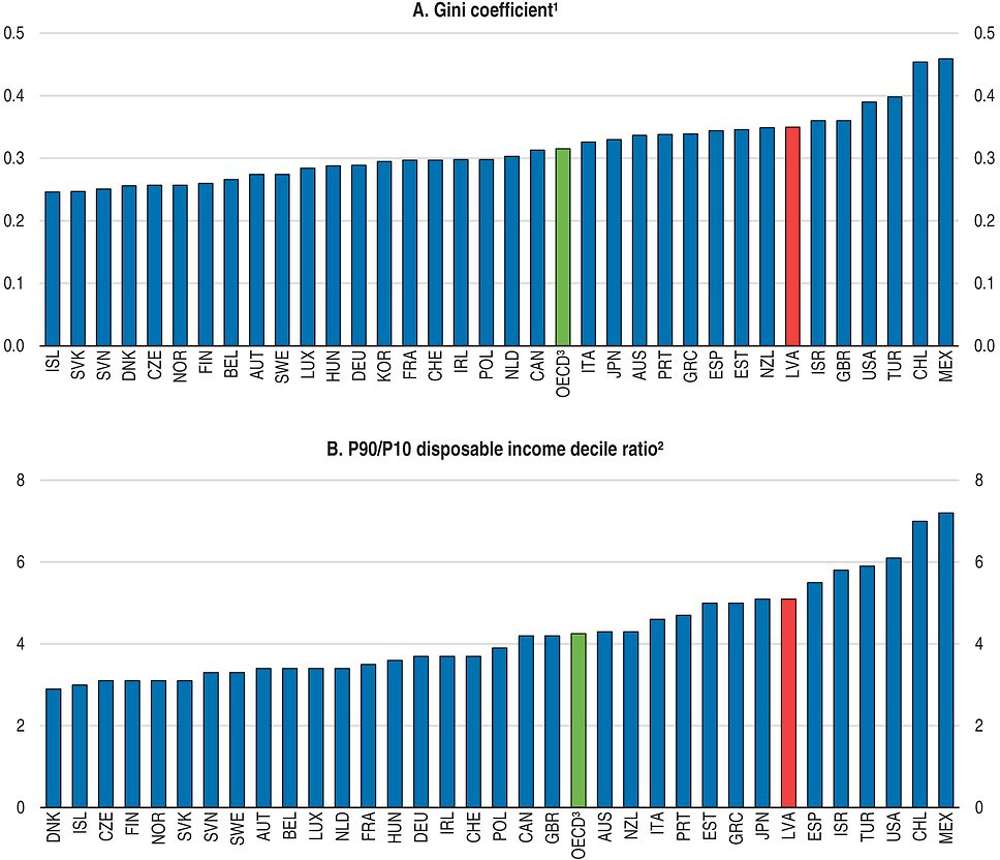
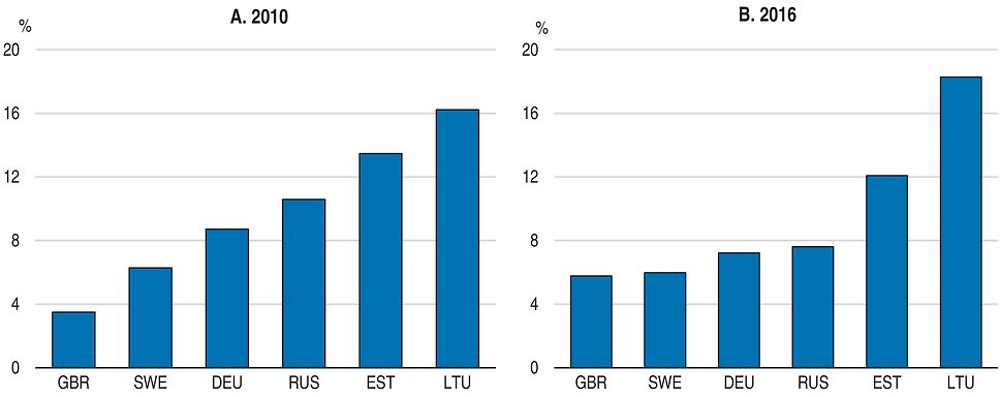
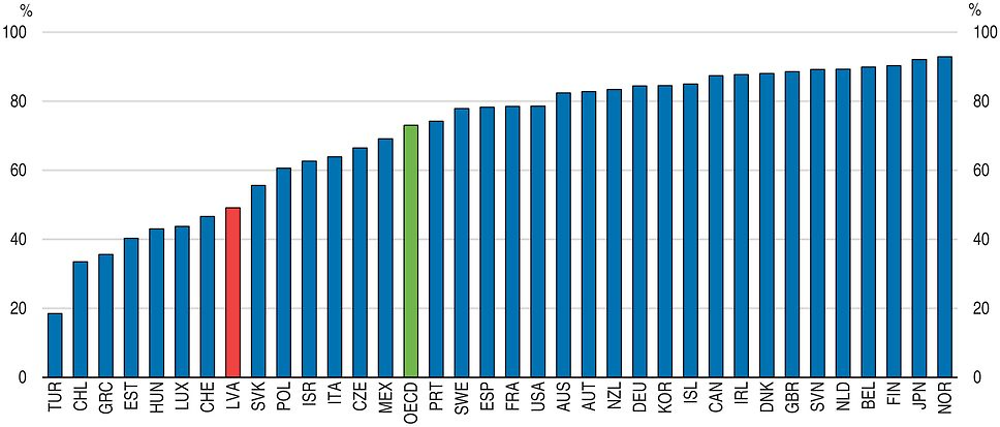
Latvians are less satisfied with their lives than the OECD average (Figure 2, Panel A) and in most of the dimensions of the OECD’s Better Life Index, Latvia scores below the OECD average. An exception is educational attainment, as almost all Latvians are educated at least to upper secondary level. However, vocational education has not been sufficiently attractive and has therefore undergone substantial reforms recently. The areas of relative weakness highlighted by the Better Life Index point to little access to well-paid jobs, and problems in the health care system and the housing market. Poverty is among the highest in the OECD (Panel B). The availability of affordable quality housing is low, for instance, the share of households’ housing spending in total expenditure (26%) is high, and higher than in other countries with similar income level, such as Estonia. Fifteen per cent of dwellings lack basic facilities. Life expectancy at birth in Latvia is 74 years, six years below the OECD average. The gap in health status between rich and poor households is large (Panel C). Income inequality is also high (Figure 3).
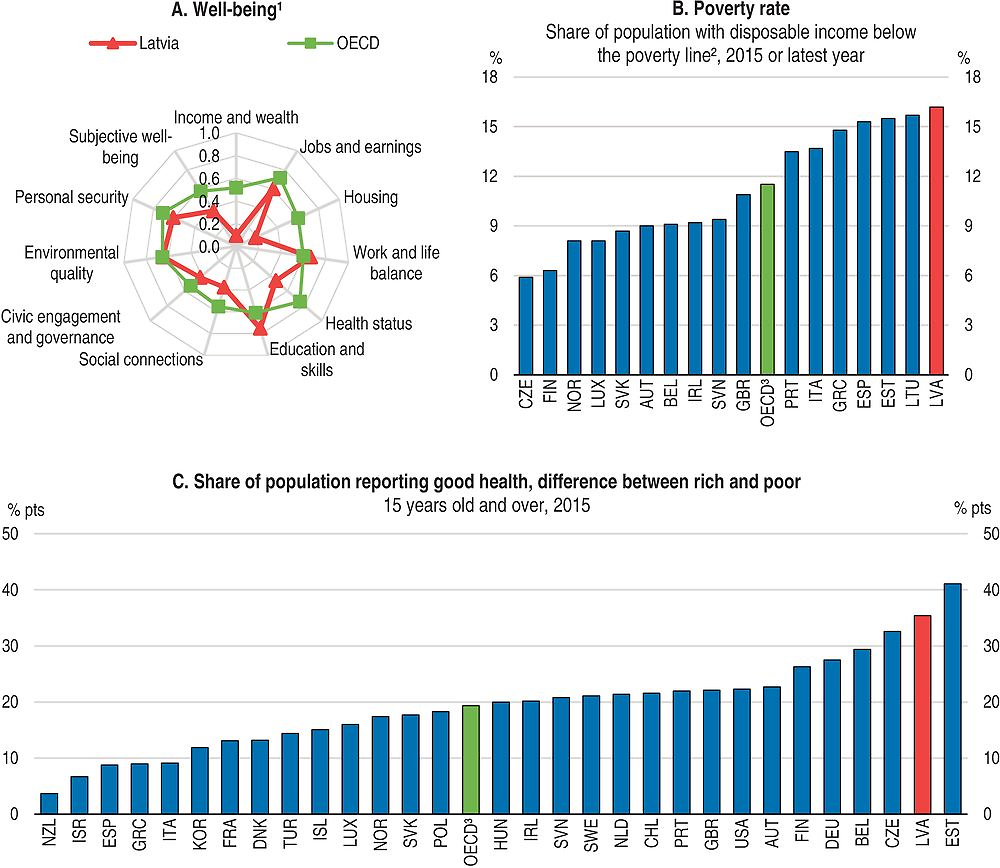
1. Each well-being dimension is measured by one to four indicators from the OECD Better Life Index database. Normalised indicators are averaged with equal weights. Indicators are normalised to range between 1 (best) and 0 according to the following formula: (indicator value – minimum value)/(maximum value – minimum value). “Civic engagement and governance” includes two indicators: stakeholder engagement for developing regulations and voter turnout. The former indicator for Latvia is a population-weighted OECD average due to lack of data.
2. The poverty line is half of median household income. Household income is adjusted to take into account household size.
3. Unweighted average.
Source: OECD (2017), OECD Better Life Index – Edition 2016 and OECD Social and Welfare Statistics (database).
1. It ranges from 0 (when everybody has identical incomes) to 1 (when all income goes to only one person).
2. The ratio of 10% of people with highest income to 10% of people with lowest income.
3. Unweighted average of the data shown.
Source: OECD (2017), OECD Social and Welfare Statistics (database).
A high incidence of poverty and unequal access to quality housing, jobs, education, health and transport services pose risks for social cohesion. Indeed trust in public institutions is generally low, which also damps willingness to pay tax. Weaknesses in effective law enforcement are also likely to have contributed. The government has introduced a broad range of reform initiatives to strengthen the judicial system. Social conflict in the form of strike has remained rare and the government has made efforts to consult social partners with important reform projects such as recent education reforms and the recent tax reform (see below).
Against this background, the main policy messages from the Survey are:
-
Latvia has recovered strongly from the global crisis. Greater integration in higher value added activities within global value-chains is key to build on this success and to continue improving living standards.
-
Policies which encourage capital and labour to move to firms with high growth potential, for example, through better allocation of credit and mobility of workers, would support this process.
-
Inclusive growth would benefit from improving access to jobs, better upskilling opportunities, improved healthcare and better transport, especially in rural areas.
Economic growth has been consumption-based while exports are still largely low value-added
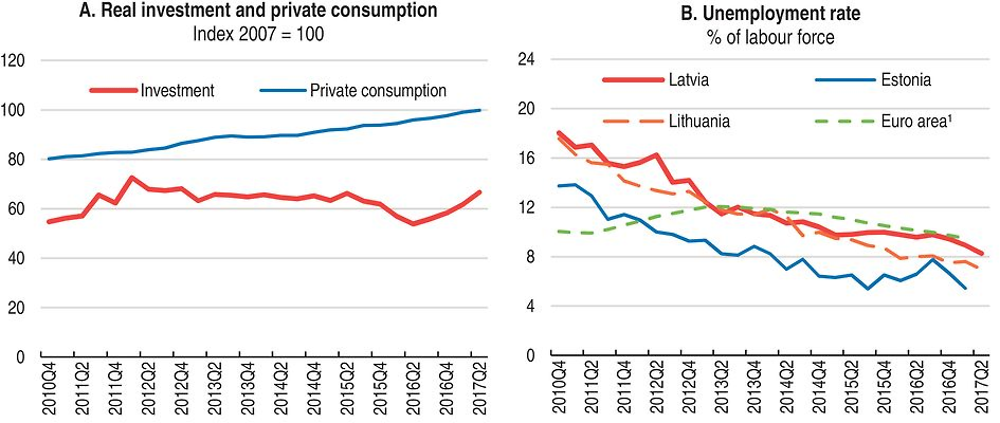
Economic growth slowed in 2016 (Table 1), notwithstanding continued robust household consumption supported by strong real wage growth (Figure 4). Investment fell due to the delay in the disbursement of EU structural funds (Figure 5, Panel A), which also affected residential investment, but has recovered recently. Residential investment also fell because restrictions on residence permits for non-EU citizens were introduced in 2014. Exports to Russia were subdued reflecting the economic crisis there. As in other Baltic economies, exporters gained market shares (Figure 6). The unemployment rate has fallen but remains high (Figure 5, Panel B). Consumer price inflation remains low.
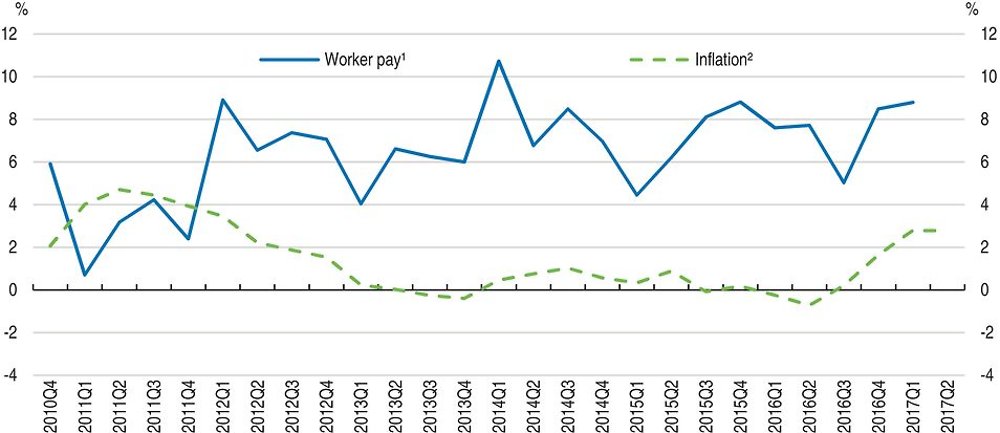
1. Worker pay rate refers to average nominal labour compensation per employee.
2. Harmonised consumer price index (HICP).
Source: OECD (2017), OECD Economic Outlook: Statistics and Projections (database).
1. Euro area countries which are OECD members.
Source: OECD (2017), OECD Economic Outlook: Statistics and Projections (database).
Note: Export performance is measured as the ratio of actual export volume to the country’s export market.
Source: OECD (2017), OECD Economic Outlook: Statistics and Projections (database).
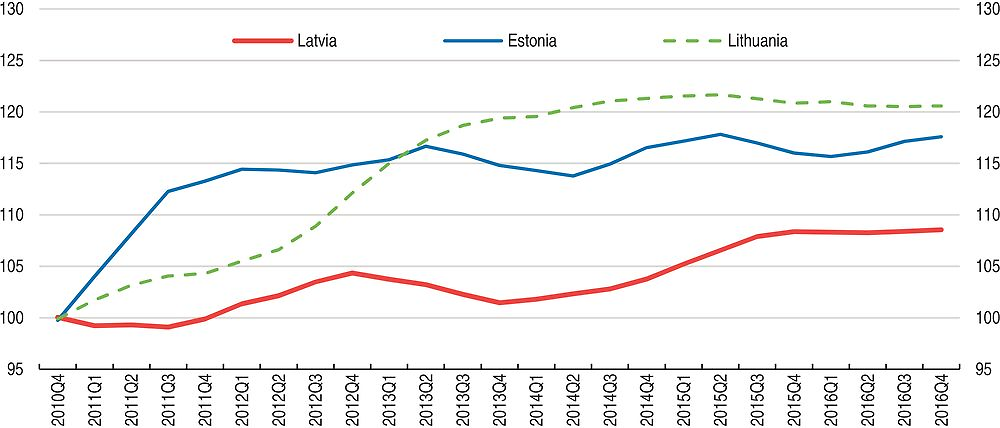
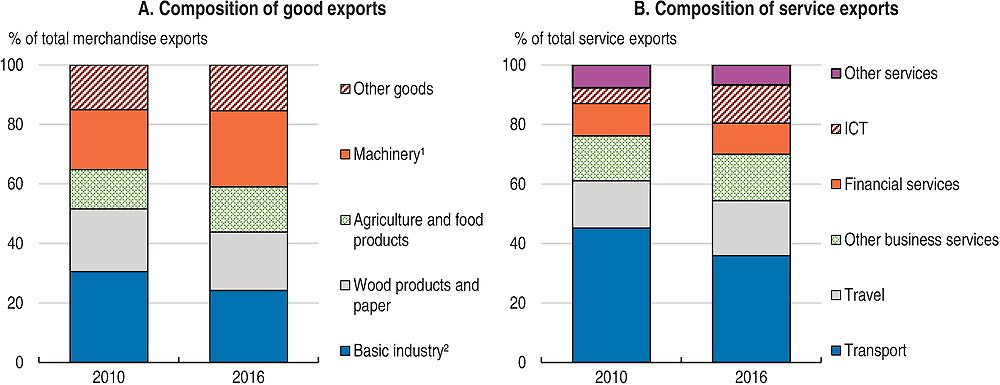
Latvian exports have diversified, contributing to gains in market shares. Latvia has increased exports to new markets to compensate for the drop in exports due to Russia’s economic downturn and its ban on EU food product imports. The share of exports going to Russia remains the third largest after Lithuania and Estonia (Figure 7). Machinery as well as information and communication technology (ICT) and travel service exports have gained ground (Figure 8). Nonetheless, Latvia’s goods exports still largely consists of raw materials and natural-resource-intensive products. Demand of these tends to grow little with rising incomes. In the medium-term the transit of exports from Russia is expected to continue declining but still contributes substantially to service export revenues.
Source: Central Statistical Bureau of Latvia.
1. Includes mechanical appliances; electrical equipment; transport vehicles; optical instruments and apparatus (inc. medical); clocks and watches; musical instruments.
2. Includes products of the chemical and allied industries; plastics and articles thereof; rubber and articles thereof; base metals and articles of base metals; and mineral products.
Source: OECD (2017), OECD Statistics on International Trade in Services (database) and Central Statistical Bureau of Latvia.
Reflecting strong wage growth, Latvia’s relative unit labour costs have increased since 2010, more so than in the other Baltic countries (Figure 9), which have gained more export market share. However, wage growth may have been overstated as underreporting of wages to tax authorities diminished. Also, Latvian export market shares have improved markedly since 2014. The depreciation of the Euro and the appreciation of the Ruble reversed the trend in late 2016 but may only have a temporary impact. Since Latvia’s exports are concentrated on industries and activities with relatively small room for quality upgrading and product differentiation, further loss of cost competitiveness can undermine Latvia’s export performance.
← 1. The competitiveness indicator is the ratio of own unit labour costs relative to those of trading partners. An increase corresponds to lower competitiveness.
Source: OECD (2017), OECD Economic Outlook: Statistics and Projections (database).
Wage growth is largely driven by skills shortages, in part on account of emigration, which remains high (Figure 10). Moreover, unemployment in the dynamic capital region is already very low, while mobility and skill barriers prevent the unemployed from other regions to take up jobs there. The minimum wage has risen.
Source: Eurostat and Central Statistical Bureau of Latvia.
GDP growth is projected to strengthen in 2017 (Table 1). Disbursement of EU funds picks up, boosting investment strongly. Household consumption is projected to remain robust on the back of sustained real wage growth. Exports will strengthen thanks to the gradual recovery in the main trading partners. The current account balance will diminish as strong consumption and investment increase imports, and is projected to move into a small deficit. Unemployment is projected to fall only slowly due to high structural unemployment. Inflation will remain low, although the impact of low energy prices fades.
As a small open economy, Latvia is exposed to developments in its main trading partners, the European Union and Russia. While exports to the United Kingdom grew in 2016, the decision of the UK to leave the European Union may affect export prospects in the medium term, as the UK is an important trading partner. It may also lower Latvian emigrants’ remittances, which amount to 0.8% of GDP. A further risk to the outlook is that financial market turbulence could reemerge in the euro area, which may also increase macroeconomic risks for Latvia. Such turbulence could tighten lending conditions throughout the euro area and reduce demand in Latvian export markets. Increased economic uncertainty may raise precautionary household saving, damping consumption, as limited social protection provides little insurance against income risks. Indeed, the Latvian economy has a track record of volatility in response to shocks, as documented in the 2015 Economic Survey of Latvia (OECD, 2015a). On the other hand, if Latvia implements structural reforms that boost inclusive growth at a faster pace, exports would grow more strongly and resilience could improve. Stronger economic recovery in Russia could also boost exports beyond the projected level. Steps to deepen European integration, including steps to complete the banking union within the European Monetary Union, could boost confidence. The decision of the United Kingdom to leave the European Union could boost return migration to Latvia. Possible low-probability shocks which would completely alter the economic outlook if they materialise include the intensification of geopolitical risks related to Russia (Table 2).
High structural unemployment raises the risk of poverty
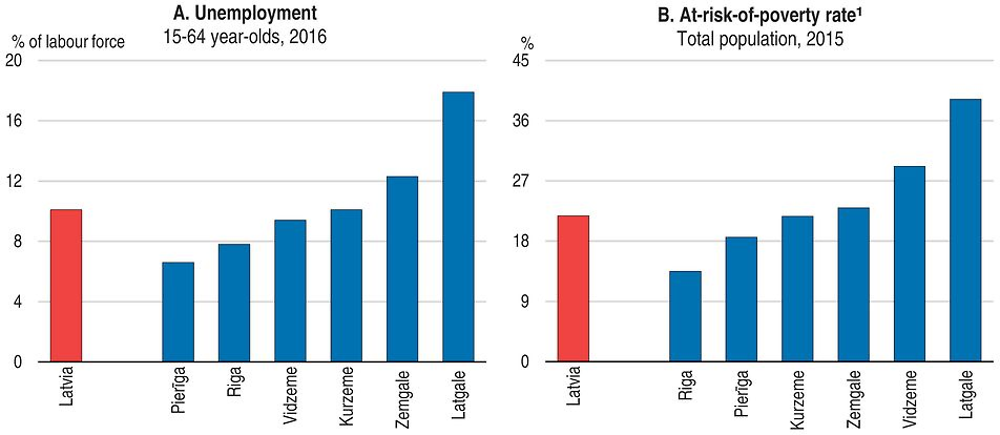
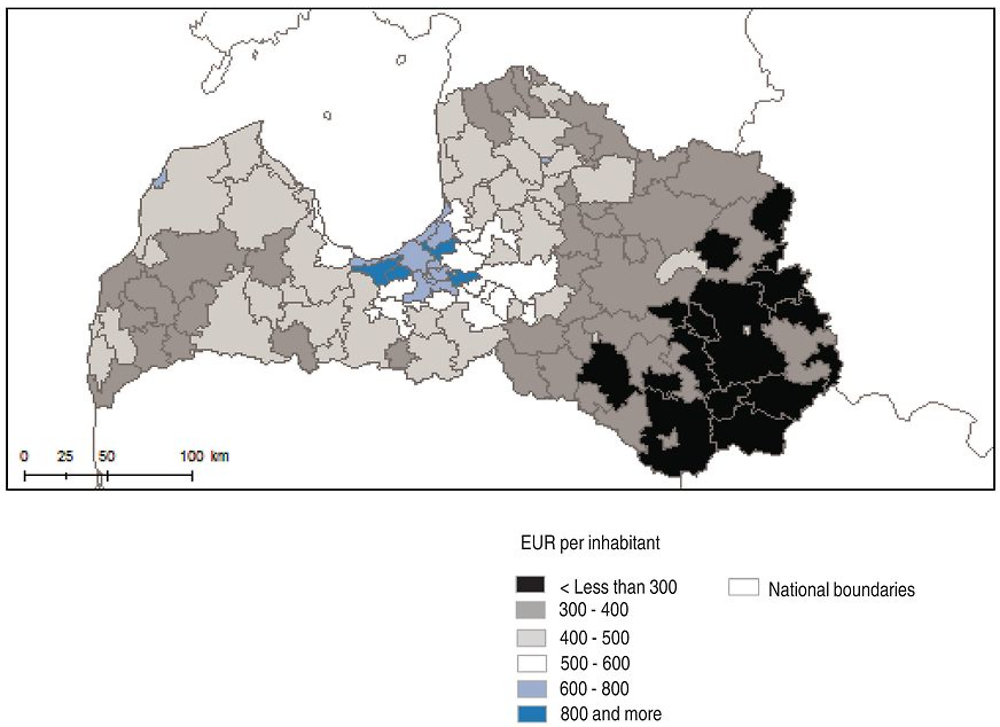
Big local differences in unemployment and vacancies contribute to high structural unemployment and poverty. Unemployment and poverty are much higher in the East of Latvia, particularly in the Latgale region, than in the Riga area (Pierriga and Riga, Figure 11). Seventy-two per cent of vacancies notified to the public employment service are in Riga. Forty-five per cent of the unemployed were unemployed for a year or longer in 2015, mostly in the Eastern rural areas. Unemployment benefits are reduced by a half after six months and expire after nine months. The large number of workers whose salaries are only partly declared to the tax authorities also reduces unemployment benefit entitlements in case of job loss. Income inequality is reflected in large local differences in personal income tax revenues (Figure 12).
1. Share of population with disposable income below 60% of median household income.
Source: Central Statistical Bureau of Latvia.
Source: OECD calculations based on RDIM (2017), Regional development indicators (www.raim.gov.lv).
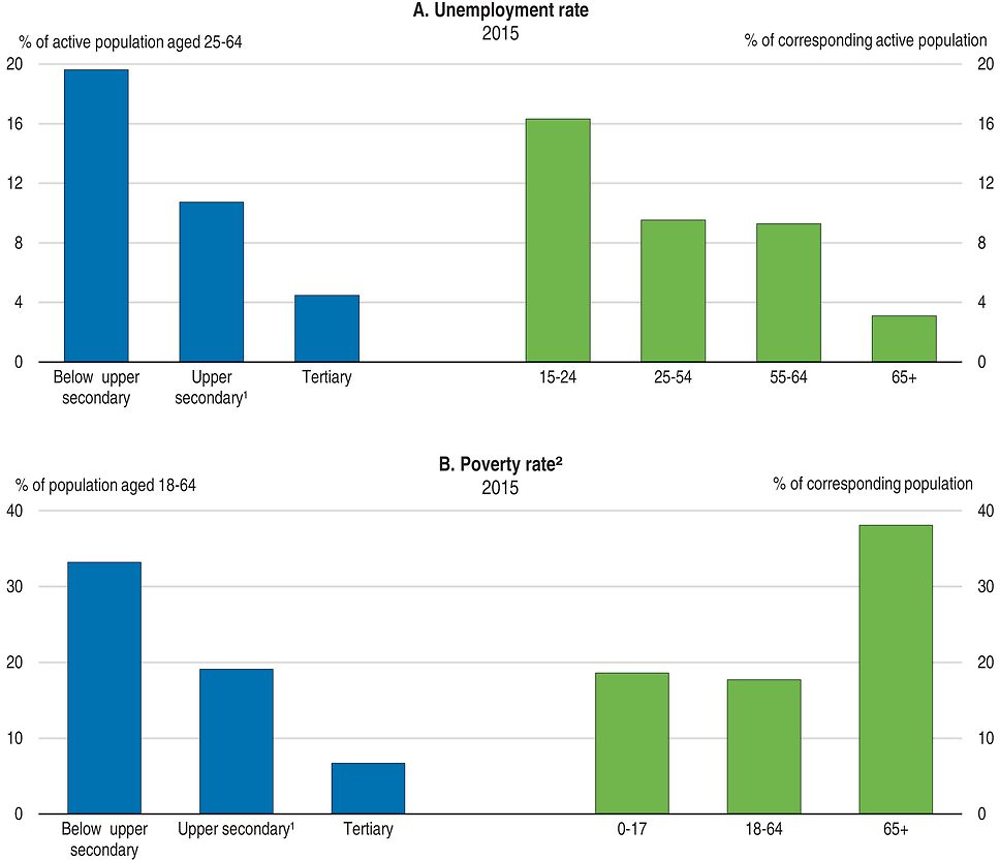
The unemployment rate is almost five times higher for workers with low education attainment than for those with high attainment (Figure 13, Panel A). Older workers who were educated in the Soviet era have faced rapid depreciation of their skills and struggle to keep up with new labour market demands. The unemployment rate of workers aged between 55 and 64 is close to 10%, among the highest in OECD countries. Apart from the long-term unemployed, workers with low educational attainment and Latvians aged 65 and over, mostly pensioners, face the highest risk of poverty (Panel B). The hourly earnings gap between men and women, which amounts to 17% of male hourly earnings, also contributes to inequality.
1. Includes post-secondary non-tertiary education.
2. Share of population with disposable income below 60% of median household income.
Source: OECD (2017), OECD Education Statistics (database), OECD Labour Force Statistics (database) and Central Statistical Bureau of Latvia.
Credit growth is subdued despite very supportive monetary policy
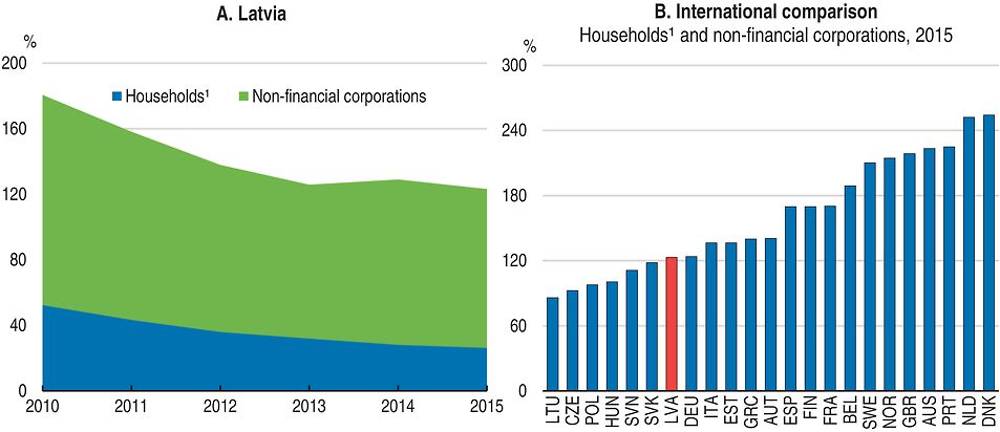
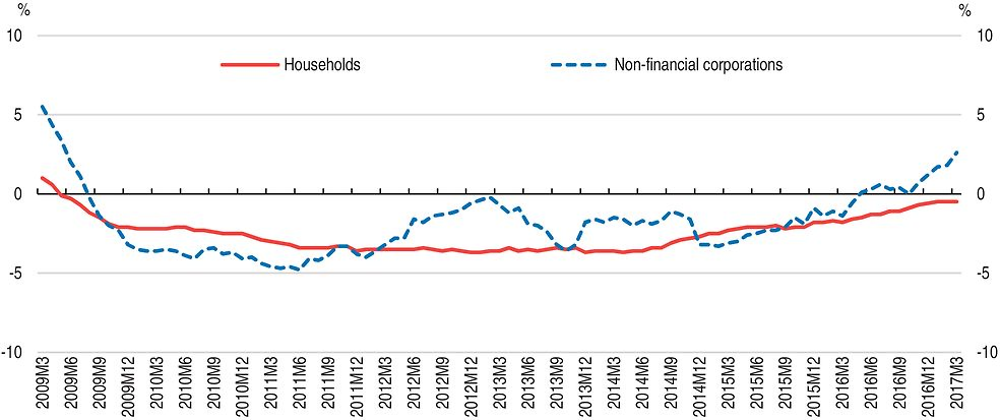
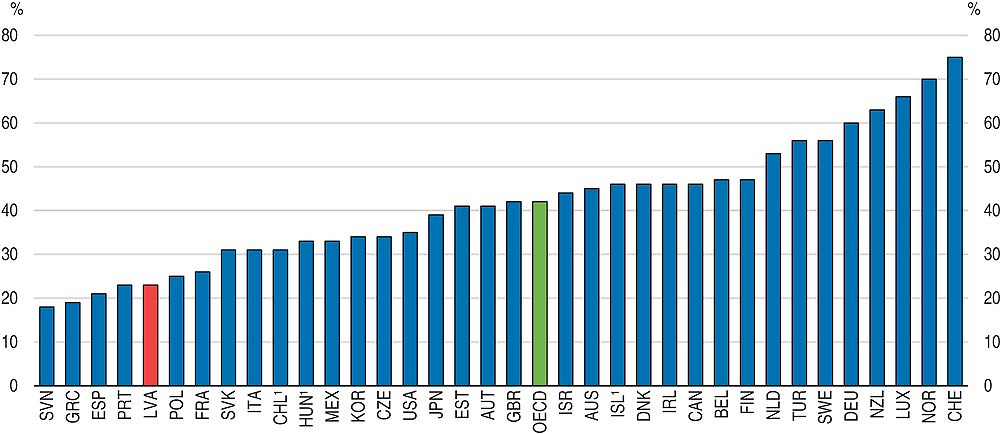
As elsewhere in the euro area, expansionary monetary policy has resulted in extremely low interest rates. Financial sector confidence is strong, as spreads vis-à-vis interest rates on German government debt have remained close to zero. Private sector indebtedness has fallen below levels in many OECD countries (Figure 14). Non-financial businesses deleveraged sharply in the aftermath of the crisis, as banks wrote off loans to non-viable firms and demand for loans was low. Nonetheless, lending to non-financial corporations has recovered only slowly while the decline of credit to households has levelled off (Figure 15). Bank lending surveys suggest that loan demand has increased, but banks have not eased their lending standards (Bank of Latvia, 2016a). Banks report that low equity, weak credit records of firms, a weak judiciary and informal economic activity prevent them from easing lending standards.
1. Includes non-profit institutions serving households.
Source: OECD (2017), OECD Economic Outlook: Statistics and Projections (database) and OECD National Accounts Statistics (database).
Note: Lending data are corrected to exclude one-off effects due to the withdrawal of credit institution's licences.
Source: Bank of Latvia.
Although firms depend mainly on bank lending, alternative financing platforms are growing. Internet-based loan issuance has increased strongly, and is among the most developed in Europe, although the share in overall lending is still very small (KPMG, 2016). Including internet lending in prudential regulation, as planned, could strengthen financial intermediation and contain risks. Another welcome step is the creation of the Baltic Market through the merger of the stock exchanges of the three Baltic countries, which may help improve the capacity for Latvian firms to raise equity.
Latvia’s banking sector is overall healthy and supervision is sound. Capital and liquidity ratios are comfortably above required levels (Table 3). The ratio of non-performing loans has fallen below the EU average and coverage of loan loss risk with provisioning is high. Profitability is strong. The three largest banks, of which two are owned by Scandinavian banks, are directly supervised by the ECB. Latvia benefits from the Single Resolution Mechanism (SRM), which provides an EU-wide framework for orderly resolution of large banks. The smaller Latvian banks are supervised by Latvia’s Financial and Capital Market Commission (FCMC). Macro-prudential policies are implemented by the FCMC, which consults with the Bank of Latvia, and the Ministry of Finance. They form the Macroprudential Council, an advisory body. It can issue non-binding recommendations on the principle of “comply or explain”.
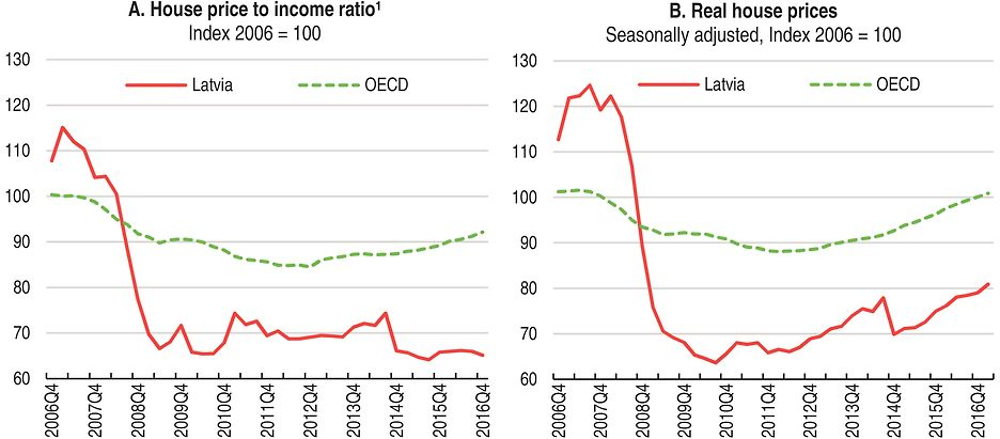
House prices in Latvia have been rising in recent years, but broadly in line with incomes (Figure 16). Housing demand has been bolstered by lower down-payments. Lending to households is nonetheless moderate, suggesting low financial sector risks on this front. Low incomes of many Latvian households and tighter lending standards since the crisis have barred low-income households from purchasing new housing, while the private rented housing market is underdeveloped. Therefore, despite lower house prices, for low-and middle-income households quality housing is still difficult to afford (see below). A government programme providing loan guarantees for housing mortgages for families with children helps to some extent, but by increasing housing demand may also result in higher prices.
1. The nominal house price is divided by the nominal disposable income per head.
Source: OECD (2017), OECD Analytical House Price Statistics (database).
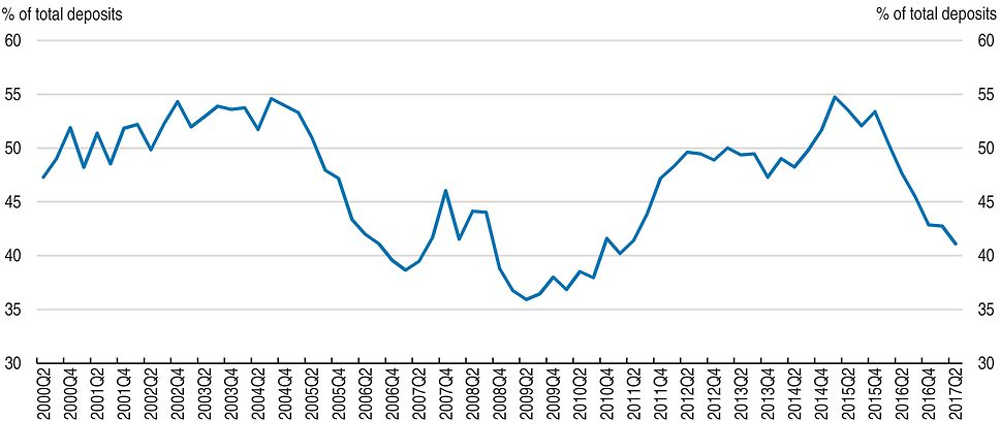
Foreign deposits at Latvian banks, mostly related to business links with Russia, amount to around 43% of total deposits end-2016. They have decreased since 2015 following the introduction of stricter anti-money laundering and counter-terrorism financing rules (Figure 17). These rules will be tightened further in 2017. Increasing uncertainty over geopolitical risks and weakening of CIS economies could trigger further withdrawals of foreign deposits. They could also weaken banks’ profitability, as banks offering foreign deposits have claims in CIS countries, and eventually some of them might need to downscale their business. However, these banks are subject to more demanding capital and liquidity requirements, and stress tests by the Bank of Latvia suggest that they can withstand large withdrawals.
Source: Financial and Capital Market Commission.
Fiscal policy to support pressing structural and social policy priorities
Latvia has a rigorous budgetary framework, underpinned by an independent fiscal council and transparent national fiscal rules defined in the Fiscal Discipline Law. The fiscal council performs regular monitoring of compliance with the requirements of the Fiscal Discipline Law and prepares an annual report which is submitted to the parliament together with the Medium-Term Budgetary Framework Draft Law. This institutional set-up should be an effective means of keeping public expenditure growth consistent with fiscal sustainability (Economic Survey of Latvia 2015, OECD, 2015a).
Latvia’s budget planning is subject to structural budget balance rules to comply with the European Union’s Stability and Growth Pact (SGP). The medium-term objective for the structural deficit consistent with the SGP is 1% of GDP. The government is making full use of allowed deviations on account of recent pension and healthcare reform, based on the SGP’s flexibility mechanism, until 2019. In addition, national rules limit the structural deficit to 0.5% of GDP. These are currently not binding because the national authorities have currently estimated a lower structural deficit. Rigorous commitment to fiscal rules has kept Latvia’s public debt near 40% of GDP, considerably lower than the limits set by the Fiscal Discipline Law (60%). Substantial reforms are ongoing to improve public sector efficiency (Table 4).
The long-term outlook is robust, as expected increases of ageing-related spending are modest, reflecting past reforms which reduced the generosity of government-paid pensions. However, poverty among pensioners is high and may rise as pension benefit replacement rates are projected to fall.
The fiscal stance is expected to be moderately expansionary in the near term. The 2017 budget foresees additional spending of 0.3% of GDP to improve access to health care. The government has also improved access to social assistance for families with children and has raised benefits for the third and subsequent children. Government investment is also expected to expand with the disbursement of new EU funds. These are welcome measures.
There is a case for making full use of available fiscal space under SGP rules, including the flexibility mechanisms to fund structural reforms, also beyond 2019. This could support policies which boost economic growth in an inclusive way. Assuming low nominal GDP growth of 3.5% per year, a deficit of 1.5% of GDP would keep the debt-to-GDP ratio broadly unchanged until 2030. Assuming higher nominal GDP growth of 4.5% per year, a sustained government deficit of 1.5% would allow government debt to fall below 40% (Figure 18). The current low-interest environment offers a near-term window of opportunity to invest in economic and social infrastructure which boosts inclusive growth without raising the debt-to-GDP ratio (OECD, 2016h). Current macroeconomic conditions are consistent with higher government spending, as inflation and lending growth remain low. Moreover, a chapter on public sector efficiency in the 2015 Economic Survey of Latvia (OECD, 2015a) has not identified scope for substantial spending cuts, as government expenditure in Latvia is low. While social spending is not targeted to the poorest, it is low and largely consists of pension and unemployment benefits, which are universal entitlements.
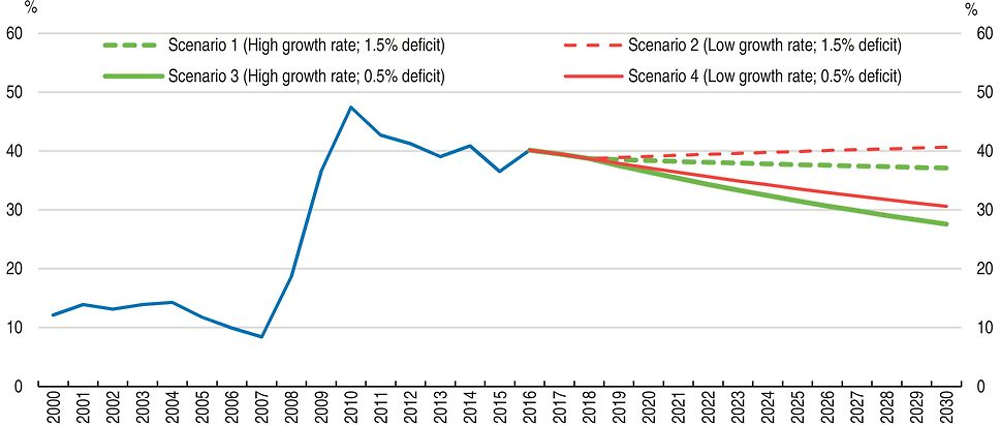
Note: GDP growth and government debt are assumed to follow the projections of Table 1 until 2018. Thereafter, nominal GDP is assumed to grow at 4.5% or 3.5%.
Source: Calculations based on OECD (2017), OECD Economic Outlook: Statistics and Projections (database).
The government plans to raise currently very-low level of means-tested social assistance benefits by 90%, to 20% of median income (94 euros per month for the first adult). On current plans municipalities would remain responsible for paying social assistance. The central government will support low income pensioners by increasing the minimum old-age pension commensurately. It will also raise pensions for pensioners with long insurance periods. Social assistance transfer spending is higher in poor municipalities while their tax revenues are lower. Therefore, higher social assistance payments may limit their capacity to fund other key social services for which they are responsible, such as childcare. Further progress in reducing informality is important to strengthen the effectiveness of the means-test, so as to ensure means-tested social assistance benefits are well-targeted to the poor.
A wide range of structural reform priorities is essential for boosting inclusive growth and these require more government funding. In particular out-of-pocket payments for health-care services should be reduced especially for the low-income population. Access to vocational education and training and to higher education as well as the funding of active labour market policies need to improve. Investment is also needed in road infrastructure. Policies are needed to make more low-cost rented housing available in areas which provide good access to jobs. This is discussed in more detail below.
Tax reform could make growth more inclusive and raise more revenues
Parliament has approved a reform of personal and corporate income tax in the framework of a broad tax reform. It reduces the basic personal income tax rate from 23% to 20% for incomes up to 20 000 euros per year starting in 2018. It also raises the corporate tax rate from 15 to 20%. However, non-distributed corporate tax income will be fully tax-exempt, effectively turning the tax into a tax on distributed profits, as in neighbouring Estonia. Lower personal income taxes reduce the taxation of labour, which is welcome. However, in view of high poverty, targeting these tax reductions to low-wage workers may be preferable.
The corporate tax reform could encourage investment by boosting retained earnings, which is the main source of finance for business investment. However the current corporate tax rate is already low and accelerated depreciation allowances are generous. The reform could also reduce administrative costs to some extent (Staehr, 2014). In Estonia firms have responded to the tax system largely by accumulating cash rather than investing in fixed assets (Hazak 2009). There may perhaps have been some positive investment and productivity effects on individual firms (Masso et al., 2013), but no benefits to macroeconomic performance can be shown (Staehr, 2014).
The government estimates the tax reform package to have a cost of 0.6% of GDP in the budget when it is fully implemented by 2020, which would make it harder to address key spending priorities to improve access to health care and education. However revenue risks from the corporate income tax reform could be substantially bigger.
Steps to eliminate exemptions from business taxation could strengthen revenues and avoid unwanted disincentives for firms to grow. The micro enterprise tax system exempts small eligible firms from income tax and social security contributions. They pay a low turnover tax instead. The scheme encourages firms to remain small or to keep part of their activity in the informal sector to benefit from low taxation and harms inclusiveness. Young start-up firms financed with venture capital pay a low lump sum tax per worker, which is regressive. The employees in these start-up firms are not covered by unemployment or pension insurance. These tax breaks should be abolished. Any tax support for start-ups should be limited in time, to reduce disincentives to grow, and ensure full coverage with social security. There are also generous tax credits and exemptions for special economic zones, mostly in the port areas. However, these are subject to competition from similar arrangements in other countries of the region.
The government has taken steps to lower labour taxes on low-income earners and raised excise and environmental taxes, as recommended in the 2014 Economic Survey of Latvia (OECD, 2014a, Table 5). This is welcome. Indeed, the labour tax wedge is high, although Figure 19 does not include most recent reductions. Reducing the high labour tax wedge on low income earners (Figure 19) further could have particularly large benefits for Latvia: it could reduce unemployment and undeclared employment and could damp emigration of young workers, whose wages tend to be low. Recent legislation has increased the basic income tax allowance for low-income households. This tax allowance now diminishes as income rises. The solidarity tax levied on high salaries also introduces some progressivity in the personal income tax system, which is welcome in view of high income inequality. But workers have to claim the basic allowance, and low-income workers may fail to do so. Besides, personal income tax reductions are less effective in reducing taxation of workers on the lowest salaries, as they typically pay no or little income tax. By contrast, social security contributions must be paid from the first euro. Therefore, reducing social security contributions for low wage workers would be particularly effective in promoting formal employment of these workers, and would increase the inclusiveness of the tax system. In Colombia, reducing payroll contributions also resulted in a substantial increase of formal jobs in the short-run (Bernal, Eslava and Meléndez, 2015; Medina and Morales, 2016). In Latvia’s notional defined contribution public pension system, pension payments are linked to contributions. Lower social security contributions should however not result in lower pension benefit entitlements, as pension income replacement rates are low. An alternative option would be the introduction of an earned income tax credit for low-income households.
Note: Labour taxes include personal income tax and employee plus employer social security contributions and any payroll tax less cash transfers.
Source: OECD (2017), OECD Tax Statistics (database).
The tax reform foresees setting tax rates on capital income received by households (such as interest income) at 20%, at the same rate as other household income. This is welcome as capital income received by households (such as interest income) is currently taxed at lower rates than other household income. Low taxes on such income tend to favour high-income households, making the tax system less inclusive. Yet an inclusive tax system is important in view of high income inequality. There is scope to raise taxation of energy and real estate, including through approximating cadastral valuation to current market values. However given the high home ownership, even among low-income households, this could be accompanied by the introduction of a tax-exemption up to a suitable value ceiling. There is also scope to continue raising taxes on alcohol and tobacco further.
Encouraging firms and workers to fully declare their economic activity
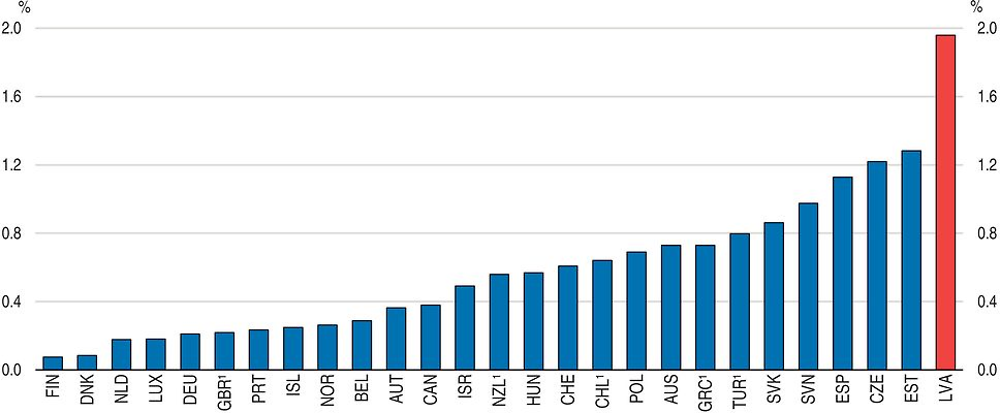
Informal activities remain widespread. While it is difficult to capture the exact size of the informal sector, in 2015 it was estimated to amount to more than 20% of GDP in (Figure 20). The government has made considerable effort to improve tax collection by intensifying tax audits on individuals and firms operating in sectors where informal activity is widespread; introducing criminal sanctions against employers paying undeclared wages; strengthening controls, resources and co-ordination among relevant authorities (tax authorities, labour inspectors and customs); and raising fines and increasing personal liability of company board members. These steps helped increase tax revenues, which are estimated to have reached 31% of GDP in 2016, up from 29% in 2015 (Figure 21).
To provide essential social services and lower the tax burden on low income earners the government is aiming to raise tax revenue further. It is planning to make better use of ICT for tax law enforcement which is welcome. It plans to require electronic record keeping cash registers. The government also plans to combat tax evasion in electronic commerce and to enable electronic exchange of information between credit institutions and the tax authorities.
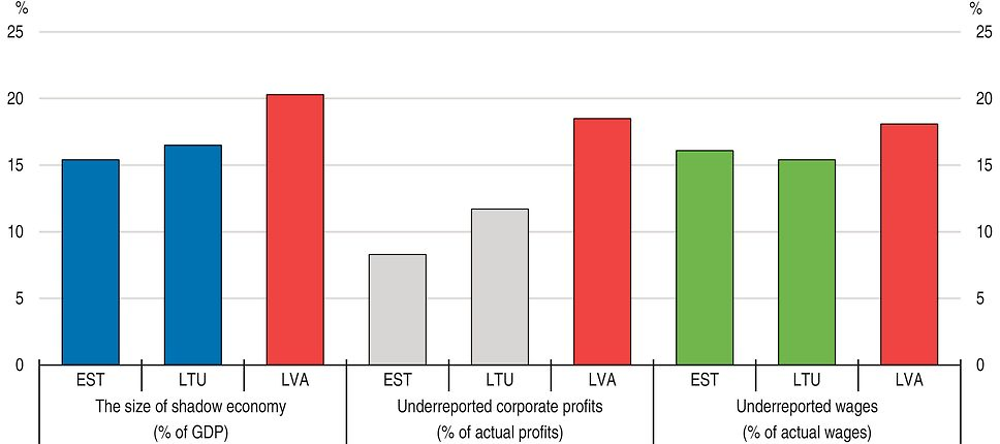
Note: The aggregate size of the informal economy is estimated from the firm-level information. Underreported corporate profits and wage payments by registered firms in the three Baltic countries are based on survey data.
Source: Putniņš, T. and A. Sauka (2017), “Shadow Economy Index for the Baltic Countries”, Stockholm School of Economics in Riga (SSE Riga).
Source: OECD (2017), OECD Economic Outlook: Statistics and Projections (database) and OECD National Accounts Statistics (database).
But more fundamental measures that strengthen the incentive for tax compliance by firms and workers are needed. Perceptions of weak governance undermine the willingness to pay tax. Surveys of company owners and managers shows that acceptance of informal activity is strongly related to their dissatisfaction with business legislation (Putnins and Sauka, 2016). In comparison with Estonia and Lithuania more Latvian businesses display lower trust in the government (Putnins and Sauka, 2016). Trust in public governance is also weak in the population at large (Figure 22). Greater trust in government helps improve tax morale (Daude et al., 2012). Torgler and Schneider (2007) show that better governance and more direct political participation possibilities for the population improve willingness to pay tax. Williams and Horodnic (2015) link the informal economy to low motivation to pay taxes and conclude that policies to reduce informality should focus on improving trust in government. This can be done by developing greater procedural justice, strengthening perceptions of impartial treatment of all citizens as well as broad and fair access to public services.
1. 2013 for Chile, Hungary and Iceland.
Trust refers to the percentage of respondents who answered “yes” to the question “Do you have confidence in national government” in the World Gallup Poll, 2014.
Source: OECD (2015), Government at a Glance 2015.
Reforms to improve public sector efficiency have included more steps to fight corruption of the Latvian Corruption Prevention and Combating Bureau (KNAB; Table 4 above). The KNAB’s core budget increased in 2016 and 2017. This shows the commitment of Latvia to fighting corruption and avoid political interference with the work of the KNAB. However, scope for further improvement remains, for example, by raising the budgetary independence. The budget of the KNAB continues to be proposed by the Council of Ministers and is approved by parliament annually, weakening independence. Full independence is important so KNAB is perceived to be able to investigate corruption within these institutions. As is the case for competition authorities, budgetary independence should be reinforced by mechanisms reducing government discretion, such as fixed multiannual budget allocations, the allocation of fixed revenue sources, for example fees or taxes, or a combination of these (OECD, 2016i).
Many judges are appointed by parliament, which may expose them to political influence. Stronger independence from political influence in the procedures to appoint judges could also improve perceptions of governance. It is welcome that legislation to strengthen the independence of judges is being considered by parliament. There is also scope to strengthen rules on the engagement of lobbyists in the legislative process (Council of Europe, 2016). Broadening access to key social services, notably health services, may also strengthen perceived fairness and thereby willingness to work in the formal economy (see below).
High operating costs reduce the pensions workers accrue in the second pillar pension system
Since 2001, all young workers taking up employment in Latvia are enrolled in the compulsory, second pillar (private) pension scheme, which complements the first pillar (public) pension scheme. Six per cent of workers’ salaries flow into a privately managed plan chosen by each worker. But high operating costs imposed by private investment managers, particularly costs from excessive marketing activities, considerably reduce risk-adjusted returns. Operating costs of private pension funds amounted to close to 2% in 2015 (Figure 23), although they were somewhat lower (1.6 %) for funds in the compulsory second pillar system. The high costs significantly reduce the capital workers accumulate in the fund over their working lifetime. With current contributions and risk-adjusted returns today's workers will have to lower their living standards considerably when retiring.
1. 2014 for Greece and New Zealand. 2013 for the United Kingdom. 2011 for Chile and Turkey.
Source: OECD (2017), OECD Pensions Statistics (database).
Empirical evidence suggests that marketing activities of fund managers with the purpose of attracting contributors to their funds has no benefit for workers (Hastings et al., 2013). Such activities raise costs as well as suppliers’ market power because they attach workers to pension funds for reasons unrelated to performance, especially low-wage contributors. Berstein and Micco (2003) show that, in oligopolistic market structures, pension funds have incentives to engage in marketing that reduces social welfare but generates costs, to raise profit margins. Proposals currently under discussion in Latvia are to lower the cap on the general fee from currently 1% and stricter requirements for performance-related higher charges. These steps would be welcome. To reduce costs and boost net returns in second pillar pension systems, Australia and Sweden, for example, have introduced a low-cost default-choice fund (OECD, 2013a; Tapia and Yermo, 2008), in which contributors invest unless they take a deliberate decision to invest elsewhere. Costs in these funds are kept low with passive investment strategies and by avoiding marketing expenses. In Sweden, such funds have proven to offer higher returns than managed funds.
Improving living standards requires boosting productivity and stronger integration in global value chains
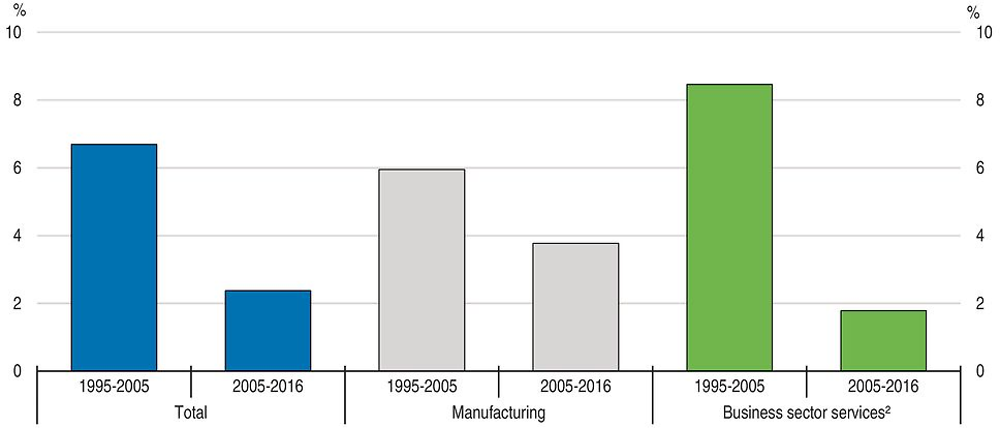
Latvia enjoyed strong productivity growth until the early 2000s. However, as in many OECD countries, productivity growth has slowed significantly in the past decade (Figure 24). Reinvigorating the productivity of Latvian firms is key for Latvia to continue to improve living standards.
← 1. Labour productivity growth is the change in gross value added per hour worked at constant prices.
2. Excludes real estate.
Source: OECD (2017), OECD Productivity Statistics (database).
As a small open economy, Latvia needs to be integrated into the global economy to boost productivity. International trade and foreign direct investment (FDI) channel knowledge from advanced economies (Coe et al., 2009; Alfaro, 2016). Imports of intermediate goods boost productivity by enabling firms to diversify production and upgrade quality (Amiti and Koning, 2007). Integration in global value chains (GVCs) intensifies such knowledge transfer and use of imported inputs and enables Latvia to further diversify its exports and to tap into world demand through GVCs. Indeed, entry to export market boosts significantly the productivity, employment and wages of Latvian firms (Figure 25; Benkovskis et al., 2017). For example, starting to export boosts labour productivity by more than 23% in the year of export entry. Employment and wages also increase by 21% and 8% respectively in the third year. These effects are particularly strong for firms that are likely to be participating in high value added activities within GVCs, such as exports of intermediate goods and knowledge intensive services (see Chapter 1).
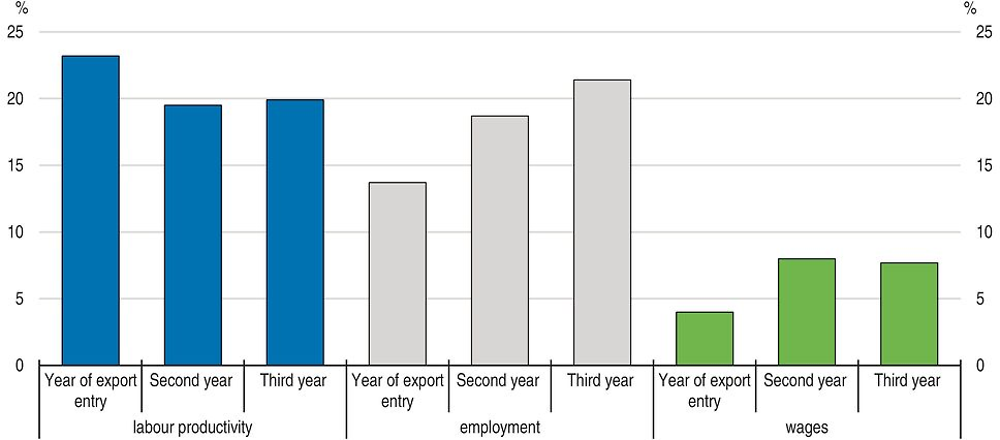
Note: The chart shows the differences in productivity, employment and wages between firms that started exporting and non-exporting firms. By comparing the export entrants with the subset of non-exporting firms that are initially as productive and large as the export entrants, these differences in performance can be interpreted as causal effect of export entry. See Box 2 of Chapter 1 for details.
Source: Benkovskis et al. (2017), “Export and productivity in Global Value Chain: Evidences from Latvian and Estonian firms”, OECD Economics Department Working Paper, forthcoming.
Only few Latvian firms export (6%, or 28 % of firms with more than 10 employees, in 2014) and an even lower share of firms participate in GVCs. Participation in GVCs requires upfront investment such as developing capabilities to comply with quality standards (OECD, 2013b; Henson and Humphrey, 2010). This acts as entry barrier for small and low productive firms. Policies that remove barriers to the reallocation of resources would help firms with high growth potential to attract the capital and labour they need to expand. They thus allow more firms to participate in GVCs and boost productivity. Indeed, productivity in Latvia could be up to 25% higher if capital, labour and other inputs were reallocated to more productive firms (Benkovskis, 2015). This could set off a virtuous cycle of improving export and productivity performance, as higher productivity also boosts firms’ export performance.
The large scale of informal activities also holds back productivity, as informal firms limit their size and use backward production technologies to avoid detection (Dabla Norris et al., 2007). Informality hampers efficient resource allocation by giving informal firms a cost advantage (Perry et al., 2007). Informal activities tend to be concentrated in low-skill jobs with low wages and with no integration in global value chains such as construction. Informal sector jobs are estimated to be on average 30% less productive than formal jobs in Latvia (Putnins and Sauka, 2016).
Foreign trade and FDI are weak
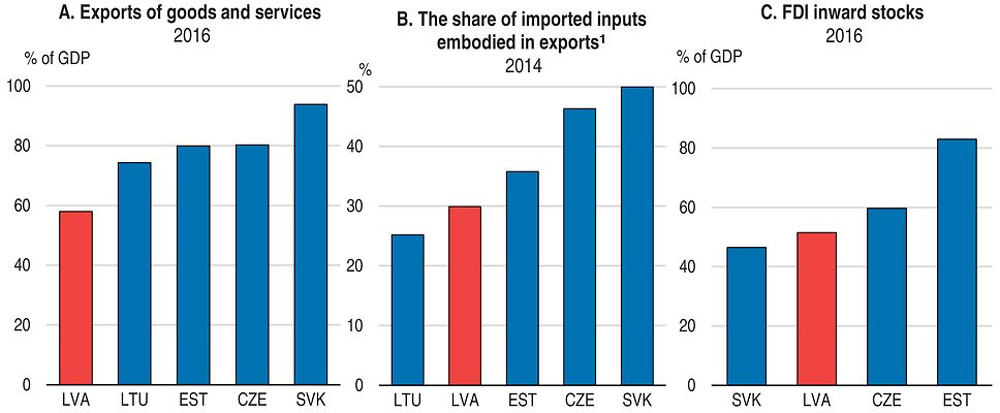
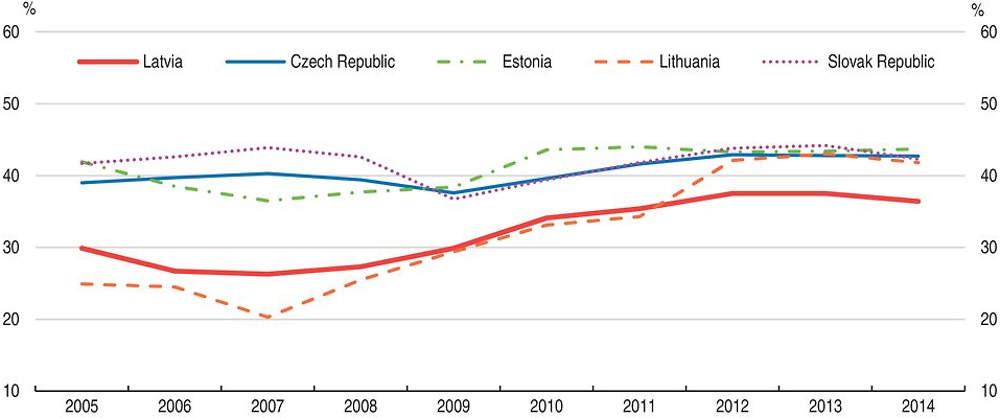
Latvia’s exposure to trade is lower than its peers’ (Figure 26, Panel A). Latvia also makes little use of imported intermediate inputs (Figure 26, Panel B). FDI in Latvia is also lower than in Estonia (Panel C). Participation in GVCs lags behind other Baltic and Central European countries (Figure 27). In 2014, less than 40% of domestic value added was generated from GVC participation, less than in Estonia, Lithuania and Central European countries.
1. OECD estimates based on the 2011 Inter-Country Input-Output (ICIO) table and the OECD Bilateral Trade Database by Industry and End-Use (BTDIxE).
Source: OECD (2017), OECD Economic Outlook: Statistics and Projections (database), Statistics on Trade in Value Added (database) and OECD International Direct Investment Statistics (database).
1. The data after 2011 are estimates based on the 2011 Inter-Country Input-Output (ICIO) table and the OECD Bilateral Trade Database by Industry and End-Use (BTDIxE).
Source: OECD calculations based on OECD/WTO (2016), Statistics on Trade in Value Added (database) and OECD (2016), OECD National Accounts Statistics (database).
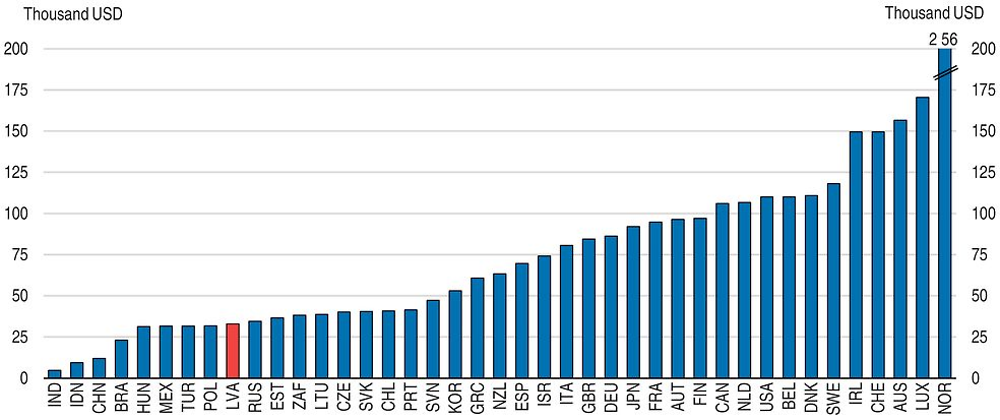
Almost one-third of Latvia’s employment is sustained by GVC participation (OECD, 2016b). However, the value-added per worker from GVC participation is low compared to advanced OECD economies (Figure 28). This is partly explained by knowledge intensity, as Latvia’s share of knowledge intensive services included in its exports is lower than that of Estonia or advanced OECD economies (Figure 29). In order to boost productivity and create more high-skilled jobs, Latvia needs to expand the scope of its participation in GVCs to more high value added activities such as new product development, manufacturing of technologically advanced components, as well as marketing, branding and after-sale services (OECD, 2013b). Facilitating broader access to such jobs to workers in low-income households will also make growth more socially inclusive.
Note: Value added embodied in foreign final demand per worker is computed by dividing the domestic value added captured from foreign final demand by the number of employment sustained by foreign final demand. Data are of 2011.
Source: OECD calculations based on OECD/WTO (2016), Statistics on Trade in Value Added (database) and OECD (2016), OECD National Accounts Statistics (database).
← 1. OECD estimates based on the 2011 Inter-Country Input-Output (ICIO) table and the OECD Bilateral Trade Database by Industry and End-Use (BTDIxE).
Source: OECD/WTO (2016), Statistics on Trade in Value Added (database)
Improving the supply of labour market relevant skills
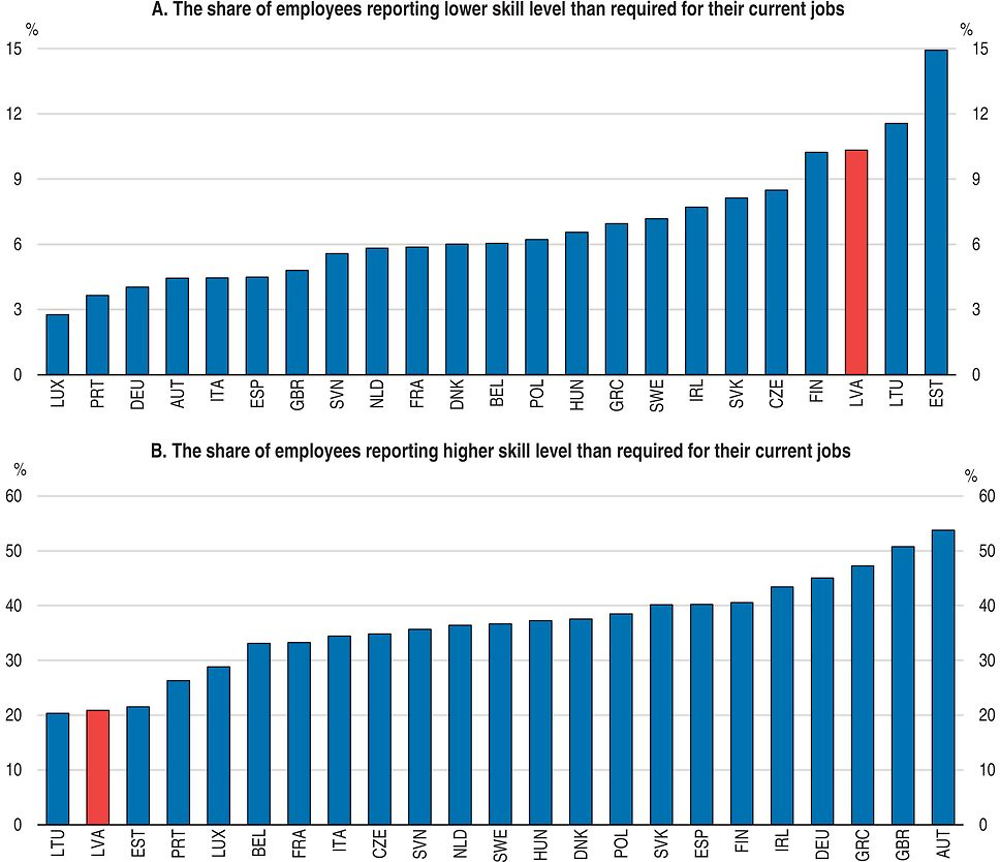
The shortage of relevant skills holds back Latvian firms’ adoption of advanced technologies or management practices. The misallocation of skills, often represented by a large presence of workers over or under-skilled for their jobs, constrains productivity growth by making it difficult for productive firms to hire more skilled workers (Adalet McGowan and Andrews, 2015). Around 11% of Latvian workers report being underskilled and 20% are overskilled. The share of workers in Latvia reporting that their skills were below the level required for their job is among the highest in European OECD countries (Figure 30, Panel A). By contrast over-skilling is low in international comparison (Panel B).
Source: CEDEFOP (2016), “Skills Panorama” (http://skillspanorama.cedefop.europa.eu).
Important reforms have improved the quality of vocational education and training (VET) (Table 6). The educational contents of VET have been upgraded. Education programmes which can be completed in separate modules have improved flexibility (OECD, 2015a, 2016c). Many VET students are likely to originate from low and middle-income families. In periods in which they are on workplace-placed training, they may receive a stipend from their employers. The stipend benefits from a tax-exemption (up to a ceiling). However, most students only receive 40-70 euros per month of means-tested income support, which is not sufficient as the sole income source for students (Baranovska et al., 2015). This makes it difficult for students from low income households to pursue VET. Also, students receiving support are no longer eligible for family allowances (Baranovska et al., 2015). Income support for VET students from low-income families should be scaled up to the level that allows students to focus on pursuing VET degrees and made compatible with the family allowance, which amounts to between 11 and 50 euros per month. The government envisages additional support for students at risk of early school leaving, funded by EU structural funds, which is welcome.
Substantial progress has been made to increase the effectiveness of active labour market policies (ALMPs) such as by profiling job seekers to determine programs according to their characteristics and by evaluation. Training programmes are designed by a committee involving social partners to respond to skill demands in the labour market. But participation in active labour market programmes (ALMPs) is low by international standards. Latvia spends only 0.2% of GDP on employment services and related ALMPs (Figure 31). Plans to improve access of the unemployed to the reformed modularised vocational education system are welcome.
← 1. 2014 for Estonia and New Zealand. 2011 for the United Kingdom.
2. Unweighted average of the data shown.
Source: OECD (2017), OECD Employment and Labour Market Statistics (database).
Recent reforms of universities have strengthened internal and external quality assurance and have linked funding to the result of quality assessments (OECD, 2016c). The quality assessments will incorporate indicators of labour market performance of graduates. However, few students receive income support through grants. They are mainly based on merit. Household income only plays a role when merit is the same. Some universities also offer their own grants for students from low-income families. This hampers access of students from disadvantaged socio-economic backgrounds despite the availability of free study places (OECD, 2016c; World Bank, 2014). The purely merit-based system should be modified to include means-tested income support to improve access to higher education for students from disadvantaged socio-economic backgrounds who are able enough to get a free study place.
Immigration of skilled individuals from abroad can ease skill shortages, help attract foreign direct investment and facilitate knowledge transfer. Latvia’s immigration policy lacks strategic focus on foreign skilled workers (OECD, 2016a). Foreign workers from outside the EU are not covered by public health insurance and must buy private health insurance, which tends to be more expensive. Latvian language proficiency requirements for many occupations which require communication with the public or government authorities also create barriers. Students from outside the EU who finish their studies in Latvia are subject to a labour market test and do not benefit from any fast track visa and residence permit procedures. Further wage tax reductions could also help retain young Latvians in the country.
Policies to remove barriers for women to access good job careers can also improve the supply of skills. The gender wage gap is particularly large for well-paid positions, pointing to poor utilisation of highly skilled female employment, and can for the most part not be explained by job or personal characteristics (Gaveika and Skrūzkalne, 2012). Shortages in the supply of formal early child care hold back the reconciliation of employment and family life (European Parliament, 2015). Steps to encourage women to study science, technology, engineering or mathematics (STEM), where free study places are abundant and labour market demand is strong, would reduce skill shortages and the gender gap in earnings (OECD, 2016c). Barriers to female entrepreneurship could also be identified and addressed. Another option, suggested by Turk et al. (2010), is to require firms to identify and address pay inequalities between men and women. Germany has recently taken steps in this direction.
Boosting co-operation in innovation, especially with foreign institutions
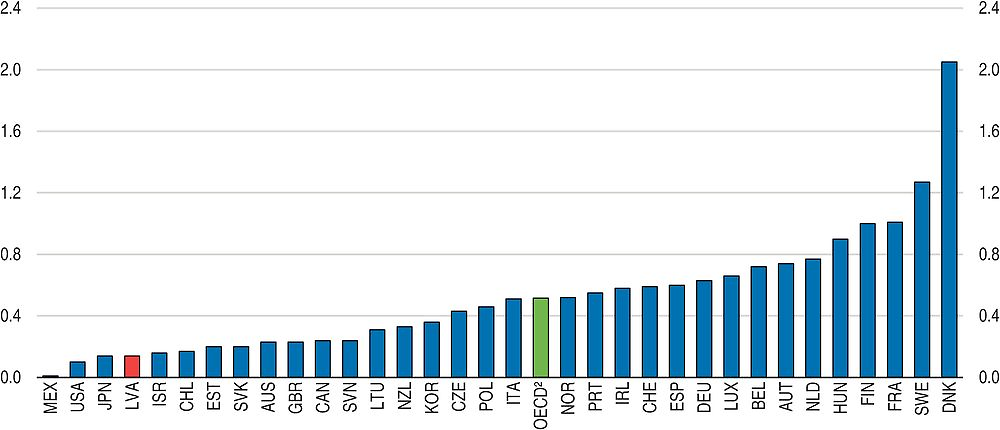
Innovation is the key driver of productivity growth and essential in capturing higher value added from GVC participation. In 2015, Latvia invested only 0.6% of GDP in research and development, among the lowest in the OECD countries (Figure 32). Business-driven research and development is particularly weak. Less than one-fifth of product and process innovations are completely new to the market (OECD, 2015b). However, several indicators of innovation performance such as the number of non-EU doctoral students in Latvia have improved most recently, allowing Latvia to exit the group of least performing EU countries (European Commission, 2016).
Source: OECD (2016), OECD Main Science and Technology Indicators (database).
One factor limiting the innovation performance of Latvian firms is the low co-operation between businesses and higher education and research institutions (CSB, 2016). Enhancing such collaboration would improve the ability of Latvian firms to identify and absorb best practices and latest technologies produced outside Latvia (Jesiļevska, 2016), but would require additional funding. Reform of higher education funding introduced in 2015 also provides incentives for universities to co-operate with businesses, which is welcome. Co‐operation with foreign firms and research institutions is particularly important but is rare. Stronger co-operation with foreign research institutions would facilitate the transfer of advanced technologies from advanced OECD economies and contributes to Latvia’s competitiveness in high value added activities within GVCs.
Latvia has taken several policy initiatives in order to boost innovation and co-operation, especially in areas defined in the Smart Specialisation Strategy. It includes the EU-funded Competence Centre support programme which aims to raise the competitiveness of Latvian firms by fostering co-operation between research institutions in developing new products, as well as the EU-funded Applied Research Grants programme, the Post-doctoral Research Grants programme and the support programme for the Modernisation of Higher Education and Research Infrastructure. Other measures such as the Cluster programmes and the Innovation Voucher scheme help firms, including SMEs, to access knowledge in research institutions and encourage local and international knowledge transfer. Steps have also been taken to stimulate mobility of workers between the business sector and the public sector. Many of these policies have been implemented only recently or are in the process of implementation. They are open to Latvian research institutions as well as foreign institutions. The government should evaluate these programmes and identify which ones are effective in promoting co-operation between businesses and research institutions, particularly international co-operation with foreign firms and research institutions.
Strengthening judicial and insolvency regimes to enhance resource allocation
Effective judicial processes that ensure contract enforcement and intellectual property rights support GVC participation by allowing firms to outsource complex, highly tailored tasks (Levchenko, 2007; Essaji and Fujiwara, 2012). A transparent and efficient insolvency regime facilitates lending to finance investment needed for GVC participation and higher value added activities (Manova and Yu, 2016). Effective insolvency also encourages firm creation and eases the exit of unproductive firms, thereby enhancing re-allocation of scarce resources such as skilled workers (Andrews and Adalet McGowan, 2016).
In terms of the time and costs of enforcing a contract, Latvia is almost as efficient as an average OECD country, but the debt recovery rate in Latvia is low (Figure 33). The government has been engaging in reforms of the judicial system, including the gradual consolidation of district courts, which will be completed in 2018. A large scale training program was launched in 2016 to improve the competency of personnel. These measures are likely to improve the judicial system and contract enforcement. The quality of judgement can be improved by specialisation of courts or judges, especially in insolvency cases. While Latvia does not have many unviable firms remaining in business, as banks wrote off loans to non-viable firms quickly following the economic and financial crisis, there are concerns about transparency and abuse in insolvency cases (FCIL, 2016), which likely reduce debt recovery. Specialised insolvency judges may be better equipped to reduce abuse. Steps were taken to strengthen the expertise and accountability of insolvency administrators. Legislation to strengthen the qualifications and tighten the supervision on administrators came into force in early 2017, which is welcome.
Note: The recovery rate is calculated based on the time, cost and outcomes of insolvency proceedings and is recorded as cents on the dollar recovered by secured creditors. The calculation takes into account whether the business emerges from the proceedings as a going concern or the assets are sold piecemeal. The costs of the proceedings are deducted. The value lost as a result of the time the money remains tied up in insolvency proceedings is also deducted. The recovery rate is the present value of the remaining proceeds.
Source: World Bank (2017), Doing Business 2016: Measuring Regulatory Quality and Efficiency (Resolving insolvency database).
Transport and energy infrastructure policies can improve openness and inclusive green growth
Survey evidence suggests that the quality of infrastructure still falls short of standards in other countries of the region, notably high-income countries (Figure 34), in particular in road transport (World Economic Forum, 2015; International Bank for Reconstruction and Development/World Bank, 2014). This is the case even though Latvia plays an important role as a transport hub for the Baltic region and has absorbed most of the structural funds it has received from the European Union.
Source: World Economic Forum, “The Global Competitiveness Report 2016-2017”.
Evaluation of transport infrastructure projects is uneven. When funding is provided by the EU, evaluation of large investment projects follows a standardised methodology which includes social cost-benefit analysis. When no EU funding is provided, the evaluation approach depends on the project and the state-owned company carrying it out. There are risks that state-owned enterprises subordinate policy priorities to operational priorities. State-owned enterprises may prioritise the survival of their business model, rather than the best investment projects. The same cost-benefit tests should therefore be applied to national projects as are applied to EU-funded projects. Planning should be based on lifetime costs. The development of a national transport model would allow having the best possible forecasts of future developments in transport.
Transport policies also need to address regional economic disparities within Latvia. Rural regions are experiencing a rapid decline in population and low population density makes it difficult to sustain adequate public transport services. The Latvian government already supports public transport, including bus services between towns, with subsidies of 0.3% of GDP per year. New mobility concepts may offer opportunities to provide services at a low cost and better suited to individual needs. ITF (2015) found that car-sharing and ride-sharing services can be suited to rural markets. Demand-responsive bus services have shown promising results, adjusting mobility services to the needs of the customer. In a number of countries local governments have brokered agreements to combine school bus services, postal delivery services, ambulance services. Evidence from Norway suggests that these can improve access to medical services and raise wellbeing among the young (Dotterud Leren and Skollerud, 2015). To enable this, policy makers must ensure that there are no barriers that would hamper the creation of these services. It is promising that the government is already working on developing these innovative public transport services.
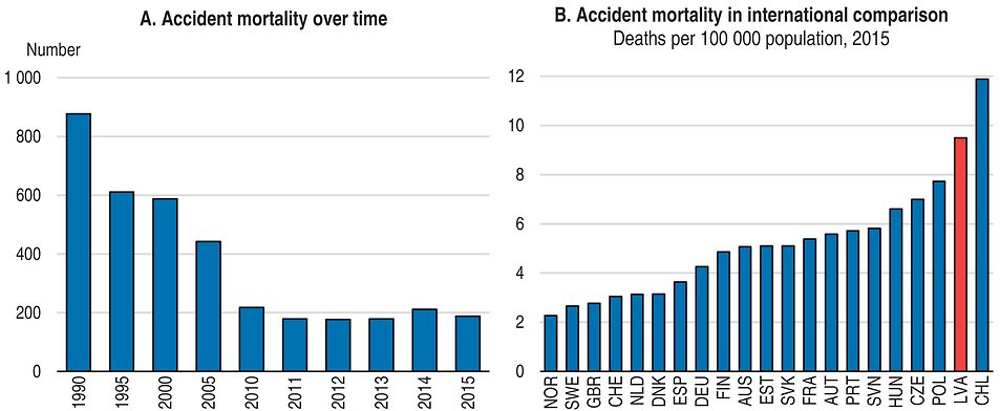
With 9.5 road deaths per 100 000 population per year, Latvia still has one of the highest road mortality rates in the EU or the OECD, although impressive progress has been made in reducing mortality since Latvian independence in 1991 (Figure 35). More priority needs to be given to investment in safer road infrastructure. For example, investments in motorway sections and to develop pedestrian friendly infrastructure in urban areas would boost road safety.
Latvia benefits from good wind resources, with large suitable offshore and onshore areas for wind energy development (EEA, 2009). While Latvia uses renewable energy sources extensively, thanks to hydropower and biomass, Latvia’s installed capacity of wind generation accounts for a small share of electricity generation. A feed-in tariff to promote renewable energy generation has been put on hold until 2020 due to concerns over cost (Dreblow, 2014). Several countries use competitive tenders or procurement auctions. Such tenders have resulted in record-low bids. The most recent example in Europe is Germany’s new Renewable Energy Act. Another interesting model is the “Contract for Difference” (CFD) for renewable energy recently introduced in the United Kingdom.
Source: International Transport Forum.
Making the most of the economic potential of Riga
The Riga metropolitan area is a key driver of economic growth and is a major regional transport hub. The city and its surrounding municipalities are home to more than half of the Latvian population and contribute 69% to national GDP. It boasts growth in knowledge-intensive services, low unemployment, and attractive natural assets (Chapter 2). More than 80% of Latvian enterprises in the ICT sector are located in Riga and high-tech sectors are growing strongly, albeit from a small base (Riga City Council, 2016). The network effects of metropolitan areas are key drivers of innovation (OECD, 2015c). Since 2010, Latvia’s population declined by 6%, whereas the population decline was only 3.6% in the metropolitan area. Riga has a high share of working population aged 30-45. The metropolitan area has an important role to play for retaining young adults and families in Latvia. Effective housing policies, as described below, can go a long way in making the most of this potential.
But Riga’s international competitiveness is lagging behind equivalent cities in the Baltic region. For example, GDP per capita is on average about 70% of that in other capital cities around the Baltic Sea (VASAB, 2016). Since 2010, the metropolitan Area of Riga performed less well than its peer cities in Estonia and Lithuania (Eurostat, 2016a, 2016b).
OECD experience shows that good metropolitan governance plays a critical role in improving economic growth, well-being and environmental outcomes (Ahrend et al., 2014; OECD, 2015c). Metropolitan governance arrangements result in higher labour productivity, and thus durably higher wages, less urban sprawl and pollution as well as more residents’ satisfaction with public transport. Governance mechanisms that match daily mobility patterns of the residents are essential.
The benefits of co-ordination across local governments within the metropolitan area of Riga are receiving increasing attention by Latvian municipalities. But no formal governance arrangements exist covering the entire metropolitan area. The “Riga Planning Region” provides a discussion platform for most municipalities in the area. However, it does not include all municipalities where most residents commute to Riga. Moreover, experience across OECD countries shows that better metropolitan governance can be built by extending participation beyond the local governments, to include the central government and major education and research institutions. The central government can provide financial incentives to identify and carry out metropolitan projects beyond the confines of individual municipalities and create reliable sources of metropolitan financing, for example, to better co-ordinate public transport. A long-term process for metropolitan monitoring and evaluation is also needed (OECD, 2015c). OECD evidence shows that such policies lower infrastructure costs. Denser cities also have substantially lower CO2 emissions, helping to achieve emission reduction targets (Ahrend et al., 2014; OECD, 2015c).
Improving access to housing and health care is key for more inclusive growth
Affordable housing in neighbourhoods which are well connected to employment opportunities is an important driver for inclusive development and labour mobility. This is especially true in Riga, where housing is relatively expensive, while unemployment is low and high-productivity sectors are expanding, offering good employment opportunities. Housing market policies shape residential mobility, which is positively correlated with worker reallocation (Caldera Sánchez and Andrews, 2011) and the efficiency of job matching (OECD, 2015d). Therefore, they help reduce unemployment in high-unemployment regions. Affordable housing is also important for supporting other wellbeing dimensions, such as health and educational outcomes. Despite substantial improvement over the past decade, life expectancy at birth remains the lowest among OECD countries. The gap in life expectancy by education background is substantially larger than in other OECD countries. The poor, less educated and unemployed are more likely to be in worse health or die prematurely than those in more favourable socioeconomic circumstances (OECD, 2016e).
Housing policy needs to improve access to economic opportunities
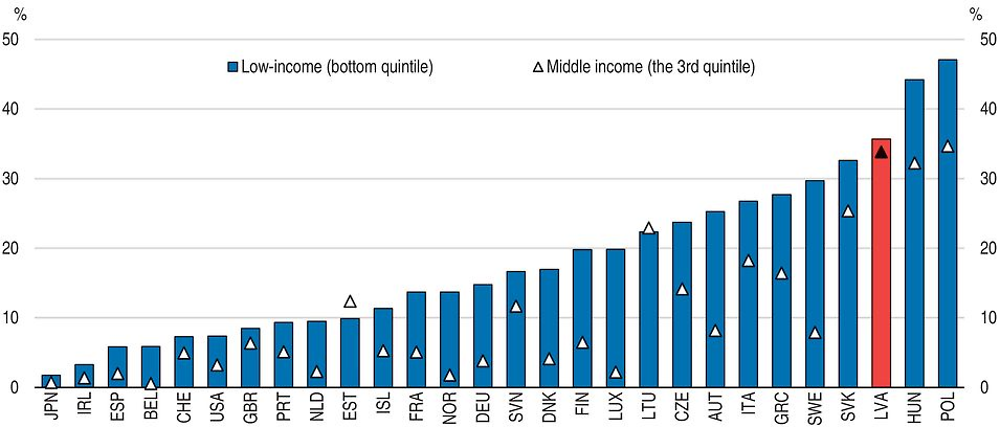
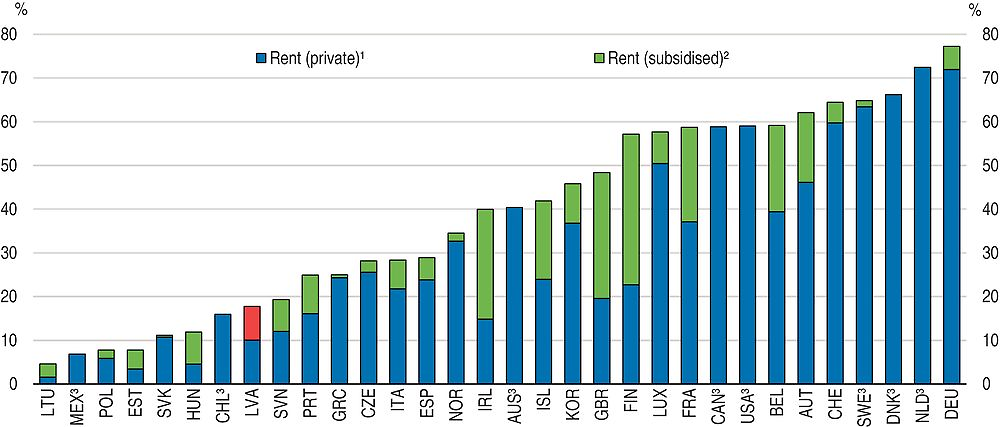
Overcrowded housing is widespread among low and middle-income households in Latvia (Figure 36). While population has declined markedly since independence, low income among many home owners has contributed to the high incidence of low-quality housing. Moreover, population trends are unequal within the country, resulting in markedly stronger demand for housing in economically dynamic areas with good employment opportunities. About 81% of the Latvian population live in the homes they own. Even among low-income households, few rent (Figure 37).
Source: OECD (2016), OECD Affordable Housing Database, Table HC2.1.3, December (www.oecd.org/social/affordable-housing-database.htm).
Note: Low-income households with income in the bottom quintile of the net income distribution. For Chile, Mexico, Korea and the United States, gross income is used due to data limitations.
1. Share of households renting their dwelling at market prices on the private rental market.
2. Share of households renting their dwelling at reduced market prices.
3. Data on tenants renting at private rental market prices include tenants renting at reduced prices for Australia, Canada, Chile, Denmark, Mexico, the Netherlands and the United States. For Sweden, data on tenants renting at reduced prices are not capturing the full extent of coverage due to data limitations.
Source: OECD (2016), OECD Affordable Housing Database, Table HM1.3.3, December (www.oecd.org/social/affordable-housing-database.htm).
There appears to be no commercial housing development aimed at the rental market. A stronger private rented housing sector would support the provision of affordable housing for households that do not have the financial means to purchase a home. It also encourages labour mobility. Higher home-ownership rates are associated with higher skill mismatch, and housing policies which impede residential mobility might amplify skill mismatch. Housing policies appear to be particularly relevant for young people since they have a naturally higher propensity to move (Caldera Sánchez and Andrews, 2011). In the Latvian context, good housing policies could also encourage young people to seek opportunities in Latvia rather than emigrate. Different housing demand and house price trends across regions in Latvia are likely to have reduced labour mobility, as home owners from high-unemployment areas are likely to find it difficult to afford buying housing in areas with good employment opportunities.
The government has introduced a mobility allowance for unemployed workers who take up a job at a distant location to help cover their commuting and moving costs. However, the allowance is available for a short period of time and is not available in Riga, where most jobs are located. Providing workers with subsidies to cover the costs of relocating can be a cost-effective way to enhance labour mobility. For instance, in Germany workers participating in a relocation subsidy programme are matched with higher paying and more stable jobs than non-participants (OECD, 2017c).
Low legal certainty appears to hold back the rental market. It appears to be difficult to conclude rental contracts such that the landlord and the tenant are confident that the contract complies with law (Kolomijceva, 2016; Hussar, 2016). Most court cases take more than 6 months (Kolomijceva, 2016). This may deter some owners to offer housing for rent, as they may not receive any rent payment for some time. Indeed, court decisions are always required, for example, to evict a tenant who does not pay rent. Indeed, weak protection of landlords’ property rights affects worker mobility and productivity negatively because of its negative impact on the rented housing market (OECD, 2015c). The government is therefore considering developing out-of-court procedures. By law, decisions to evict low-income tenants can be implemented only if social housing is available for them. This rule prevents social hardship, in view of widespread poverty and low social assistance entitlements. However, the supply of social housing is low, and waiting lists are long. Therefore, steps to increasing the supply of social housing could also help encourage private home owners to offer more housing for rent. Reducing tax evasion and fostering long-term lease contracts could also increase reliability of contracts and make rented housing more attractive for tenants (Hussar, 2016).
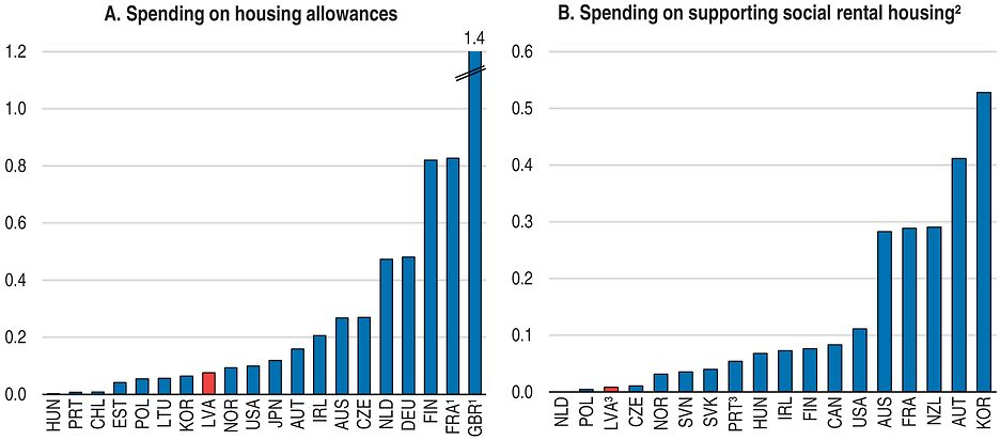
Government spending on social housing and on cash housing benefits for low-income households are among the lowest in the OECD (Figure 38). Support for low-income households to improve access to quality housing only cover a small share of the low and middle income population. Waiting lists for housing at subsidised rates are often long, especially in high demand areas as the Riga metropolitan area. Cash-benefits to help low-income households pay rent in the private market would not be effective for as long as the private rented housing market is not well-developed. In the near term, social housing should therefore be the preferred option to improve access to housing for low-income households. Housing policies are mostly designed at the national level and implemented at the local level. An eligible person can only apply for assistance in the municipality where she resides, limiting labour and residential mobility.
1. 2014-15 for the United Kingdom. 2014 for France.
2. Central government spending only, with the exception of Australia, Austria and Korea where funding at regional level is included.
3. 2013 for Latvia and 2012 for Portugal.
Source: OECD (2016), OECD Affordable Housing Database, December (www.oecd.org/social/affordable-housing-database.htm).
Investment in energy efficiency of residential buildings can, over time, reduce housing costs, make economic growth more environmentally sustainable and help meet long term greenhouse gas emissions targets. Indeed energy efficiency makes up the bulk of investment needs to limit global warming in line with the Paris agreement (IEA, 2016). Latvia has made much progress in reducing energy consumption for housing, using EU funds, but it remains high. Low wealth and lack of access to bank loans hold back investment. In some OECD countries, local governments have successfully stimulated renewable energy and energy efficiency retrofits by offering up to 100% upfront financing for these projects. Property owners then repay the loan over the long-term in form of an extra addition on their property tax (Wesoff, 2015). This however requires upfront government financing. Utility companies can also provide loans for energy-efficient appliances, and allow repayment to be made as part of the monthly electricity bill (Terry, 2016).
A nation-wide register that allowed eligible persons to apply for social housing where they expect better job opportunities could help support residential mobility. To ensure that places in social housing are allocated to the targeted population, incomes should be verified not only at the time of application, but also in regular time intervals following the rental agreement. Several OECD countries have also successfully expanded affordable housing by requiring private developers to allocate a proportion of the dwellings as affordable units (Salvi del Pero et al., 2016). The responsiveness of housing supply to demand is lower in countries where it takes longer to acquire a building permit (Andrews et al., 2011), and this increases skill mismatch and damps productivity (OECD, 2015d). It is therefore welcome that the Latvian government is planning to accelerate building permit procedures.
Low-income and rural households forego medical treatment
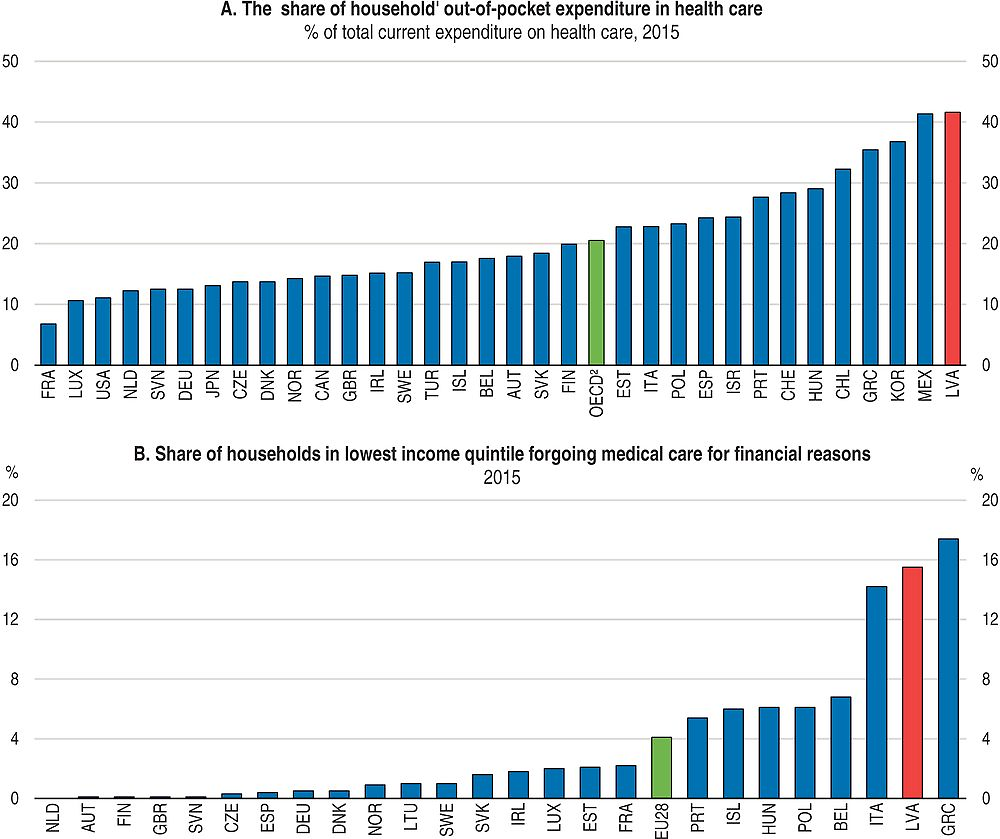
The National Health Service (NHS) is the single purchaser of publically funded personal health services. It provides universal coverage to the entire population and is financed through general taxation. However, public expenditure on health is very low, 3.3% of GDP in 2014. 41 per cent of total health care expenditure in 2014 was out-of-pocket spending, a share that is among the highest in OECD countries (Figure 39, Panel A). Patients must make substantial co-payments towards the cost of general practitioner visits, specialist visits, hospital stays and pharmaceuticals. For low-income households health care needs can result in a significant drop in the disposable income they can use for other expenditure (WHO, 2016; Ke, 2005). Fifteen per cent of the low income population in Latvia reported forgoing needed medical examination in 2014 for financial reasons, (Figure 39, Panel B). Recent OECD research shows that out-of-pocket payments are harmful to the cost-effectiveness of public health care spending in the long run, as they may reduce demand for early health care interventions which can prevent more expensive interventions later (de la Maisonneuve et al., 2016).
1. Includes non-profit institutions serving households.
2. Unweighted average of the data shown.
Source: OECD (2017), OECD Health Statistics (database) and Eurostat.
Exemptions from co-payment requirements only apply to the poorest households, with less than EUR 128 per person monthly income. Financial barriers to care for low-income households are also exacerbated toward the end of the year, when annual budgets for healthcare are exhausted and any demand for health services for the rest of the year may need to be paid out-of-pocket (OECD, 2016e). To improve access to care, Latvia recently reduced co-payments for daily inpatient charges in hospital from EUR 13.52 to EUR 10 per day and co-payments for inpatient surgical intervention from EUR 42 to EUR 31. These steps are welcome. Expanding exemptions from co-payments for a broader range of low-income households and eliminating end-of year rationing for key services should be a policy priority.
Access to care is particularly limited in rural areas. Challenges in rural areas relate to shortage of some health care professionals. Latvia could consider innovative solutions to reduce geographical barriers to accessing health care, for example making better use of existing health resources for rural populations. These can play a larger role in preventive care. Pharmacists, could take a greater role in managing chronic conditions and the role of nurses’ and physicians’ assistant could also be expanded (OECD, 2016e).
Improving efficiency of health care provision
The number of hospital beds declined from 8.8 to 5.7 per 1 000 population between 2000 and 2014. This is still higher than the OECD average and indicators of quality of care in hospitals give cause for concern. The recent introduction of diagnosis-related groups is a step in the right direction to promote a more efficient use of hospital resources (OECD, 2016f). However, hospitals do not have incentives to promote quality. The NHS could undertake more strategic contracting to incentivise quality and efficiency. It could for instance strengthen monitoring and evaluation of hospital activities, to selectively contract with better-performing hospitals to drive quality improvement. It is important to identify low-volume hospitals, which generally are not able to promote high quality care, and underperforming hospitals. Such a mapping of services has already started, which is welcome.
Despite the high quality of the Latvian health information infrastructure (OECD, 2016e), there are still important gaps in information on health care quality in primary and secondary care. In primary care, indicators do not reflect patients’ clinical outcomes. Worsening risk factors, including obesity and alcohol consumption, and low preventive screening rates signal a failure in preventive efforts at primary care level. In the area of hospital care, Latvia does not report several OECD health care quality indicators (OECD, 2017b). Provider-level data can generate several opportunities for improving both quality and efficiency. By gaining a better understanding of these variations in treatment outcomes, resources can be reallocated to best use. A core set of reliable quality and performance indicators should be made available at national, local and individual provider level to guide health policy, monitor progress, and benchmark performance of providers.
Environmental outcomes are good
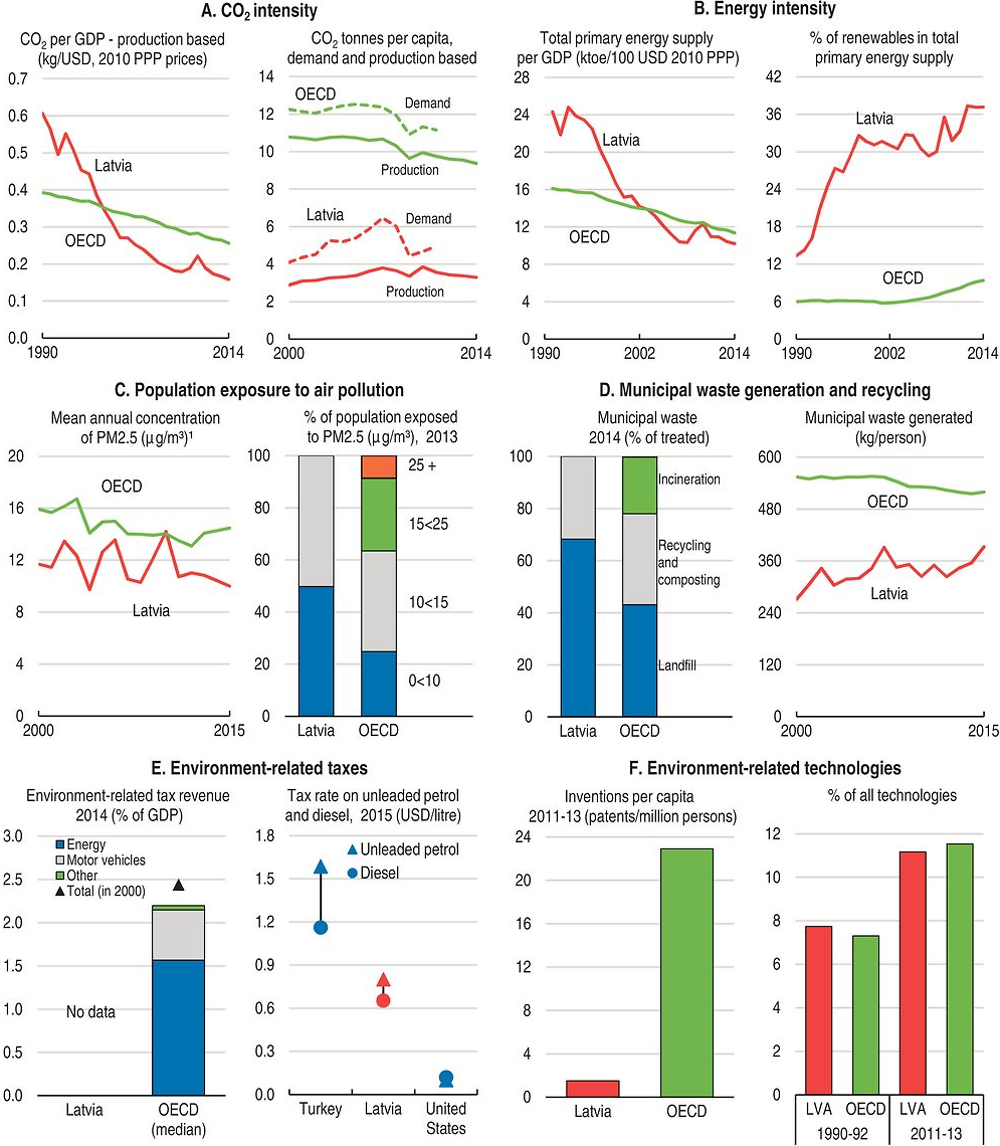
Latvia's energy intensity declined significantly during the 1990s (Figure 40). Per capita greenhouse gas (GHG) emissions are well below average, partly because of the contribution of renewable energy, which supplied around 40% of total primary energy supply in 2014, the absence of heavy industry, and relatively low incomes. As in many OECD countries, Latvia's imports embody more GHG emissions than domestic production, as the CO2 intensity of demand is higher than the CO2 intensity of production (Panel A) so its contribution to climate change through demand is greater than through domestic production. Both GHG intensity and energy intensity were declining through to about 2010, but the decline may have slowed since then.
The share of renewables in total energy supply increased enormously at the end of the last century as the use of wood for fuel, especially in households, grew. Air quality is very good with hotspots for particle pollution limited to occasional occurrences in the capital, Riga. Average exposure to particle pollution across the country has been stable for many years.
Municipal waste generation per capita has always been well below the average for the European Union (Eurostat, 2017a; Latvian data comparable to OECD data is not yet available); it was 40% below the EU average in 2010. But since then it has risen by over one fifth while the EU average continued to decline, even though a landfill tax was introduced in Latvia in 2002 and has been steadily increased. A further increase is planned by 2020. There are no facilities for waste incineration in Latvia. 27% were recycled or composted in 2015. The rest goes to landfill.
Eurostat data show relatively high environmental tax revenue, about 2.5% of GDP and nearly 10% of total government revenue. As in all countries, the bulk of this is energy tax revenue and transport-related taxes. The share of environmental inventions in total patents has risen substantially since the early 1990s, as in many countries, but the absolute level of environmental patenting is extremely low, in line with Latvia’s low overall level of R&D.
1. Data in 2014 are the average of 2013 and 2015.
Source: OECD (2017), Green Growth Indicators (database).
References
Ahrend, R., C. Gamper and A. Schumann (2014), “The OECD Metropolitan Governance Survey: A quantitative description of governance structures in large urban agglomerations”, OECD Regional Development Working Papers, Paris, https://doi.org/https://doi.org/10.1787/5jz43zldh08p-en.
Adalet McGowan, M. and D. Andrews (2015), “Labour Market Mismatch and Labour Productivity: Evidence from PIAAC Data”, OECD Economics Department Working Papers, No. 1209, OECD Publishing, Paris, https://doi.org/10.1787/5js1pzx1r2kb-en.
Adalet McGowan, M. and D. Andrews (2016), “Insolvency Regimes And Productivity Growth: A Framework For Analysis”, OECD Economics Department Working Papers, No. 1309, OECD Publishing, Paris, https://doi.org/10.1787/5jlv2jqhxgq6-en.
Alfaro, L. (2016) “Gains from Foreign Direct Investment: Macro and Micro Approaches”, World Bank Economic Review (2016) 1-14.
Amiti, M. and J. Konings (2007), “Trade Liberalization, Intermediate Inputs, and Productivity: Evidence from Indonesia”, American Economic Review, 97(5): 1611-1638.
Andrews, D., A. Caldera Sánchez and Å. Johansson (2011), “Housing Markets and Structural Policies in OECD Countries”, OECD Economics Department Working Papers, No. 836, OECD Publishing, Paris, https://doi.org/10.1787/5kgk8t2k9vf3-en.
Bank of Latvia (Latvijas Banka) (2016a), Euro area bank lending survey of September 2016: Main results for Latvia; available at www.bank.lv/en/publications-r/euro-area-bank-lending-survey.
Bank of Latvia (Latvijas Banka) (2016b), Financial Stability Report 2016, released 19.07.2016, available at www.bank.lv/en/publications-r/financial-stability-report.
Baranovska, I. et al. (2015), VET to work transition – Challenges and Opportunities, National Centre for Education, Riga.
Beņkovskis, K., S. Bērziņa and L. Zorgenfreija (2016), “Evaluation of Latvia’s re-exports using firm-level trade data”, Baltic Journal of Economics, 16:1, 1-20, DOI:10.1080/1406099X.2016.1163891.
Beņkovskis, K., J. Masso, O. Tkasevs, P. Vahter and N. Yashiro (2017), “Export and productivity in Global Value Chain: Evidences from Latvian and Estonian firms”, OECD Economics Department Working Paper, forthcoming.
Beņkovskis, K. (2015), “Misallocation of Resources in Latvia: ‘Did Anything Change During the Crisis?’”, Bank of Latvia Working Paper 5/2015.
Bernal, R., M. Eslava and M. Meléndez (2015), “Taxing where you should: Formal employment and corporate income vs payroll taxes in the Colombian 2012 Tax Reform”, mimeo.
Berstein, S. and A. Micco (2003), “Competition in a World with Markups and Sales Agents: The Chilean Pension Fund Industry”, Pensions Institute Discussion Paper 03-13.
Caldera Sánchez, A. and. D. Andrews (2011), “To Move or not to Move: What Drives Residential Mobility Rates in the OECD?”, OECD Economics Department Working Papers, No. 846 OECD Publishing, Paris.
Central Statistic Bureau (2016), Innovation in Latvia (in Latvian) www.csb.gov.lv/sites/default/files/nr_37_ inovacijas_latvija_16_00_lv.pdf.
Coe, D.T., E. Helpman and A.W. Hoffmaister (2009), “International R&D spillovers and institutions”, European Economic Review, Elsevier, Vol. 53(7), pp. 723-741, October.
Council of Europe (2016), “Corruption prevention in respect of members of parliament, judges and prosecutors”, Fourth evaluation round. Interim compliance report Latvia.
Dabla-Norris, E., M. Gradstein and G. Inchauste (2007), “What Causes Firms to Hide Output? The Determinants of Informality”, Journal of Development Economics.
Daude, C., H. Gutiérrez and A. Melguizo (2012), “What drives tax morale?” OECD Development Centre, Working Paper No. 315.
De la Maisonneuve, C., R. Moreno-Serra, F. Murtin and J. Oliveira Martins (2016), “The drivers of public health spending: Integrating policies and institutions”, OECD Economic Department Working Paper No. 1283, OECD Publishing, Paris.
Dotterud Leiren M. and K. Skollerud (2015), “Public Transport Services in Norway: Focus on Rural Areas”, ITF Discussion Paper 08-2015.
Dreblow, E.M. (2014), Assessment of climate change policies in the context of the European Semester – Country report: Latvia, Eclareon.
EEA (2009), “Europe’s onshore and offshore wind energy potential – an assessment of environmental and economic constraints”, European Environment Agency Technical Report No. 6/2009.
European Commission (2016), European Innovation Scoreboard 2017, http://ec.europa.eu/growth/industry/innovation/facts-figures/scoreboards_en.
European Parliament (2015), The Policy on Gender Equality in Latvia, In-depth analysis.
Eurostat (2016a), “Database: Gross domestic product (GDP) at current market prices by NUTS 3 regions”.
Eurostat (2016b), “Database: Gross domestic product (GDP) at current market prices by metropolitan regions”.
Essaji, A. and K. Fujiwara (2012), “Contracting institutions and product quality”, Journal of Comparative Economics ,40, 269-278.
FCIL (2016) FCIL Insolvency Abuse Report 2016, Foreign Investors Council in Latvia, Riga.
Fernández, C. and L. Villar (2016), “A taxonomy of Colombia´s informal labor market”, Working Paper No. 73 2016-11, Fedesarrollo, Bogotá, Colombia.
Gaveika, M. and K. Skrūzkalne (2012), “Gender wage gap in Latvia”, Stockholm School of Economics Riga Student Research Papers 2012: 6 (145).
Hastings, J.S., A. Hortaçsu and C. Syverson (2013), “Advertising and Competition in Privatized Social Security: The Case of Mexico”, NBER Working Paper No. 18881.
Hazak, A. (2009), “Companies’ financial decisions under the distributed profit taxation regime of Estonia”, Emerging Markets Finance and Trade, Vol. 45, No. 4, pp. 4-12.
Henson, S. and J. Humphrey (2010), “Understanding the Complexities of Private Standards in Global Agri-Food Chains as They Impact Developing Countries”, The Journal of Development Studies, 46:9, 1628-1646, DOI: 10.1080/00220381003706494.
Hussar, A. (2016), Tenancy Law and Housing Policy in Multi-level Europe Intra-team Comparison Report for Estonia, Latvia, Lithuania. Zentrum für europäische Rechtspolitik, University of Bremen, Germany.
International Bank for Reconstruction and Development/World Bank (2014), The Logistics Performance Index and Its Indicators,World Bank,Washington, DC.
International Energy Agency (IEA, 2016), World Energy Outlook, Paris, France.
ITF (International Transport Forum/OECD, 2015), Public Transport Provision in Rural Areas.
Jesiļevska, S. (2016) “Aspects of Statistics on Innovation in Latvia and Some Guidelines for Its Effective Use”, Economics and Business, 29 (1), 37-42, https://doi.org/10.1515/eb-2016-0019.
Ke, X. (2005), “Distribution of health payments and catastrophic expenditures, Methodology”, Discussion Paper, Number 2-2005, Health System Financing Department, WHO Geneva.
Kolomijceva, J. (2016), Tenancy Law and Housing Policy in Multi-level Europe National Report for LATVIA Zentrum für europäische Rechtspolitik, University of Bremen, Germany.
KPMG (2016), Alternative lending market trends in Continental Europe in 2016, November.
Levchenko, A.A. (2007), “Institutional Quality and International Trade”, Review of Economic Studies74 (3): 791-819, DOI: 10.1111/j.1467-937X.2007.00435.
Manova, K. and Z. Yu (2016), “How firms export: Processing vs. ordinary trade with financial frictions”, Journal of International Economics 100 (2016), pp. 120-137.
Masso, J., J. Meriküll and P. Vahter (2013), “Shift from gross profit taxation to distributed profit taxation: Are there effects on firms?”, Journal of Comparative Economics, Vol. 41, No. 4, pp. 1092-1105.
Medina, C. and L. Morales (2016), “Assessing the effect of payroll taxes on formal employment: The case of the 2012 Tax reform in Colombia”, Borradores de economía No. 971/2016.
NREL (2010), Property-Assessed Clean Energy (PACE) Financing of Renewables and Efficiency, retrieved from NREL, www.nrel.gov/docs/fy10osti/47097.pdf.
OECD (2013a), Pensions at a Glance 2013: OECD and G20 Indicators, OECD Publishing, Paris.
OECD (2013b), Interconnected Economies: Benefiting from Global Value Chains, OECD Publishing, Paris,https://doi.org/10.1787/9789264189560-en.
OECD (2015a), OECD Economic Surveys: Latvia 2015, OECD Publishing, Paris, https://doi.org/10.1787/9789264228467-en.
OECD (2015b), OECD Science, Technology and Industry Scoreboard 2015: Innovation for growth and society, OECD Publishing, Paris, https://doi.org/10.1787/sti_scoreboard-2015-en.
OECD (2015c), The Metropolitan Century: Understanding Urbanisation and Its Consequences, OECD Publishing, Paris, https://doi.org/10.1787/9789264228733-en.
OECD (2015d), The Future of Productivity,OECD Publishing, Paris.
OECD (2016a), OECD Reviews of Labour Market and Social Policies: Latvia 2016, OECD Publishing, Paris, https://doi.org/10.1787/9789264250505-en.
OECD (2016b), “Global Value Chains and Trade in Value-Added: An Initial Assessment of the Impact on Jobs and Productivity”, OECD Trade Policy Papers, No. 190, OECD Publishing, Paris, https://doi.org/10.1787/5jlvc7sb5s8w-en.
OECD (2016c), Education in Latvia, OECD Publishing, Paris, https://doi.org/10.1787/9789264250628-en.
OECD (2016d), OECD Science, Technology and Innovation Outlook 2016, OECD Publishing, Paris, https://doi.org/10.1787/sti_in_outlook-2016-enOECD.
OECD (2016e), OECD Reviews of Health Systems: Latvia 2016, OECD Publishing, Paris, https://doi.org/10.1787/9789264262782-en.
OECD (2016f), Better Ways to Pay for Health Care, OECD Health Policy Studies, OECD Publishing, Paris, https://doi.org/10.1787/9789264258211-en.
OECD (2016g), Economic Outlook 99, OECD Publishing, Paris.
OECD (2016h), Economic Outlook 100, OECD Publishing, Paris.
OECD (2016i), Independence of competition authorities – from designs to practices, OECD Publishing, Paris.
OECD (2017a), Going for Growth 2017, OECD Publishing, Paris.
OECD (2017b), Tackling Wasteful Spending on Health, OECD Publishing, Paris, https://doi.org/10.1787/9789264266414-en.
OECD (2017c), Economic Outlook June 2017, OECD Publishing, Paris.
Perry, G., W. Maloney, O. Arias, P. Fajnzylber, A. Mason and J. Saavedra-Chanduvi (2007), “Informality: Exit and Exclusion”, World Bank, Washington.
Putnins, T. and A. Sauka (2016), Shadow Economy Determinants and Impact Assessment in Latvia, Lithuania and Estonia, OECD Publishing, Paris.
Riga City Council (2016), “The economic profile of Riga 2016”.
Tapia, W. and J. Yermo (2008), “Fees in Individual Account Pension Systems: A Cross-Country Comparison”, OECDWorking Papers on Insurance and Private Pensions, No. 27, OECD Publishing, Paris.
Terry, R.G. (2016), On-bill Financing Case Study of Projects, retrieved from Consortium for Building Energy Innovation, http://cbei.psu.edu/wp-content/uploads/2016/07/On-bill-Financing-Case-Study-of-Projects.pdf.
Turk, P., L. Kraut, S. Anspal and E. Kallaste (2010), “Gender Pay Gap in Estonia: Policy Recommendations”, mimeo.
Salvi del Pero, A., A. Willem, V. Ferraro and V. Frey (2016), “Policies to promote access to good-quality affordable housing in OECD countries”, OECD Social, Employment and Migration Working Papers, OECD Publishing, Paris, https://doi.org/10.1787/5jm3p5gl4djd-en.
Staehr, K. (2014), “Corporate Income Taxation in Estonia. Is It Time to Abandon Dividend Taxation?”, TUTECON Research Brief No. RB-2014/1.
Torgler, B., F. Schneider and J. Kepler (2007), “Shadow Economy, Tax Morale, Governance and Institutional Quality, A Panel Analysis”, IZA Discussion Paper No. 2563, January 2007.
VASAB (2016), “Development of Cities in the Baltic Sea Region”.
Wesoff, E. (2015), White House Announcement Means ‘Today Is a Very Big Day for PACE’, retrieved from Green Tech Media, www.greentechmedia.com/articles/read/White-House-Announcement-Means-Today-is-a-Very-Big-Day-For-PACE.
WHO (2016), WHO notes on health financing policy in Latvia: Opportunities and challenges in light of international experience. WHO Barcelona Office for Health Systems Strenghtening Division of Health Systems and Public Health, WHO/Europe.
Williams, C.C. and I.A. Horodnic (2015), “Explaining and tackling the shadow economy in Estonia, Latvia and Lithuania: A tax morale approach”, Baltic Journal of Economics Vol. 15, No. 2, pp. 81-98.
World Bank (2014), Assessment of Current Funding Model’s “Strategic Fit” with Higher Education Policy Objectives, World Bank Reimbursable Advisory Service on Higher Education Financing in Latvia, World Bank, http://viaa.gov.lv/files/news/24067/lv_r2_strategic_fit_18april_vfinal.pdf.
World Economic Forum (2015), The Global Competitiveness Report 2015-2016, World Economic Forum, Geneva.