Chapter 1. Overview of the OECD-FAO Agricultural Outlook 2016-20251
This chapter provides an overview of the latest set of quantitative medium-term projections for global and national agricultural markets. The projections cover production, consumption, stocks, trade and prices for 25 agricultural products for the period 2016 to 2025. The chapter starts with a description of the state of agricultural markets in 2015 and explains the main macroeconomic and policy assumptions underlying the projections. In the next sections, consumption and production trends are examined, with a focus on regional developments. The chapter also reviews trade patterns showing the relative concentration of exports and dispersion of imports across countries for different commodities. The chapter concludes with global agricultural price projections, which include a stochastic analysis to illustrate how uncertainty about the macroeconomic environment and yield levels might affect price projections. Growing demand for agricultural commodities is projected to be matched by efficiency gains in production which will keep real agricultural prices relatively flat.
The setting: Year-over-year prices of crops and livestock at lower levels in 2015
Whereas 2014 witnessed a divergence in crop and livestock markets with decreasing crop prices and increasing livestock prices, prices for both crops and livestock fell in marketing year 2015 (see the glossary for a definition of marketing year). Production of most crops declined in 2015 compared to the exceptionally high output levels in 2014. However, this fall in output could not halt the decline in crop prices which was fuelled by lower demand and high inventories. Livestock prices came down from their historic highs in 2014 following weaker demand growth and lower feed grain prices. Dairy prices continued their decline that started during 2014 amid reduced import demand and higher output. An increased supply within certain fishery species combined with lower consumer demand in key markets led to generally declining fish prices.
The main factors depressing agricultural prices in 2015 were continued strong supply combined with weak economic growth and abundant stocks. Global commodity market conditions as well as macro-economic and policy developments will influence agricultural price trends in the medium term. A short overview of the current market conditions for each commodity is presented below, while Box 1.1 describes in detail the main macro-economic and policy assumptions that are adopted in the baseline projections. Growth prospects in industrialised economies are expected to average about 2% p.a., while those for major emerging economies range from India at about 7.5% p.a. to only 1.2% p.a. in the Russian Federation. Developing and least developed countries’ growth prospects are generally expected in the 5-7% p.a. range. Developing countries will continue to drive population growth; however global population growth is projected to slow to 1% p.a. over the next decade. Inflation in OECD countries and the People’s Republic of China (hereafter “China”) will remain low, but is projected to be quite high in several emerging economies (Argentina, Brazil, and South Africa) due to the impact of sizeable currency depreciations. The oil price is projected to increase from USD 39.3 per barrel in 2016 to USD 83.2 per barrel in 2025, and will underpin rising nominal prices for agricultural commodities.
The baseline projections in the Outlook reflect specific assumptions regarding the factors that influence supply, demand, trade and prices. These assumptions include stable macro-economic and weather conditions. In the last section of the chapter, the sensitivity of the price projections to these assumptions is examined. This complementary analysis provides an indication of the range of possible outcomes around the baseline, given the variability of yields and macro-economic conditions, including GDP growth, oil prices, and exchange rate fluctuations.
This edition of the Outlook includes for the first time a disaggregation of coarse grains into maize and other coarse grains, the disaggregation of oilseeds into soybean and other oilseeds, the decomposition of aquaculture production into the main groups of species, and the development of a new specification that provides projections for consumer prices.
Current market conditions
Following the record harvests of 2014, production of wheat, maize, rice and other coarse grains declined in 2015. Despite this fall in production, international prices of all cereals remained under downward pressure due to large global inventories and slower demand growth. Prices of wheat dropped to their lowest levels since 2009, with global stocks reaching their highest level since that year.
Whereas soybean production increased in 2015, the production of other oilseeds (rapeseed, sunflower seed, and groundnuts) was lower than in 2014. Vegetable oil production slowed relative to oilseed production because of a decline in palm oil production caused by El Niño in South East Asia and because of the increasing share of soybeans in the global oilseeds markets. The demand for vegetable oil weakened due to a reduction in biofuel production in Indonesia. Prices for protein meal also declined relative to prices of coarse grains and other feed ingredients.
Even though sugar production in Brazil and other smaller producers increased, global sugar production decreased in 2015, following lower production in Europe and several key Asian countries. The price of sugar remained low due to a combination of huge stocks, weak economic growth and, low oil and crop prices.
In 2015, weak demand growth for meat combined with production responses to lower feed costs exerted downward pressure on prices, which fell to levels last witnessed in 2010. Weakening import demand from the Russian Federation and reduced supply from North America restrained world trade volumes. Production growth was largely driven by developing economies dominated by Brazil and China, which are the largest meat producers in the developing region. The increase in meat consumption was mainly driven by poultry, which accounted for two thirds of the additional meat consumed.
Lower import demand in China and growing production in the European Union, the United States and Oceania were the main drivers of lower dairy prices in 2015. The removal of the EU milk quota in April 2015 allowed milk production to increase, but the supply response has been uneven across member countries. The ongoing Russian Federation’s import ban continues to affect butter and cheese exports from the European Union, the United States and Australia.
Developing countries dominated a sustained growth in fish consumption and production in 2015. Aquaculture remains the main motor behind the expansion in global fish supply. Economic contraction and exchange rate fluctuations in key players caused a decline in trade of fish and fishery products in value terms. Price evolutions varied between the different species and markets, but in general prices of wild species are stronger than those of farmed seafood.
Weak crude oil and feedstock prices in 2015 led to decreasing ethanol and biodiesel prices. Demand for biofuels continues to be highly influenced by domestic policies in conjunction with sustained fuel demand across the world.
Cotton production in almost all major producing countries fell considerably during the first half of 2015, leading to a drop of 9% in global production. The unexpected sharp decline was a result of adverse weather, lower global market demand and policy uncertainty. In response to the plunge in production, global stocks – which had reached record levels in 2014 – were released in major producing countries, notably China where the gap between the prices of domestic and imported cotton has narrowed in response to the elimination of minimum support prices in 2014. As a consequence cotton trade declined further.
The main assumptions underlying the baseline projection
The Outlook is a base scenario that is considered plausible given a range of conditioning assumptions. These assumptions present a specific macro-economic, policy, and demographic environment which underpins the projections for the evolution of demand and supply for agricultural and fish products. This environment is described below.
Slowing global economic activity
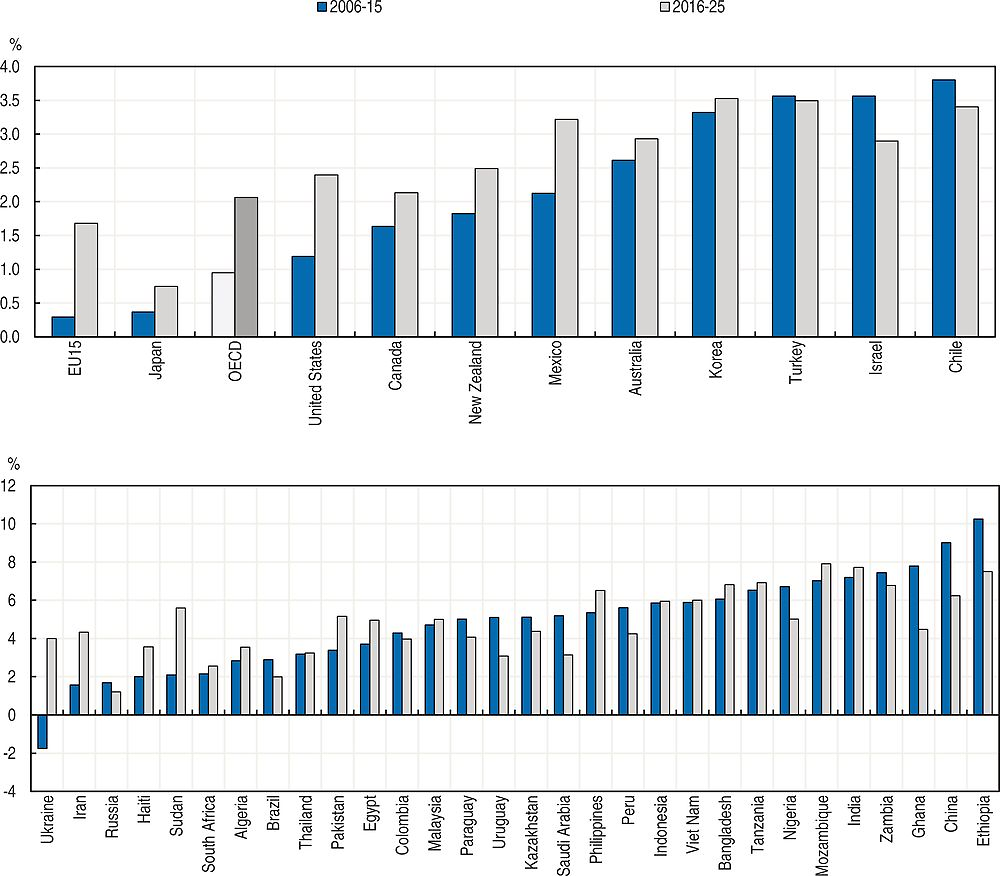
Global growth continues to underperform expectations and in 2015 eased to around 3%, well below its long-run average. This largely reflects further weakness in emerging market economies (EMEs). Deep recessions have emerged in Brazil and the Russian Federation, while the ongoing slowdown in the People’s Republic of China (hereafter “China”), and the associated weakness of commodity prices has hit activities in key trading markets and commodity exporting economies. Increased financial market uncertainty and the slowdown of global trade growth, especially in EMEs, are other headwinds to global activity.
Growth in the OECD economies as a group remained consistent in 2015 at around 2%, although growth slowed for some countries, including Australia, Canada, Korea and New Zealand. On the other hand, growth in Chile, Mexico, Turkey, Japan, and EU15 members as a group improved in 2015. The United States and Israel maintained the same level of growth in 2015 as in 2014.
The macro-economic assumptions used in the Agricultural Outlook are based on the OECD Economic Outlook (November 2015) and the International Monetary Fund’s, World Economic Outlook (October 2015).
Relative to 2015, growth is expected to pick up slightly in advanced economies, but to decline in emerging market and developing economies. Supportive macro-economic policies, lower commodity prices and a further steady improvement in labour market outcomes should continue to support the recovery in the advanced economies, with GDP growth projected to average 2.1% per annum (p.a.) until the end of the projection period for the OECD countries as a group.
Among OECD countries, Korea and Turkey are expected to be the growth leaders over the next ten years, with average annual rates of 3.5%, followed by Mexico at 3.2%. The recovery is expected to continue in the United States, supported by lower energy prices, reduced public deficits, and an improving housing market. Medium-term growth in the United States is expected to remain relatively solid at an annual rate of 2.4% over the next ten years. The moderate recovery in the euro area is projected to continue in 2016, sustained by lower oil prices, monetary easing (reflecting subdued inflation), and depreciation of the euro. The outlook is for an annual average growth rate of 1.7% for EU15 members as a group during the projection period.
Growth prospects are likely to continue to diverge in the large EMEs. A gradual slowdown is projected to continue in China, with GDP growth easing to 6.2% p.a. over the next ten years compared to an annual average growth rate of 9.0% during the last decade. Growth prospects in India should remain relatively robust at 7.6% p.a., provided further progress is made in implementing structural reforms. Despite large currency depreciations, recovery will be only gradual in Brazil and the Russian Federation, occurring as of 2017 and averaging 2% p.a. and 1.2% p.a. respectively until the end of the projection period.
Growth prospects for developing economies are still expected to remain strong. Most developing countries are expected to achieve marginally lower growth than in the previous decade. Bangladesh and the Philippines are expected to have the leading growth in Asia, averaging 6.6% p.a. and 6.3% p.a. respectively. Growth in Sub-Saharan Africa is anticipated to slow to about 4.7% p.a. under lower commodity prices. Underpinned by improvement in macro-economic stability and sectoral reforms supporting private investment, Ethiopia and Mozambique are expected to have the strongest growth over the coming decade, growing respectively at rates of 7.2% p.a. and 7.6% p.a., while Tanzania should maintain an annual average growth of 6.7%. Countries in North Africa and the Middle East are expected to grow 3.5% p.a., down considerably from the 5.3% p.a. average of the past decade. Latin America is set to keep growing at similar rate as in the last decade, with an annual average growth rate of 3% during the projection period, somewhat slower than the averages for Asia and Sub-Saharan Africa.
Measures of income growth are assumed to apply across the entire population and influence the demand for various food products, but in reality economic growth may not be spread so equitably and consumers at the low end of the income distribution may not see a corresponding increase in their incomes. Furthermore, while many developing and least developed economics are growing strongly, they do so from a very low base and the absolute increase in incomes remains quite small. These factors explain why, despite long periods of strong growth, food consumption patterns have changed relatively slowly.
Source: OECD/FAO (2016), “OECD-FAO Agricultural Outlook”, OECD Agriculture statistics (database), https://doi.org/10.1787/agr-data-en.
Slowdown in population growth
World population growth is expected to slow to 1% p.a. over the next decade. Population growth is still driven by developing countries, particularly Africa which is expected to exhibit the fastest growth rate at 2.5% p.a.; some countries of Africa will witness population growth in excess of 3.5% p.a. The Asia and Pacific region will account for nearly half of the world’s population, and India, with an additional 151 million people by 2025, should overtake China as the most populous country.
Among the OECD countries, the Japanese population is expected to decrease by 3.7 million during the next ten years and the population of the Russian Federation will also decrease by 2.3 million. The population of the European Union is expected to remain stagnant, growing at a rate of 0.08% p.a.; Australia has the highest projected population growth among OECD countries at 1.18% p.a., followed by Mexico at 1.10% p.a.
Inflation
Inflation remains weak in the OECD area and in China, but has picked up in several other EMEs, particularly those where large currency depreciations have occurred. Inflation is close to zero in Japan, the United States and the European Union, but is projected to rise in 2016 and thereafter. Inflation in these countries, however, is generally expected to remain below central bank targets.
Consumer price inflation should remain relatively low in China and India, helped by a weak import price pressure. Among other major EMEs, inflation is projected to remain strong for several years to come in countries such as Argentina, Brazil, the Russian Federation, and South Africa due to the impact of significant currency depreciations, and the domestic effect of sanctions in the case of the Russian Federation.
Recent currency movements have been unusually large
In nominal terms, the euro depreciated by 19% during the last three years relative to the US dollar and by 25% relative to the Japanese yen. Large exchange rate changes have also occurred for a number of emerging market and developing economies. Weakening commodity prices are reflected in the sizable currency depreciation experienced by many commodity exporters with flexible exchange rate regimes. But large exchange rate movements have not been limited to commodity-exporting emerging markets as currencies of EMEs more generally have seen sharp depreciations.
Argentina’s peso re-entered the international currency market in December 2015, leading to an immediate and large depreciation.
Nominal exchange rates for the period 2016-25 are mostly driven by the inflation differential in relation to the United States (with small changes in real terms). Given the expected inflation differentials, currencies will appreciate in nominal terms relative to the US dollar over the next ten years in Japan, Canada, Korea, the Euro area, China, and the Russian Federation. Conversely, a very strong depreciation of Argentina’s, Brazil’s, India’s, South Africa’s and Turkey’s currencies is projected over the next decade.
Collapse of energy prices
Oil prices have dropped sharply since mid-2014, driven by a slowing demand and record increases in supplies, particularly shale oil from North America, as well as the decision by the Organization of Petroleum Exporting Countries (OPEC) to leave its production target unchanged.
World oil price assumptions to 2014 are obtained from the short-term update of the OECD Economic Outlook N°98 (November 2015). For 2015, the annual average daily spot price is used, while the average daily spot price for December 2015 is used as the oil price value for the year 2016. Oil prices during the projection period are expected to grow at rates projected by the World Energy Outlook (IEA, November 2015).
Prices remain lower for much of the early part of the projection period, until the market rebalances at higher price levels via higher demand and lower growth in supply. In nominal terms, oil prices are expected to increase over the outlook period at an average annual rate of 8.3%, from USD 39.3 per barrel in 2016 to USD 83.2 per barrel by 2025.
Policy considerations
Policies play an important role in agricultural, biofuel and fisheries markets, with policy reforms often changing the structure of markets. This Outlook assumes that policies will remain as they are throughout the projection period. In the case of bilateral trade agreements, only ratified agreements are incorporated. For example, the ratification process of the Trans-Pacific Partnership (TPP) is ongoing; consequently the TPP is not incorporated into this Outlook. The Russian Federation’s ban on imports from specific origins was announced as a temporary measure that would remain in place until 2017 and is incorporated as such in the Outlook.
The new Sustainable Development Goals (SDGs) include a significant number of interconnected objectives related to agriculture and food. SDG 2 focuses explicitly on food by seeking to “end hunger, achieve food security and improved nutrition and promote sustainable agriculture”, but multiple other goals relate to challenges in the food system. SDG 1 focuses on poverty reduction, where agriculture and food have a key role to play. Sustainable agriculture plays a central role in achieving SDG 6 on water, SDG 12 on sustainable consumption and production, SDG 13 on climate change adaptation and mitigation and, SDG 15 on land use and ecosystems. Some of the principal linkages between agriculture and the SDGs are summarised in Box 1.2. The current baseline, which assumes that current policies remain in place, does not incorporate the effects of policy efforts to address these goals. However, there is an examination of the implications of the 2015 baseline projections for hunger, as captured by the FAO’s undernourishment indicator, and hence for progress towards SDG 2.
On 1 January 2016, the United Nations’ 17 Sustainable Development Goals took effect, launching the countdown towards the achievement of 169 targets by 2030, and even by 2020, in some cases. Many of these ambitious targets are deeply significant for agriculture.
Of foremost importance is the second Goal, End hunger, achieve food security and improved nutrition and promote sustainable agriculture, which features targets on hunger, malnutrition, productivity and incomes, sustainability and resilience, biodiversity, investment, trade and commodity markets. In view of the close connections which exist between hunger, malnutrition, agricultural productivity and poverty worldwide, however, the first Goal, End poverty in all its forms everywhere, is also highly relevant. While food security has many facets, the majority of the world’s hungry are chronically hungry, and they are chronically hungry because they are poor. Given that 78% of the world’s poor are heavily dependent on agriculture not only for their food, but also for their livelihoods, agricultural development, including the growth of agricultural productivity and incomes, represents one of the most powerful tools that exists to end extreme poverty and feed 9 bln people by 2050 (World Bank, 2015).
Beyond the first two Goals, the majority of the SDGs, listed below, are either directly or indirectly relevant for agriculture. Together, these supplement and reinforce the message previously put forward by the UN Millennium Development Goals, namely that business as usual practices cannot continue.
Abbreviated goal titles and relevance for agriculture*
1 No poverty: Includes targets for the eradication of extreme poverty (incomes of less than USD 1.25 a day) and at least 50% reduction of poverty by 2030. Reference is also made to ownership and control over land and natural resources. This target is relevant for agriculture given its importance for poverty reduction in many developing countries in particular.
2 Zero hunger: Numerous relevant targets, including the ending of hunger and malnutrition; the doubling of agricultural productivity and incomes of small-scale food producers; the correction of international trade restrictions; increased investment in agricultural research, extension services and technology; and the implementation of sustainable food production systems and practices by 2030.
3 Good health and well-being: Includes the reduction of deaths and illnesses from hazardous chemicals and air, water and soil pollution and contamination. Relevant for agro-chemical and manure use.
4 Quality education: Relevant for agricultural training and extension, both of which can enable farmers to adopt environmentally sustainable farming practices and improve competitiveness.
5 Gender equality: Includes the eradication of gender discrimination, including in land ownership. Bridging the yield gap which currently exists between male and female farmers in developing countries could increase total agricultural output of these countries by 2.5-4%, thereby reducing global hunger by 12-17%.1
6 Clean water and sanitation: Relevant for water use efficiency of agricultural production, the improvement of water quality via the reduction of pollution, and the protection of water-related ecosystems. Farming accounts for around 70% of water used worldwide and contributes to water pollution from excess nutrients, pesticides and other pollutants.
7 Affordable and clean energy: Includes targets for the substantial increase of renewable energy and doubling of the improvement in global energy efficiency by 2030. Relevant for agricultural energy use efficiency and bioenergy production.
8 Decent work and economic growth: Features relevant targets for sustainable per capita economic growth, improvement of resource use efficiency, and access to financial services and insurance.
9 Industry, innovation and infrastructure: Agriculture-relevant targets include the development of sustainable and resilient infrastructure, increased SME access to financial services and their integration into value chains, and the encouragement of innovation.
10 Reduced inequalities: Targets include the achievement, by 2030, of the sustainable income growth of the bottom 40% of the population at a higher rate than the national average. Relevant for reasons mentioned under Goal 1.
12 Responsible production and consumption: Includes the reduction of food losses and waste, efficient use of natural resources, environmentally-sound management of chemicals and waste, the reduction of fossil-fuel subsidies, and the ten-year framework on sustainable production and consumption.
13 Climate action: Targets strengthened resilience to climate-related hazards and the joint mobilisation of USD 100 bln annually by 2020 to facilitate climate change mitigation by developing countries. Climate change is highly relevant for agriculture, both impacting and being impacted by it.
14 Life below water: Includes the prevention and significant reduction by 2025 of marine pollution, nutrient pollution in particular; the effective regulation of fishing to ensure sustainable fishing practices; and the prohibition of certain fisheries subsidies by 2020.
15 Life on land: Targets the conservation and sustainable use of freshwater ecosystems and their services – such as wetlands – and the promotion of sustainable forest management – the halting of deforestation included – by 2020, the combatting of desertification and the restoration of degraded land and soil by 2030, and the prevention of biodiversity loss. As farming is the human activity which occupies the largest share of total land in many countries, agriculture can not only significantly impact biodiversity, but is also dependent upon it.
17 Partnerships for the goals: Features agriculture-relevant targets on international trade, including the promotion of an open, non-discriminatory and equitable multilateral trading system and the conclusion of the WTO Doha Development Round.
← 1. FAO (2011), The State of Food and Agriculture 2010-11: www.fao.org/publications/sofa/2010-11/en/
Goals 11 (Sustainable cities and communities) and 16 (Peace, justice and strong institutions) excluded from list.
Abbreviated titles as per United Nations formulation. For full titles, please refer to https://sustainabledevelopment.un.org.
Consumption
Population growth in developing countries is the dominant driver of global food consumption
The main driver of global agricultural commodity demand over the next decade will be population growth in developing countries. The world’s population is projected to rise from 7.4 bln in 2016 to 8.1 bln in 2025, with 95% of this increase occurring in developing countries. By 2025, there will be 6.7 bln people living in developing countries and 1.4 bln in developed countries. This means that between 2005 and 2025 the population in the developing countries will have expanded by an amount that equals the entire population in developed countries. The fastest growth in population will occur in Sub-Saharan Africa (SSA), with an increase from 0.96 to 1.22 bln, or 2.7% p.a., between 2016 and 2025.
A second determinant of consumption demand is per capita income growth, which adds to the consumption of each person. Again the main impetus for consumption growth will come from developing countries since their per capita income growth rate is expected to be higher. In addition, poorer people tend to spend a greater share of their additional income on food (i.e. their income elasticity of demand for food is higher). For example, the share of additional income that will be spent on food in China and the United States in 2025 is projected to correspond to 3.4% of the income increase in China and only 1.1% of the income increase in the United States.
Rising per capita incomes are associated with a third factor: changing consumer habits. As countries develop, they pass through a “nutrition transition”, by which higher incomes translate first into a demand for more calories, and then into a demand for more protein (typically from animal sources) as well as for other nutrients coming from fruit and vegetables. This trend is accompanied by more consumption of sugar, oils and fats, and greater consumption of processed foods. Many developing countries have complex consumption structures, with people who are undernourished (not having enough calories), over-nourished (having too many) and malnourished (often as a result of consuming an unhealthy diet). Developed countries mostly have more stable food preferences, with incomes growing more slowly and consumption patterns less sensitive to income changes. There are rising levels of over-consumption and a particular tendency to consume more meat and dairy products, as well as vegetable oils and sweeteners.
Per capita food consumption dominated by cereals in developing countries
Population growth, per capita income growth and changing consumer habits are integrated into the projections for per capita food consumption. Figure 1.2 shows the differences in per capita food demand between developed and developing countries, with the latter broken down into Sub-Saharan Africa and “other developing countries”. The majority of least developed economies (LDCs) are located in Sub-Saharan Africa. South Africa, which is traditionally included in the group of developed countries, is considered as part of Sub-Saharan Africa for consistency with Chapter 2.
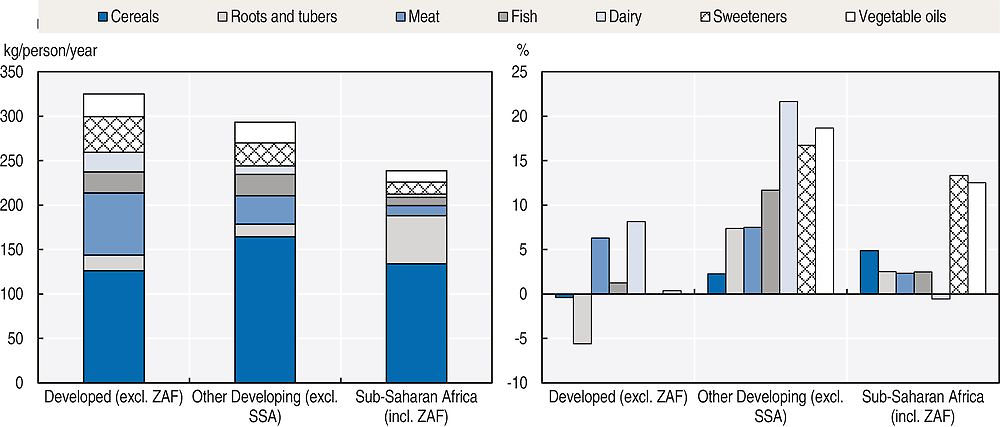
Note: Dairy products are represented in dry equivalent because their high water contents would lead to a disproportionate per capita consumption compared to the other food items. ZAF refers to South Africa.
Source: OECD/FAO (2016), “OECD-FAO Agricultural Outlook”, OECD Agriculture statistics (database), https://doi.org/10.1787/agr-data-en.
The panel on the left shows projected per capita consumption in 2025 of the main food items covered in the Outlook, while the panel on the right presents their respective growth rates between 2013-15 and 2025. These figures only consider food use of the commodities that are covered in the Outlook and hence exclude some important ingredients in people’s diets, in particular vegetables, fruit and pulses.
In 2025, developed countries will still consume the highest volume of food in per capita terms. However, the gap between developed and developing countries (excluding SSA) is narrowing and per capita consumption in some developing countries has already exceeded the developed average. Per capita consumption in SSA on the other hand will still be almost 20% lower than in other developing countries, with about half of all calories coming from cereal consumption.
In all three country groups, cereals represent the main ingredient in the diets in per capita terms but their relative importance is decreasing slightly over the projection period. Consumers in developed countries will continue to reduce their cereal intake and switch to other sources of energy. Per capita cereal consumption for food purposes will grow only slightly in developing countries (excluding SSA), but is projected to increase by 4.9% in SSA. Interestingly, rice consumption in SSA will experience the largest growth rate among the cereals (8.3%), growing from 25.8 to 27.9 kg/cap/year between the base period and 2025. Roots and tubers, in particular cassava, remain an important component of diets in SSA, with per capita consumption of 53 kg in 2025.
Per capita consumption of meat in 2025 is estimated at 69.7 kg retail weight (rwt) in developed countries; which is more than twice that in the other developing countries (32 kg rwt), and almost seven times that in SSA (11.3 kg rwt). In developed countries, meat exhibits a strong growth mainly as a result of solid demand growth in North America, which is fuelled by the strength of the US economy under the baseline and by lower prices. Per capita consumption of fish in 2025 is expected to remain lower in developing countries than in developed countries (21.5 kg live weigh (lw) vs 23.3 kg lw). However, if SSA is excluded, per capita fish consumption in 2025 in developing countries (excluding SSA) would be 24.3 kg lw and surpasses consumption in developed countries.
Per capita consumption of dairy products in developing countries (excluding SSA) will increase by 21% compared to the base period and be heavily oriented towards fresh dairy products over processed dairy products. The largest per capita consumption increases of fresh dairy products will be observed in India, Pakistan, Turkey and Uruguay. In developed countries, per capita consumption is projected to grow even faster in the next decade than in the previous one. Demand growth will be predominantly driven by consumers in Ukraine and the Russian Federation, where the import ban is expected to be lifted as of 2017. SSA is expected to witness only a marginal increase in per capita dairy consumption.
In overall terms, the consumption of more meat, fish and dairy products will lead to more diversified diets and higher per capita protein intake. On a global scale, the tendency of meat consumption to rise with incomes outweighs tendencies to reduce meat consumption in countries where per capita consumption levels are already high.
Developing countries exhibit strong per capita food demand for sugar and vegetable oil
In developing countries human sugar consumption will increase more than 15% in per capita terms. This translates into increases from 20 kg to 23 kg per capita in developing countries (excluding SSA) between the base period and 2025 and from 11 kg to 12 kg in SSA. A large variation in sugar consumption among developing countries in 2025 is expected, ranging from 2 kg in least developed Oceania to above 50 kg in Uruguay (52 kg), Brazil (57 kg), Thailand (56 kg) and Malaysia (65 kg). In order to help countries identify the amount of sugar that is consistent with a healthy diet, the WHO recommended in 2015 that daily per capita intake of sugar should not exceed 10% of total energy intake, implying that the expected sugar consumption is proportionate to total calorie intake. Implementing the WHO guidelines will not only have impacts on the demand side but also on the production side. Box 3.3.1 in the (online) sugar chapter examines how reducing sugar consumption in line with the WHO guidelines would impact agricultural commodity markets.
Per capita consumption of sweeteners in developed countries is projected to increase only marginally by 2025. In some countries of the European Union a substitution of sugar with HFCS is expected to take place after the sugar and HFCS quota abolition. Consequently, the share of HFCS in EU sweetener consumption is expected to reach 11% in 2025, from 3% during the base period. Some countries have also started targeting obesity via market interventions. Mexico, for example, introduced an 8% tax on sugary drinks in 2014, which has been incorporated in the Outlook projections.
The demand for vegetable oil for human consumption in developing countries will expand considerably during the outlook period, but will remain at levels below those in the developed countries. By 2025, developing countries (excluding SSA) will consume 23.5 kg per capita, which is almost as much as in developed countries (25.5 kg), while consumption in SSA will increase to 12.8 kg. As incomes grow, vegetable oil consumption also rises. India and Thailand are projected to witness particularly high per capita growth rates of vegetable oil for food consumption, of 55% and 49% respectively.
Rising levels of food availability and increasing per capita food consumption are associated with a range of nutritional changes, some positive, some negative. Increased calorie consumption is expected to reduce undernourishment across the developing world. The second Sustainable Development Goal (SDG 2) pledges to eliminate hunger by 2030. The implications of the 2015 baseline projections for hunger, as captured by the FAO’s undernourishment indicator, and hence for progress towards SDG 2, are presented in Box 1.3.
Reducing hunger and undernourishment is a global priority. The Millennium Development Goals (MDGs) included a target of halving between 1990 and 2015 the proportion of people who are undernourished. According to FAO estimates, this target was almost met at the global level, but progress was uneven across countries and there remained nearly 800 million undernourished when the MDGs expired in 2015. The new Sustainable Development Goals (SDGs), which replace the MDGs, have the ambitious target of eradicating hunger entirely by 2030.
Analysis using Aglink-Cosimo provides projections for undernourishment to 2024 consistent with the baseline of the 2015 OECD-FAO Agricultural Outlook. It assesses which countries are on trend to meet the SDG objective of eliminating hunger, as captured by the FAO’s undernourishment indicator. It also considers the impact on these projected numbers of four alternative scenarios; faster income growth relative to the baseline in developing countries, stronger growth in agricultural productivity, a combination of a faster income growth with a stronger productivity growth and finally a more equitable access to available food supplies.
The OECD-FAO Agricultural Outlook contains projections for production, consumption and trade of the major agricultural commodities, and implicitly for the availability of calories at the national level for the 32 developing countries explicitly covered by the Aglink-Cosimo model (OECD, 2015). The FAO’s undernourishment indicator measures the probability that an individual from a reference population consumes less than the minimum calorie requirement for an active and healthy life. The Prevalence of Undernourishment (PoU) converts national calorie availability into estimates of undernourishment on the basis of an estimated distribution of peoples’ access to available calories. This paper takes the Outlook estimates for calorie availability and – in the base case – keeps the distribution of access to those calories unchanged. On that basis it is possible to provide projections for undernourishment.
Under a “status quo” scenario in which policies remain unchanged and agricultural productivity growth continues on trend, the global PoU is projected to fall from 11% to 8% over ten years, with Latin America as a whole dipping under the 5% threshold at which the FAO considers hunger to be effectively eradicated. The PoU falls from 12% to 8% in Asia and Pacific, with Indonesia and Thailand dipping under the 5% threshold, and from 23% to 19% in Sub-Saharan Africa. The global total of undernourished people declines from 788 million to 636 million (Figure 1.3).
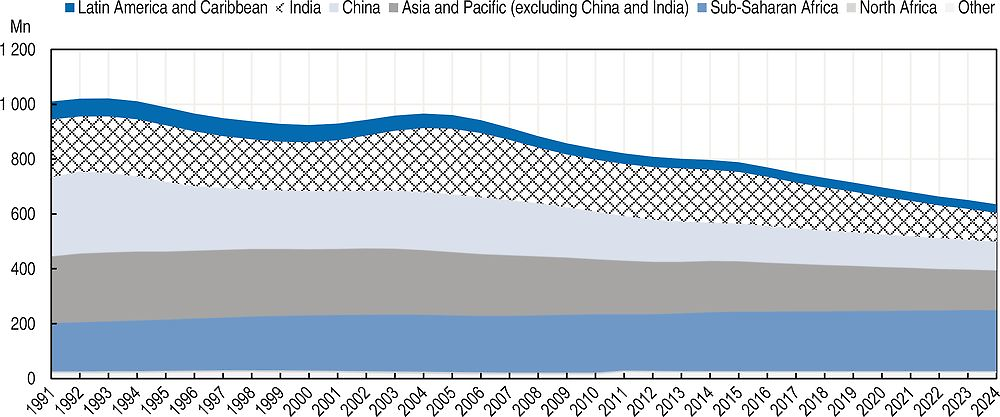
Source: OECD Secretariat.
By 2024 global consumption of calories from crop and livestock products will be 14% and 15% higher than in 2015 respectively. Developing countries account for 96% of the additional consumption of crop products and 88% of livestock products. Adjusting for population growth, per capita consumption levels for crops and livestock will rise by 4% and 5% respectively.
Faster income growth in developing countries of 1% cumulatively over the next ten years (raising the average annual growth rate by around a quarter) implies that per capita incomes end up 10% higher in 2024 and reduces the PoU in developing countries by a further 0.5%, with slightly larger effects in Africa than in Asia. Raising agricultural productivity growth in developing countries by 1% cumulatively over ten years (implying a gain of more than 50% across crop products relative to the baseline), would lower the PoU in developing countries by an additional 0.8% and enable China, Nigeria and Peru to effectively eradicate hunger. Here, however, the average effects would be larger in Asia than in Africa. A combination of both effects would be essentially additive, with Bangladesh joining the group of countries free from hunger.
Unsurprisingly, the biggest impacts on undernourishment come through a scenario which improves access to available calories through a more equal distribution of incomes and hence expenditures across national populations. This emphasises the fact access to food and not availability is the crucial aspect of food security since globally 50% more calories are currently available than needed to meet everyone’s minimum calorie requirement. A 10% reduction in the coefficient of variation in 2024 lowers the overall PoU by 1.7 percentage points and allows all the countries in the income and productivity scenarios, plus India and Viet Nam, to eliminate undernourishment.
A combination of income growth, agricultural productivity gains, and reduced income inequality will keep most Asian countries on track to achieve the SDG of eliminating hunger. However, the PoU for Sub-Saharan Africa as a whole remains stubbornly high under all scenarios, and by 2024 the region will account for more than one third of the global total of undernourished. For the poorest African countries, much deeper transformations will be needed that raise the incomes of the poorest households and with it their access to food – whether that food is sourced domestically or from imports. The question of how to realise those gains, and the role of domestic agricultural production, is a broader development question beyond the remit of this report.
Food availability can be met by domestic production and by imports, and trade will play an important role in moving supplies from surplus to deficit countries. The importance of trade depends on each country’s circumstances. Although in several cases much of the additional consumption is sourced locally many developing countries will also import a significant and rising share of total calories. The tendency will be reinforced if overall income growth is the dominant source of increased calorie availability, and reduced if the main driver is domestic agricultural productivity growth.
Overall consumption of agricultural commodities will grow faster in developing countries
Increases in per capita food consumption combine with population growth to give overall increases in consumption (Figure 1.4). A share of cereals and oilseed utilisation is destined for animal feed and the production of biofuels, so the fact that total consumption growth exceeds population growth does not necessarily imply rising levels of per capita food consumption.
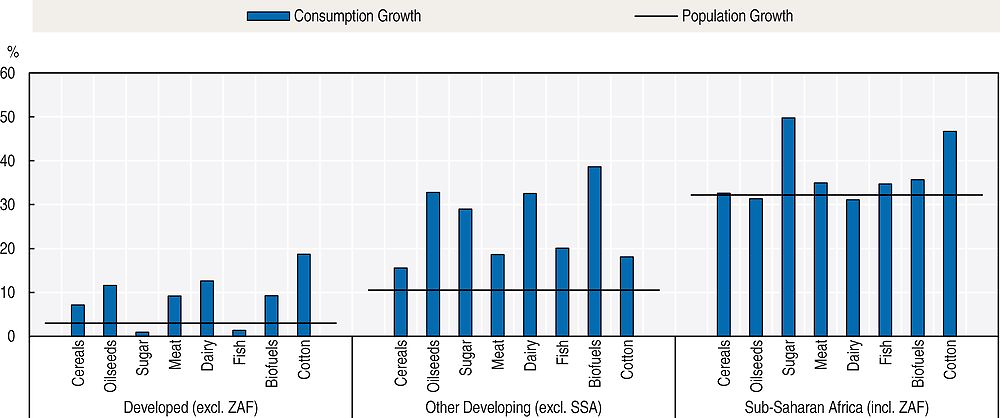
Note: ZAF refers to South Africa.
Source: OECD/FAO (2016), “OECD-FAO Agricultural Outlook”, OECD Agriculture statistics (database), https://doi.org/10.1787/agr-data-en.
Among developed countries, the United States and the European Union are the largest drivers of biofuel demand. Lower petroleum prices are stimulating gasoline use, with biofuel mandates raising biofuel use in the United States in the first two years of the Outlook. Given lower gasoline use prospects over the rest of the projection period and the restricted availability of blends exceeding the 10% blend wall, the implied maize-based ethanol mandate is assumed to decline after 2018. The advanced mandate (which covers biofuels from sources other than maize) is in turn assumed to increase so that the total US mandate remains close to its 2017 level. This translates in lower ethanol use and in an expansion of biodiesel use over the projection period. In the European Union, ethanol and biodiesel fuel use is expected to expand up to 2020, when the Renewable Energy Directive target has to be met, and then to decrease in line with lower gasoline and diesel use prospects.
Developing countries (excluding SSA) exhibit strong consumption growth rates for all commodity groups. This group of countries comprises the most populous countries as well as emerging economies which are projected to experience the largest economic and income growth. The strong demand growth for sugar occurs in populous countries in Asia and Pacific, which will account for around 67% of the expansion in use. India, China and Indonesia will experience the largest increases in sugar consumption. Brazil is projected to expand its use of sugarcane-based ethanol over the outlook period and remain the largest user of ethanol among developing countries. Biodiesel use will also expand steadily, with notable demand increases in Indonesia, Brazil and Argentina, in line with their domestic mandates. Raw cotton demand will remain concentrated in countries in Asia and Pacific. By 2025, India will have surpassed China as the world’s largest consumer of raw cotton. Large cotton consumption growth rates are projected to occur in Bangladesh (3.7% p.a.), Indonesia (3.2% p.a.), and Viet Nam (3.1% p.a.).
Consumption growth in SSA is higher for most commodities than in other developing countries. However, these growth rates have to be placed in perspective, as current levels of consumption are much lower in SSA. Moreover, consumption growth in SSA for most agricultural products is only marginally ahead of population growth. Indeed, the population of SSA is expected to grow by 33.6% between 2013-15 and 2025, a much higher rate than the average 10.5% population growth in other developing countries.
Production
Production growth through intensification
Strong global demand and low stocks resulted in high agricultural prices in recent years which, along with policy reforms in many countries, provided the economic incentives and facilitating conditions for increased global agricultural production. Overall, the sector was able to expand at 2.5% p.a. in the last decade.
In the coming decade, agricultural production faces a different set of challenges. Commodity prices started to decline in 2013, stocks have been replenished and economic growth in major producer countries is projected to slow. As outlined in the previous section, global demand growth varies between commodities, but overall is projected to be slower than in the previous decade. The resulting weakening of agricultural markets makes the sector less attractive for investments, limiting total agricultural output growth to 1.6% p.a. on average during the projection period. After the strong gains in recent years, crop production is projected to grow at about 1.5% p.a. in the next decade.
Global demand expansions can be satisfied mainly through efficiency improvements, requiring only small expansions of the production base, crop area and livestock herds. In the crop sector, yield improvements will be responsible for 80% of total output growth, while area expansion accounts for 20%. Agricultural area harvested of the crops reflected in the Outlook is projected to expand by 42 Mha (4%) over the next decade with almost half of this increase taking place in Brazil and Argentina. Sustained demand and lower feed prices support the steady growth of livestock production at 1.4% p.a., adding about 4.5 Mt of meats and 16 Mt of milk annually. World fishery production will expand by 17% over the course of the projection period, with aquaculture production steadily increasing its role in total fish supply. Global biofuel production stagnates due to the lower energy prices, which curb discretionary demand, and more conservative policies in some of the major producer countries.
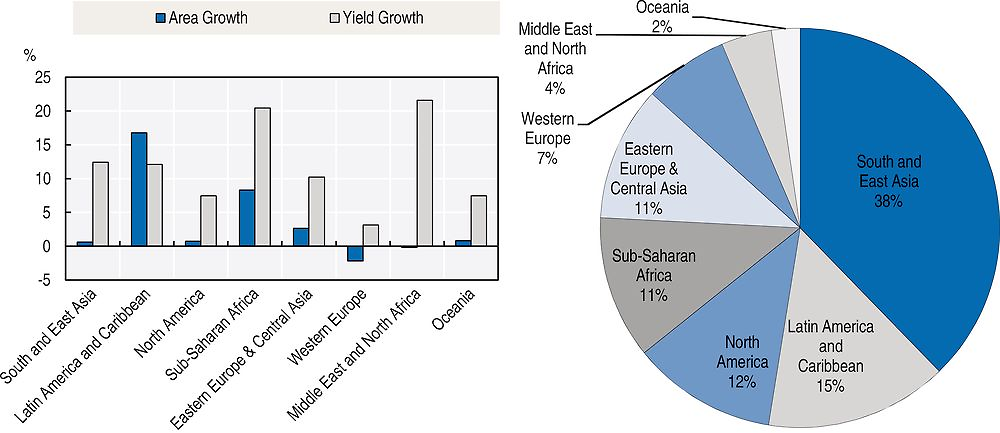
Figure 1.5 illustrates the evolution of area growth and yield growth by geographic region and indicates each region’s share of the global agricultural area in 2025 (see the methodology section for the classification of geographic regions). In Sub-Saharan Africa, production results from a combination of yield improvements and area expansion. South and East Asia, and Eastern Europe sustain their moderate growth mainly by yield advances. By contrast, in Latin America and the Caribbean area expansion is a major driver, mainly due to Brazil’s and Argentina’s expansion in soybean. In North Africa and the Middle East, and Western Europe, yield growth compensates for the decrease in area. In Oceania, higher self-sufficiency rates are expected through yield and area increases. The remainder of this section will provide an overview of the projections for agricultural production in the various geographic regions.
Source: OECD/FAO (2016), “OECD-FAO Agricultural Outlook”, OECD Agriculture statistics (database), https://doi.org/10.1787/agr-data-en.
Source: OECD/FAO (2016), “OECD-FAO Agricultural Outlook”, OECD Agriculture statistics (database), https://doi.org/10.1787/agr-data-en.
South and East Asia: Production increases despite resource constraints
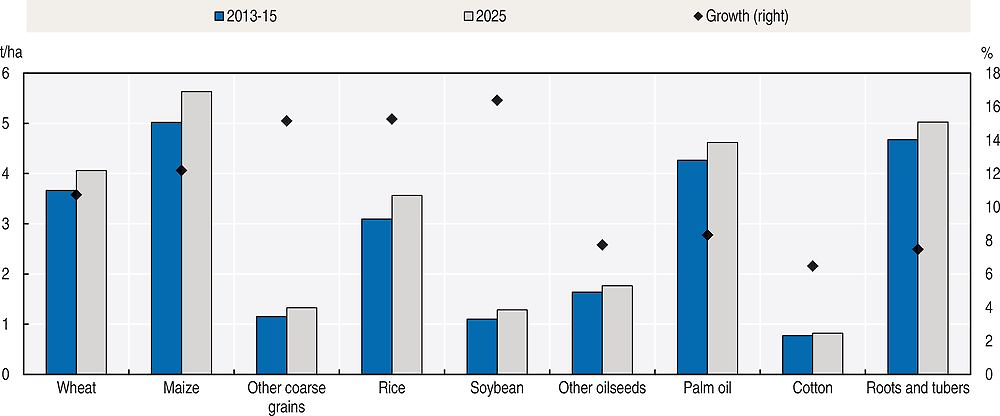
The South and East Asia region is the world’s largest producer of agricultural products. In the base period 2013-15, the region produced about 40% of world cereals and meat and almost 60% of vegetable oils, mostly palm. The agricultural sector faces increasing constraints with respect to area and water availability as well as shortages of labour. Primarily through intensification and efficiency improvements the agricultural output in the region is expected to expand by almost 20% over the next decade. The livestock sector will contribute about 40% to this development, while the crop sector will contribute 33% and fisheries 27%. Figure 1.7 illustrates the average yield growth by 2025 for the individual crops.
Source: OECD/FAO (2016), “OECD-FAO Agricultural Outlook”, OECD Agriculture statistics (database), https://doi.org/10.1787/agr-data-en.
Due to its dominant position and strong yield improvements, 89% of the global production increase in rice will originate in South and East Asian countries, predominately in India, Indonesia and Bangladesh. Production of maize, the second most important crop in the South and East Asia region will expand mostly on the account of China. India, currently the world’s third largest wheat producer, shapes the development of this crop in the region. Neither in India nor any other country of the region do farmers have sufficient incentives to expand their area planted to wheat; all additional output is due to expected yield improvements.
Production of soybeans in South and East Asia will increase by about 30% from its small base. More emphasis is expected in China, India and Indonesia. Still, the region, first and foremost China, will continue importing and crushing vast and increasing amounts of soybeans. In addition to being the leading importer, China is also one of the largest producers of other oilseeds (mainly rapeseed and groundnuts), but output is not projected to expand significantly. Besides producing protein meal and vegetable oils from oilseeds, South and East Asian countries also lead world production of palm oil. As a result of the recent slow-down in Chinese cotton production, India has become the world’s largest producer; through further area expansion and the application of new technologies it is expected to produce approximately 30% of the world output by 2025. Even though palm oil will be less used as a feedstock in European biodiesel, production is expected to expand faster than oilseed-based oils mostly to meet domestic mandates.
Satisfying the fast growing domestic demand for meat, dairy and fish remains a challenge for the livestock sector in the region. Meat production will expand by 1.8 Mt annually by 2025, a 17% increase over the base period. Pork and poultry will account for the bulk of the expansion. China continues to be the region’s most important livestock producer, especially pork. South and East Asian countries are projected to continue dominating overall aquaculture production, with China, India, Indonesia and Viet Nam to account for the majority of growth over the next decade.
Rapid urbanisation and income growth induced demand in South and East Asia underpins the development of the dairy sector. Milk yield is set to increase by 20% to 2025. Due to a 47% expansion, India will become the world’s largest milk producer by 2020. Production of fluid milk in the region strongly outpaces the dairy processing sector since an increasing share of the milk is produced for fresh consumption.
The Americas: Export-oriented and fast growing
North America, and Latin America and the Caribbean combined currently dominate global oilseeds production, with a share of almost 90%, and have significant production shares of around 30% for cereals, meats and dairy. Cereals are more concentrated in the North, particularly maize, while the South focusses more on oilseeds and especially soybeans.
Crop output in North America increases by 10%, led by maize and soybeans. Rice production in the United States is in the process of recovery; wheat remains an important crop as well, but area continues to shrink and yield improvements are only marginal.
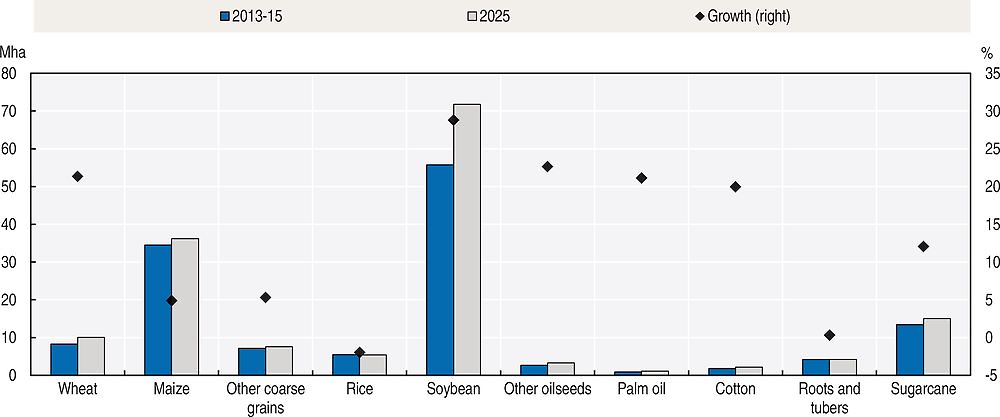
Latin America remains the most significant source of agricultural area expansion in the world, with total crop area increasing by 24% and soybeans driving most of this expansion (Figure 1.8). Brazil will become the single most important soybean producer by 2025, with production reaching 135 Mt. The soybean crush will provide not only vegetable oil for export, but also protein meals for an expanding livestock sector. Sugarcane and cotton continue to be a source of growth for Brazilian agriculture through improved yields and expanded area. Prospects for aquaculture are particularly good with an expected growth of 40% between the base period and 2025.
Source: OECD/FAO (2016), “OECD-FAO Agricultural Outlook”, OECD Agriculture statistics (database), https://doi.org/10.1787/agr-data-en.
The United States and Brazil remain the two largest ethanol producers. Their growth prospects differ, however, as Brazil is projected to increase its output by 25% during the projection period mainly driven by domestic demand, while the US production is expected to decrease due to weaker domestic and international demand.
Sub-Saharan Africa: Vast potential, but severe constraints
Chapter 2 of this Outlook provides an in-depth analysis of the agricultural sector and disaggregated projections for Sub-Saharan Africa. Whereas past production growth has been underpinned by area expansion, over the next ten years area growth is projected to slow, with an increasing share of production growth attributable to improved productivity. Overall, total agricultural production is projected to expand by 2.6% p.a. in the coming decade. In many instances, production fails to keep pace with domestic demand, resulting in rising import dependence for many primary food products. At the same time, many countries are competitive producers and consistent exporters of fruit and beverage crops, contributing to foreign currency reserves.
Eastern Europe and Central Asia: A global player in cereals
Eastern Europe and Central Asia experienced a rapid expansion of its agricultural output during the previous decade, with crop production increasing by 42%. The region produced 10% of global cereals in 2013-15, mostly wheat. However, the variable weather conditions in the region and ensuing production instability induces uncertainty into global cereals markets.
Over the projection period, total agricultural production will expand by 13%. Natural conditions favour the concentration on cereals, followed by sunflower seed. The rapid area expansion observed during the last decade will not be sustained. Projected shifts in relative profitability will result in crop substitutions. While production gains in sugar crops are based mainly on area expansion, growth in cereals and oilseed is due to increased yields. In general, yields remain below global averages. Soybeans, a relatively new crop for this region, are expected to show the highest yield increase.
Similarly to the crops sector, the livestock sector will further expand in the projection period, albeit at a much lower rate. Total meat production will increase by 3 Mt, with poultry accounting for about one half. Improved milk yields will support the development of dairy processing.
Fuel ethanol and biodiesel will remain marginal in the region as the countries are either oil and gas producers or commodity exporters without incentive policies for biofuel producers or blending mandates for consumers.
Western Europe: Stable production structures
Currently, the industrialised countries in Western Europe hold significant shares of global dairy production (36%), biofuels (30%), meat (15%) and cereals (13%). After years of strong expansion in response to high prices, the projected slowing in crop production results from flat or decreasing biofuel feedstock demand, stagnating domestic feed and food demand and stiffer competition in the world market for cereals, especially from Eastern Europe and Central Asia.
Total harvested area will be reduced by 3% in 2025. Yields are the highest in the world for most crops with only small margins for improvement (4% on average). By 2025, the production in Western Europe is projected to further concentrate on cereals. Individual crop projections are mixed; maize and sugar beet production will expand, while harvests of other coarse grains, other oilseeds, and roots and tubers (mainly potatoes) are expected to decline.
The meat sector is projected to grow at twice the rate of crops, which will result in 1.7 Mt of additional meat production in 2025. Poultry and pork account for most of the gains. Intensification and restructuring of the dairy sector in the European Union will result in an overall expansion of milk production. The strong supply of raw milk backs a significant enlargement of the dairy processing sector. Further growth of the European dairy and meat industry will be determined by its competitiveness in international markets as most of the additional output will be exported.
North Africa and the Middle East: Difficult conditions cause volatility
Unfavourable natural conditions and unstable political situations in many countries in North Africa and the Middle East constrain agricultural production. Owing to a lack of water availability or irrigation the region’s share of global production is very low. Wheat is the predominant crop accounting for almost 60% of the harvested area. In countries like Iran and Morocco, local authorities strive to increase self-sufficiency using various policies aimed at boosting wheat production. The progress comes at a cost, as limited resources need to be rationed and the gains in wheat production imply stagnating production of other cereals such as maize and other coarse grains. Sugar crops production also expands in the region, given the importance of sugar as a source of calories. Positive trends are also expected for rice, roots and tubers, but they remain niche products.
The meat and fish sectors will not maintain the growth rate of the previous decade and expand production by only about 1% per year, based overwhelmingly on poultry and sheep. The dairy sector will remain very traditional with low inputs and low yields, utilising cows, camels and goats. Most of the milk is consumed in the form of fresh dairy products, and production of cheese, butter and milk powders remains limited.
Biofuel production is not relevant in the region, because it is oil rich and feedstock crops would have to be imported.
Oceania: Successful niche producer
Oceania’s prominence in global agriculture is not the result of its actual production share, but based on its strong per-capita production which generates a high exportable surplus. Even as the preeminent dairy products exporter, its production accounts for only 9% globally; even less for meat (2%) and cereals (2%), its other important export commodities. Oceania is expected to recover from a period of declining production, expanding output by 11% over the projection period. The gains will come mainly from sugarcane and cereals and are mainly based on yield improvements.
Based on a slower growing global import demand for meat, the livestock sector in Oceania is slowing as well. Poultry dominates the expansion but is almost entirely focused on the domestic market; while beef and veal production is projected to remain flat. Milk production will continue to be driven by expanding dairy cow herds, whereas yield developments are slower due to the predominantly pasture-based production system. Capture fisheries will continue to be predominant in Oceania, with a share of 83% of total fish production in 2025.
Trade
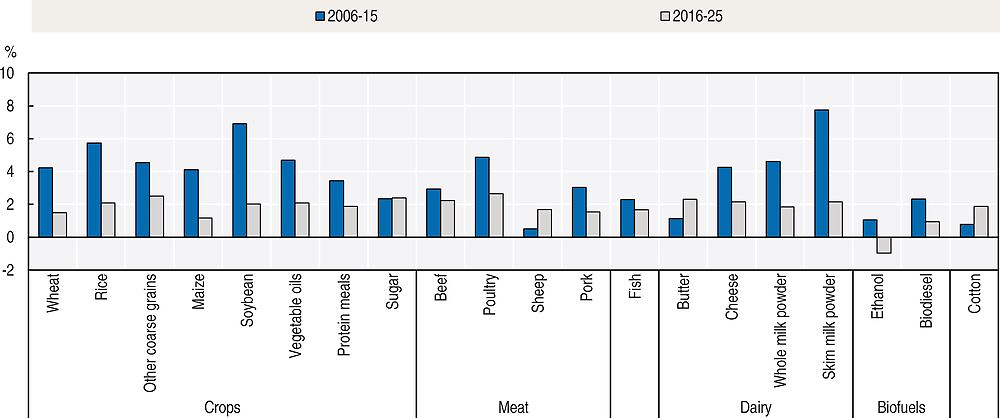
Agricultural trade to increase, but at slower rates than in the past
Along with global supply and demand, trade is expected to expand less over the next ten years than in the previous decade (Figure 1.9). The declines are particularly acute for cereals and dairy products, but also apparent for meats (with the exception of sheep meat) and fish. Among non-food products, trade in ethanol and biodiesel is expected to contract, while trade in cotton is projected to recover following sharp declines between 2005 and 2008. The slower growth rates for most food products need to be placed in context, as the trade levels are higher in the base period compared to the previous decade. For example, world meat trade in 2025 is projected to be 22% higher than in the base period and the additional volume of meat traded will be roughly the same in the next decade as in the previous one.
Source: OECD/FAO (2016), “OECD-FAO Agricultural Outlook”, OECD Agriculture statistics (database), https://doi.org/10.1787/agr-data-en.
The main reason for this slowdown is lower growth rates in emerging economies, which have relatively high income elasticities of demand for most food commodities. The importance of China as a major importer of several commodities means that the slowdown in China’s growth will have a particularly significant impact (Box 1.5).
A further reason for the slowdown is the adoption of more protectionist policies in some of the larger importing countries. Whereas agricultural trade protection has been declining in most OECD countries, several emerging economies (including China, India and Indonesia) have pursued self-sufficiency objectives and associated import protection. To some extent, the tendency for increased protection may be offset by new regional and plurilateral trade agreements, although agreements may also divert trade away from non-members. Only ratified trade agreements are included in the projections. Hence specific provisions of the WTO Nairobi agreement are included, but the Trans-Pacific Partnership agreement is not. An overview of the Nairobi package is provided in Box 1.4. China’s decision in March 2016 to end the stockpiling of maize and release additional maize on the market in the coming years has also been incorporated in the baseline.
The recent appreciation of the US dollar has made US exports less competitive on the world market and reduced export flows from countries whose currencies are linked to the US dollar. On the other hand, the US dollar appreciation can create export opportunities for countries with currencies that depreciate relative to the US dollar. Brazil and Argentina, for example, are projected to expand their shares of the global meat markets, while Australia and New Zealand will maintain their high market share in dairy markets.
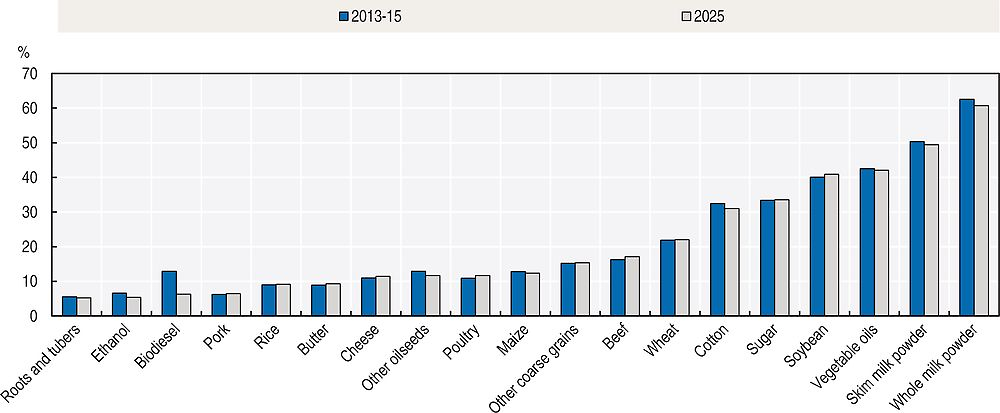
The slowdown in trade will not cause any major changes to the share of agricultural production that is traded. Figure 1.10 compares the share of production that was exported during the baseline with the projections for 2025. The ranking of the commodities is not projected to change considerably during the next decade. Whole milk powder (WMP) and skimmed milk powder (SMP) will remain the most traded agricultural commodities and fresh dairy products (not depicted in the figure) will continue to be the least traded. The very low trade in fresh dairy products, with less than 1% of production traded, is directly related to the difficulties in transporting and storing fresh products. Vegetable oils and soybean are also highly traded, with over 40% of their production entering international markets. About 31% of total fishery production is expected to be traded in 2025. Among the different types of meat, beef and poultry will remain the most traded and are projected to account for 80% of the additional meat traded in 2025 relative to the base period.
Source: OECD/FAO (2016), “OECD-FAO Agricultural Outlook”, OECD Agriculture statistics (database), https://doi.org/10.1787/agr-data-en.
On 19 December 2015 the WTO Tenth Ministerial Conference in Nairobi, Kenya agreed on a package of Ministerial Decisions, a number of which are relevant to agriculture. The “Nairobi Package” includes a commitment to abolish export subsidies for farm exports, in addition to other agriculture-relevant decisions concerning public stockholding for food security purposes; a special safeguard mechanism (SSM) for developing countries; measures related to cotton; and preferential rules of origin.
Export Competition: A key feature of the Nairobi Package is a Ministerial Decision on Export Competition, under which developed countries have pledged to eliminate subsidies for farm exports, with the exception of scheduled export subsidies for dairy and processed products and pork. The latter have been given more time and have been agreed to be phased out by the end of 2020. Developing countries have until the end of 2018 to phase out export subsidies, but will be able to continue to cover marketing and transport costs for agriculture exports until the end of 2023. The poorest and food-importing countries will be granted until the end of 2030 to meet their commitments.
In addition to the above, the decision contains restrictions, or “disciplines”, to prevent the use of other export policies as subsidies. These disciplines include limitations on financing support for agriculture exporters, such as export credits, export credit guarantees or insurance programmes; rules for agricultural exporting state enterprises; and disciplines to ensure that international food aid does not adversely impact domestic markets.
Public Stockholding for Food Security: The decision, on Public Stockholding for Food Security Purposes reaffirms the commitment of WTO members to negotiate and make all concerted efforts to agree and adopt a “permanent solution” to this issue, which had been at the centre of discussions at the Bali Ministerial in 2013.
Cotton: The Cotton decision calls on developed countries – and developing countries that declare themselves able to do so – to grant listed “cotton-related” exports from LDCs duty-free and quota-free access from 1 January 2016 onwards, to the extent provided for in their respective preferential trade agreements in favour of LDCs. Developed countries are also required to end cotton export subsidies immediately, while developing countries must do so by 1 January 2017. The decision also acknowledges reforms made by certain countries to their domestic cotton policies which may contribute to the reduction of domestic subsidies, while emphasising that further efforts need to be made.
Special Safeguard Mechanism (SSM): Countries agreed to maintain the right of developing countries to have recourse to SSM based on import quantity and price triggers with precise arrangements to be further defined as envisaged under paragraph 7 of the Hong Kong Ministerial Declaration. Negotiations on a SSM will be pursued in the WTO Committee.
Other agriculture-relevant decisions at the WTO Tenth Ministerial Conference in Nairobi included a decision on preferential rules of origin for least developed countries. The decision states that when Members apply a processing criterion for agricultural goods they shall, to the extent provided for in their preference programme, allow the transformation of raw agricultural products into processed products to confer origin. Members are also asked to consider extending preferential treatment to products containing non-LDC originating materials of up to 75% of the final value of the product.
Source: World Trade Organization (2015).
Agricultural exports to remain concentrated among a few key suppliers
Traditionally, agricultural exports are concentrated in those few countries that possess the natural endowments necessary for production and have the infrastructure in place to produce and export at competitive prices. During the next decade, that concentration will remain, but there will also be some commodity-specific shifts.
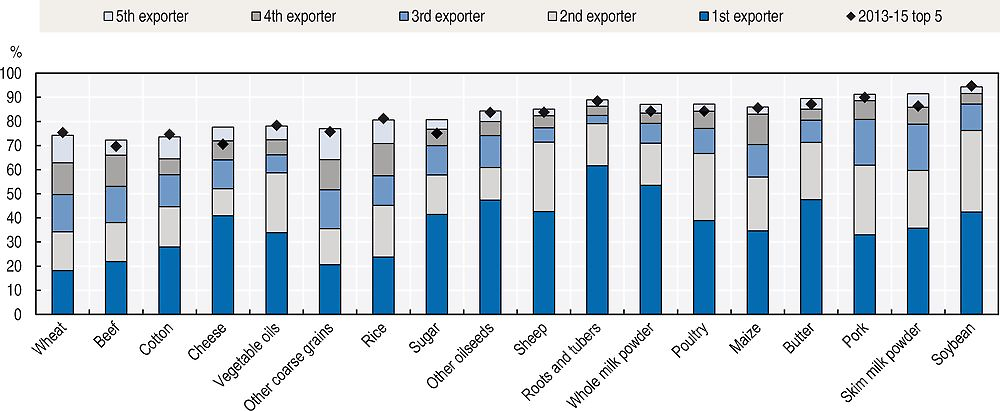
Figure 1.11 illustrates for selected commodities the export shares of each of the top five exporters in 2025. It also indicates the cumulative export share of the top five exporters during the base period (2013-15). In 2025, at least 70% of total exports will originate from only five countries for each commodity. The highest concentration of exports in 2025 is projected to remain in soybean trade, where the top five exporters account for almost 95% of total exports. For most products the cumulative shares of the five biggest exporters are similar to those in the base period, with some slight declines (e.g. wheat and cotton) and some increases (e.g. cheese, sugar and SMP).
The importance of a few exporters for the supply of numerous commodities implies potentially significant market impacts if exports are interrupted, either as a result of production shocks or policy changes. Those risks are particularly acute in the case where just one or two countries hold a significant share of exports, and other countries may struggle to replace a shortfall, at least in the short-term. In 2025, just one country is projected to account for more than 40% of world exports of roots and tubers (Thailand), WMP (New Zealand), butter (New Zealand), other oil seeds (Canada), sheep meat (Australia), and sugar and soybeans (Brazil).
Source: OECD/FAO (2016), “OECD-FAO Agricultural Outlook”, OECD Agriculture statistics (database), https://doi.org/10.1787/agr-data-en.
The composition and ranking of the top three exporters remains unchanged for most commodities between the baseline and 2025, with a few exceptions. The United States will remain the main exporter of maize, but will lose some market share to Brazil. The top three exporters of rice during the base period – India, Thailand and Viet Nam – were responsible for over 65% of total exports. By 2025, Viet Nam and India will have swapped places, making Viet Nam the largest exporter, and the export share of the top three exporters will become less than 60%. This is a result of the emergence of Cambodia and Myanmar as major rice exporters. Brazil is projected to replace the United States as the principal exporter of soybeans and India as the main beef exporter. One of the reasons behind these shifts is the ongoing depreciation of the Brazilian real which makes its exports more competitive.
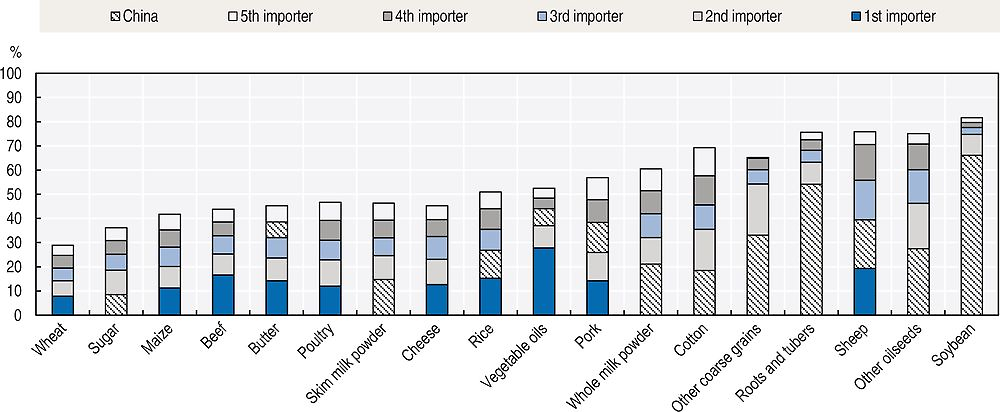
Agricultural imports to be more dispersed, but with China a key market for several commodities
With consumption growth projected to outpace production growth in many countries, imports will continue to be more dispersed among countries than exports (Figure 1.12). For some commodities, however, most notably soybeans, and roots and tubers, a relatively high share of import demand comes from just a few countries. China is a major importer of several commodities, and accounts for a large share of the markets for soybeans and other oilseeds, roots and tubers, other coarse grains, cotton and milk powders. The influence of China’s economic growth and of its grain policies is further explored in Box 1.5.
Note: Shading for China is super-imposed depending upon its position among leading importers.
Source: OECD/FAO (2016), “OECD-FAO Agricultural Outlook”, OECD Agriculture statistics (database), https://doi.org/10.1787/agr-data-en.
The high concentration of imports for oilseeds and cotton is tied to large scale processing of these commodities in a few countries. Soybean imports to China are projected to account for more than 65% of world imports by 2025, a 105 Mt increase compared to the baseline. The largest demand for cotton imports will also come from China in 2025, even though Bangladesh is projected to be a close second, followed by Viet Nam and Indonesia. These latter three countries will increase their cotton imports considerably compared to the baseline.
China is the largest producer of sheep meat and pig meat in the world, yet also imports large amounts of both types of meat. Over the next decade, China is projected to further increase its domestic production of meat as well as it imports. In the case of beef and sheep, which are the meat types that require the most feed, China’s imports will even exceed its domestic production. China will remain the largest importer of SMP and WMP in 2025, however its import shares of WMP are projected to decrease from 25% in 2013-15 to 21% in 2025. Viet Nam, Algeria and Nigeria are projected to emerge as major importers of WMP.
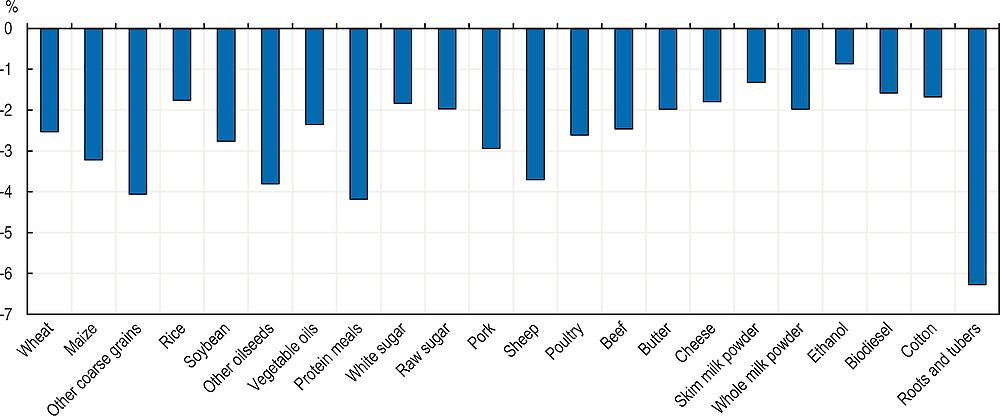
The importance of China for world agriculture has been stressed in previous Outlook editions, in particular the 2013 report, which had a special focus on prospects and challenges for the country’s agricultural sector. In the current Outlook, China’s economic growth rate is expected to slow to an average of 6% p.a. between 2016 and 2025, compared with an average of 9% over the previous decade. Under the baseline, cereals imports are projected to grow by 7% per year on average, which is slower than the growth rate between 2006 and 2015. This slowdown is a major factor behind the projections for slower agricultural trade growth and easing international prices.
If GDP growth slows further to 5% per year that will have a significant implication for several markets. A scenario analysis using the Aglink-Cosimo model finds that such a growth reduction would result in prices for most commodities being between 1% and 4% lower in 2025 compared to the baseline projections. Under this scenario, the greatest declines would occur for roots and tubers (-6.3%), oilseeds other than soybeans (-3.8%) and sheep meat (-3.7%). Price declines would be smaller for most meats (less than 3% for all except sheep meat) and for dairy (less than 2%). Across commodities, China’s share of world imports would slip by 1-2%, with a relatively large decline in market share for pork meat (where the share would fall to 8%, versus 12% under the baseline).
Source: OECD and FAO Secretariats.
Among cereals, the strongest world price impact would be found in the other coarse grains markets, with prices 4.2% lower by 2025. The second largest impact would be found in maize markets (-3%). Although Chinese imports are much lower than for barley and sorghum, the reductions would be stronger in absolute terms (1.8 Mt vs 1.2 Mt). This is due to Chinese maize production reacting much less elastically to price changes than import supply. International prices for wheat and rice would be reduced by 2.5 and 1.9% respectively.
Recently announced changes to China’s cereals policies could have a significant impact. Since 1996, China’s share of world cereal markets has been constrained by a policy of maintaining a 95% self-sufficiency ratio for key grains, including wheat, maize and rice. Various policies have been put in place to achieve this objective, including:
-
Minimum prices for rice and wheat, ad hoc interventions for maize, direct payments to support grain production, transfer payments to major grain-producing counties, comprehensive subsidisation of agricultural inputs as well as buffer stock norms and a few planting directives. Although price support also exists for cotton and oilseeds, persistently higher returns for grains have led to land being allocated to grain production, especially maize.
-
Tariff rate quotas (TRQs) for rice, wheat and maize, which were introduced at the time of China’s WTO accession in 2001. TRQs amount to roughly 5% of domestic demand and are subject to much lower import tariffs compared to out of quota imports. These TRQs have limited imports of the three main grains, but led to increasing imports of barley and sorghum as well as dried distillers’ grains, and roots and tubers (cassava) for feed, where no import quotas exist.
Under these domestic and trade policies, support to the grains sector has increased over the years, with domestic prices being roughly one-third higher than those prevailing on world markets. This has led to the accumulation of substantial surpluses, with maize stocks rising from an estimated 45 Mt in 2005 to over 100 Mt in 2015. By 2013-15, stock-to-use ratios had reached 40% for wheat, 45% for maize and above 60% for rice.
China has required increasing imports of grains in order to meet rising demand for animal feed. Until 2009, these imports were no more than 2 Mt and came from a combination of maize, distillers dry grains (DDGs), sorghum, but mainly barley. Overall these imports accounted for about 2% of their total feed use. By 2014 those imports had risen to 30 Mt, accounting for nearly 20% of total feed use. Imports of DDGs, sorghum and barley are almost all for feed use and account for world markets import shares of 80%, 75% and 15% respectively. By contrast, maize imports represent a much smaller share – about 4% – of the world market. Roots and tubers (cassava) is another important feed ingredient imported by China. China’s share in world imports has increased between 2000 and 2005 from 10% to over 50% of world imports and total Chinese imports reach 8.8 Mt dry matter in 2014.
With stocks rising and increasing food demand, China has decided to align domestic maize prices more closely with world prices, and maize farmers will receive a deficiency payment equal to a different between the market price and a target price from 2016 onwards. The abolition of minimum prices and the unavoidable release of stocks will lower domestic prices. If the stocks-to-use ratio were to fall to a more sustainable 30% (implying a total of 66 Mt) then about 35 Mt would need to be released. The release of stocks would tend to lower domestic prices, but some of the effect will be offset by increased domestic quantities demanded at lower prices. If stocks are released gradually (say at 5 Mt per year) that would add 4% to annual trade (currently 130 Mt) and 0.5% to world supplies (which run at 1 000 Mt). The substitution of maize for barley, sorghum and DDGs would potentially result in much bigger effects on these markets.
Over the longer term, China faces resource and environmental constraints to increasing its maize production, so imports would be expected to increase. The current Outlook assumes that China will reform its policies in a way that addresses its domestic objective of maintaining a high self-sufficiency ratio yet without severely disrupting international maize markets. However, the timing and scale of stock release is a major uncertainty underlying the projections.
Importance of trade for food security
As patterns of consumption and production continue to evolve, global trade in agricultural products is expected to continue to increase over the coming decades. Trade will influence the extent and nature of food security across all regions of the globe. In 2025, about one quarter of the world’s population obtain at least 25% of their cereal food use from imports.
Resource constrained countries in the Middle East and Northern Africa (MENA) and a number of countries in Sub-Saharan Africa are especially dependent on imports of basic and high value food commodities. The MENA region currently imports more than half of its main staple food, wheat; 70% of sugar; and 80% of vegetable oils. The dependency on wheat imports is expected to ease slightly in the coming decade, while it will increase for other products. In Sub-Saharan Africa, the need for imports is especially high for vegetable oils (50%), poultry meat (36%) and sugar (23%), all with an increasing trend.
As food imports increase further, many countries become increasingly concerned about the reliability of global markets as a source of affordable food. Opening to trade increases food availability in importing countries and exerts downward pressure on consumer prices. On balance it reduces risks, as global markets tend to be less volatile than domestic markets, although greater reliance on international markets can leave countries vulnerable to the actions of trading partners and to external market shocks.
Prices
Nominal prices to increase by 2025, but remain below recent peak levels
The Outlook uses prices at main markets (e.g. US gulf ports, Bangkok) of each commodity as international reference prices. Historic observations are used to describe previous developments while projected values reflect future market trends. Near term price projections are still influenced by the effects of recent market events (e.g. droughts, policy changes), whereas in the outer years of the projection period, they are driven by fundamental supply and demand conditions only.
Figure 1.14 shows for selected commodities the projected evolution of nominal prices. Over the short-term, a combination of rebuilt global stocks and sluggish demand will keep prices for rice, wheat and other coarse grains under pressure. By contrast, maize prices are not expected to fall any further in 2016, after a sharp drop in 2015. Over the medium-term, prices for all cereals are projected to follow a similar trend of modest nominal increases, with more significant gains in other coarse grains, which is mostly a result of the high demand for animal feed in China and limited production expansion possibilities in the main production regions.
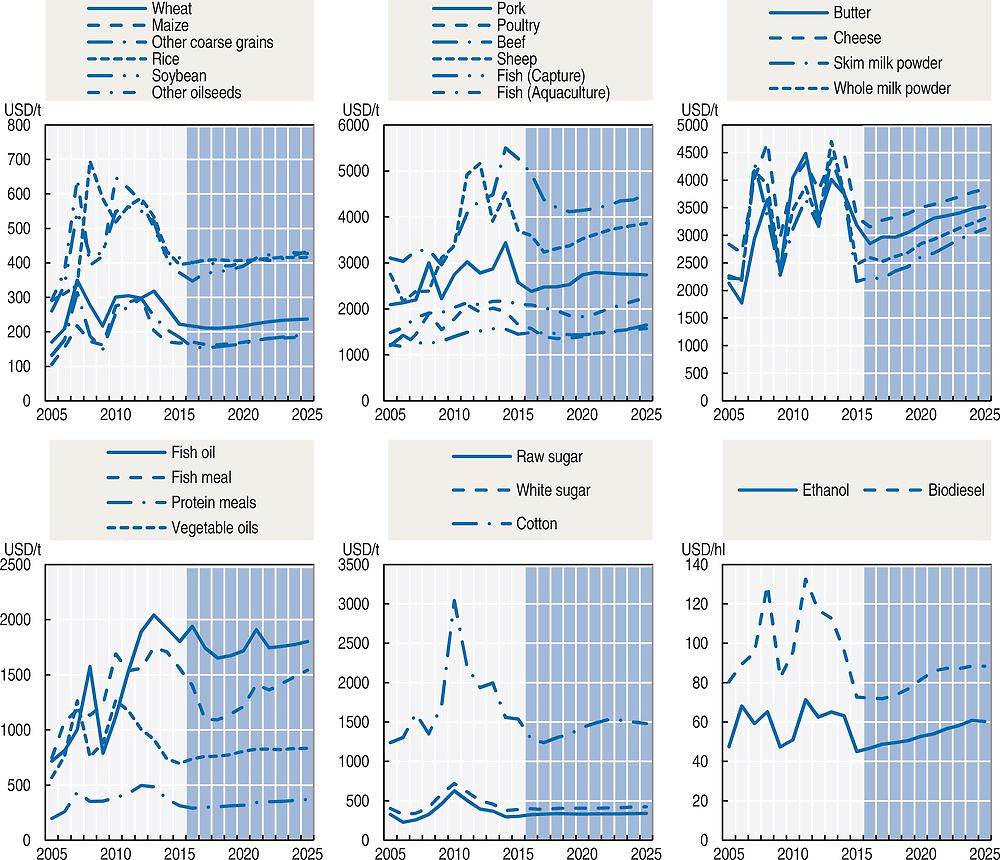
Source: OECD/FAO (2016), “OECD-FAO Agricultural Outlook”, OECD Agriculture statistics (database), https://doi.org/10.1787/agr-data-en.
Sugar prices remain stable, with global production projected to meet the growing demand in developing countries. The white sugar premium is projected to increase at the start of the projection period following growing import demand. However this situation is expected to change in 2017 due to the abolishment of the sugar quota in the European Union which will lead to lower raw sugar imports and higher white sugar exports. Towards the end of the projection period, the premium is projected to increase again as producers switch to exporting more raw sugar than white sugar.
Prices for protein meals grow at a faster rate than the price of vegetable oil. Whereas vegetable oil consumption is driven mainly by food demand increases in developing countries, the growth in protein meal demand is stronger due to increased non-ruminant and milk production and a greater incorporation of protein in feed rations in developing countries. Additionally, the sustained expansion of palm oil production depresses vegetable oil prices. As a result, soybean prices also rise at a faster rate than the prices of other oilseeds, reflecting their greater protein meal content.
Meat prices decline in the short-term as producers respond to lower feed grain prices. Owing to feed intensive production practices, pork and poultry producers gain a greater benefit from lower feed grain prices, while the shorter production cycle of poultry in particular allows a more rapid response to price signals. Its efficiency in feed conversion and rate of efficiency gains allows poultry to remain the cheapest source of protein, despite firm demand growth. Within the beef sector, which exhibits the longest production cycle, prices trend downwards until 2019 before recovering modestly to 2025. Cheese prices maintain a significant premium over other dairy products, owing to strong demand in both developing and developed economies.
Fish prices are projected to decline in the short-term, then stabilise. The tightening constraints of capture fisheries compared to the vastly expanding aquaculture are reflected in the projected prices. The average price for fish caught in the wild is expected to be stronger than that of farmed fish.
The world ethanol price is projected to increase at a faster rate than most other agricultural commodities, reflecting the faster recovery of the crude oil price. However, upward price pressure will be constrained by relatively modest global import demand and strong export potential from the United States and Brazil. Biodiesel prices are closely linked to the vegetable oil prices. Demand for biodiesel is mostly driven by policies, which supports prices of both vegetable oil and biodiesel. However, the end result is that prices do not rise as strongly as for ethanol.
World cotton inventories have reached over 80% of annual consumption. Due to this current over-supply in the market, prices are projected to decrease between 2016 and 2018 and to increase thereafter. These price increases are limited by the increasing competition with man-made fibres and will be strongly influenced by China’s future cotton policy.
Modest changes in real prices for most agricultural commodities
International reference prices for agricultural commodities provide guidance to global markets. These signals are transmitted to producers and consumers in the individual countries and influence their market decisions. The transmission of these signals depends on the integration of the domestic markets into the world market. Ultimately, domestic markets react to real domestic prices. Their trend may differ from the global price signal because of real exchange rate movements, and domestic market conditions and policies.
When evaluated in constant US dollars, international reference prices will not divert significantly from their current levels over the next ten years. Globally, both production and demand growth are projected to slow, implying a broadly neutral price path. The overall expectation is that real prices will still remain slightly higher than in the years before the 2007-08 price spike.
Real price trends of individual commodities depend on their particular supply and demand situation. Figure 1.15 shows the average annual change in real international reference prices over the projection period. Globally, the impetus for lower commodity prices comes from a combination of supply and demand factors. On the supply side, yields are assumed to grow at current trends. In the most productive economies, it becomes progressively more difficult to push the technological frontier outwards. On the other hand, in developing countries there is continued scope for yield catch up via more efficient farming practices. Improvements in Asia and Latin America are crucial for the global supply expansion. On the demand side, population growth is slowing, so too is income growth in developing countries, where consumers also have a declining propensity to spend their income gains on food.
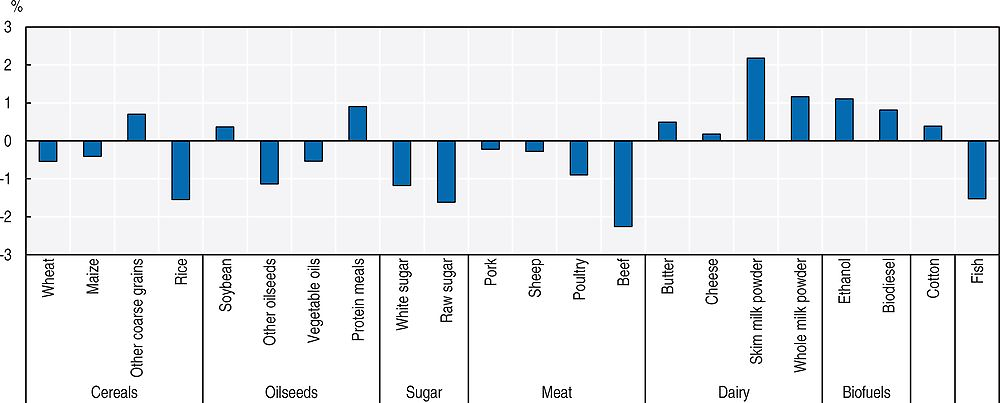
Source: OECD/FAO (2016), “OECD-FAO Agricultural Outlook”, OECD Agriculture statistics (database), https://doi.org/10.1787/agr-data-en.
Cereal prices, with the exception of other coarse grains, are projected to decline in real terms. Meat prices will trend moderately downward based on a slower demand growth and fast industrialisation of production. The comparably stronger demand for dairy products and required costly expansion of production capacity push prices for dairy products higher over the next ten years. Rising import demand, particularly from Asia and Africa, supports a recovery in milk powder prices from recent lows. Biofuel prices follow the crude oil and feedstock price trends.
The long-term trend for agricultural prices can be difficult to discern and depends on the historical perspective. For example, prices are projected to be structurally higher than in the decade before the 2007-08 price spike, but not inconsistent with a very long-term trend for declining real prices (Figure 1.16). Over the past 100 years, wheat prices have declined by an average of 1.5% per year in real terms. While the broad tendency over the past century has been for prices to decline, markets have been subject to shocks (wars, political crises and natural disasters) that caused periods of rising prices and high volatility. The magnitude of these shocks has been declining over time due to improvements in the resilience of production and the globalisation of trade. Similar patterns are evident across other commodities.
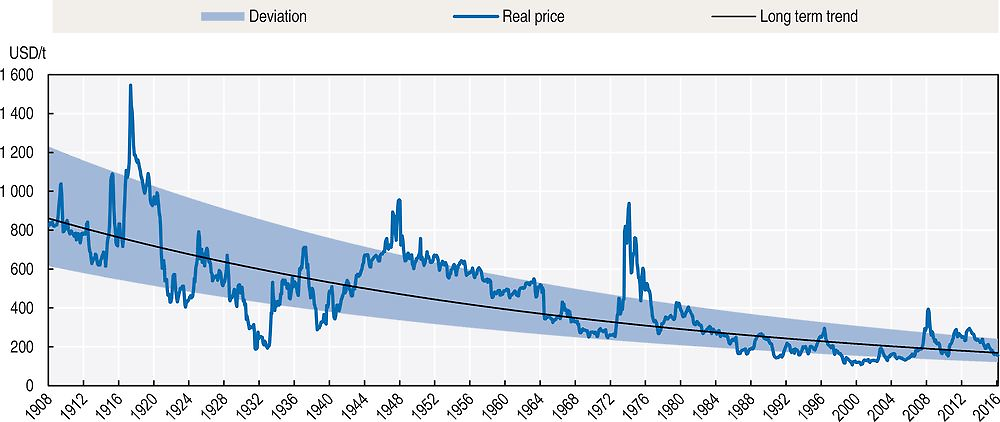
Note: Deviation refers to 1 standard deviation above and below the trend line. Assuming the distribution of error terms is normal then 68% of visualisations should occur within this range.
Source: Monthly “Wheat price received” from USDA quickstats. Deflated using monthly CPI data from www.bls.gov/data/.
The baseline projections in the Outlook assume a stable market environment. In order to examine the sensitivity of the projections to the variability in macro-economic conditions and yield fluctuations, a complementary uncertainty analysis is performed. This analysis accounts for potential variability in economic growth, exchange rates, yields and oil prices, with future variability of these elements assumed to be the same as in the past. Other sources of variability, such as animal diseases or policy changes, are not considered. Climate change is accounted in the analysis to the extent that it is reflected in yield trends and existing yield variability. This implies that the potential impacts of climate change in terms of shifts in production to new areas, or greater yield variability, are not included in the analysis. The wider potential implications of the recent COP21 agreement are discussed in Box 1.6.
At the COP 21 in Paris, agreement was reached on the UNFCCC1 Paris climate accord in December 2015. The Paris Agreement sets a long-term goal to contain the increase in global average temperatures to well below 2°C above pre-industrial levels and a pledge to “pursue efforts” to limit it to 1.5°C. To reach this goal, parties agreed on the need for global emissions to peak and start declining as soon as possible – recognising that this will take longer for developing countries – and to undertake rapid reductions thereafter in accordance with the best available science.
Agriculture is not directly mentioned within the agreement itself. Nevertheless, both the text and the country-level strategies for emissions reduction, which are outlined in the form of Intended Nationally Determined Contributions (INDCs), recognise the threat which climate change poses to sustainable food production and offer opportunities for agriculture to be an active part of the solution to climate change.
Relevance of the Paris Agreement for food and agriculture
Explicit reference is made within the preamble of the agreement to food security and production, which acknowledges “the fundamental priority of safeguarding food security and ending hunger, and the particular vulnerabilities of food production systems to the adverse impacts of climate change”. Moreover, Article 2 of the agreement underlines the importance of food production, clearly stating that “This agreement (…) aims to strengthen the global response to climate change (…) in a manner that does not threaten food production”.
By giving governments the freedom to decide exactly which emission sources to address, the agreement does not rule out mitigation in agriculture. Article 4.1, for example, states governments’ aim to “achieve a balance between anthropogenic emissions by sources and removals by sinks of greenhouse gases in the second half of this century”. Reference is made in Article 5.1 to carbon sinks which should be conserved and enhanced.
Where adaptation is concerned, the agreement outlines numerous government actions to strengthen societies’ ability to deal with the impacts of climate change and to provide continued and enhanced international support for adaptation to developing countries. These include financial support by developed countries, such as the ongoing collective goal to mobilise USD 100 bln per year until 2025 for adaptation and mitigation in developing regions, a figure which should be increased from 2025 onwards.
Intended Nationally Determined Contributions (INDCs)
Beyond the agreement itself, a number of the INDCs make reference to agriculture and food production. Of the 133 INDCs analysed by the Consultative Group of International Agricultural Research (CGIAR) in late November 2015, agricultural adaptation was referred to in 102 (94 of which included at least one adaptation measure), and targets related to agricultural mitigation were included in 103 (84 of which specified at least one mitigation measure).2 Agricultural water management was included in 83 submissions, while forestry featured in 153 INDCs.
The application of the INDCs will be supported by the Lima-Paris Action Agenda (LPAA). The LPAA features five major initiatives concerning agriculture. Initiatives include the 4 per 1000 Initiative: Soils for Food Security and Climate, launched by state and non-state partners, which aims to protect and increase carbon stocks in soils, and the Adaptation for Smallholder Agriculture Program (ASAP), which intends to increase the climate resilience and food security of smallholder farmers.
← 1. United Nations Framework Convention on Climate Change.
← 2. CGIAR, Research Program on Climate Change, Agriculture and Food Security, and CCAFS (November 2015), https://cgspace.cgiar.org/rest/bitstreams/62364/retrieve.
Results of the uncertainty analysis are illustrated for two commodities in Figure 1.17, which shows the evolution of the nominal prices of maize and pork meat, together with the variation around the baseline. Yield uncertainty is assumed to be constant over time, whereas macro-economic uncertainty accumulates over time. This results in the overall uncertainty tending to be greater towards the end of the projection period. The impact of yield uncertainty and macro-economic uncertainty varies by commodity, with macro-economic uncertainty overall exerting a larger influence on prices than yield variation. For meat and dairy products, the effect of crop yield uncertainty on world market prices is very low compared to macro-economic uncertainty.
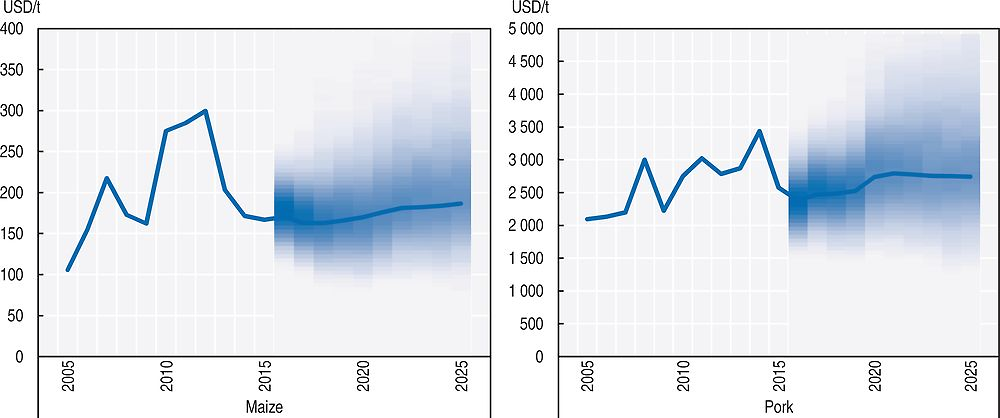
Source: OECD/FAO (2016), “OECD-FAO Agricultural Outlook”, OECD Agriculture statistics (database), https://doi.org/10.1787/agr-data-en.
Food consumer prices likely to exert less volatility than agricultural producer prices
The OECD-FAO Agricultural Outlook projects the evolution, for major agricultural commodities, of prices at the producer and final consumer levels over the medium-term. The representation of consumer prices in the current Outlook has been modified to better reflect the process of food price formation along the food chain and the fact that margins between producer and consumer prices vary across commodities and countries. The modelling of final food consumer prices takes into account the evolution of agricultural prices, the determinants of margins (in the form of labour and transportation costs) and of the ability of consumers to substitute among food products. Overall, margins are projected to increase over the projection period for most countries and commodities, implying that the ratio of the producer price to the consumer price declines. This is because other costs (for fuel and transformation) increase more rapidly than producer prices.
As an illustration, Figure 1.18 presents the historical and the projected evolution of aggregate PPI and CPI measures for a selection of countries and regions.2 Between 2005 and 2015, PPI growth exceeded CPI growth, except in the European Union. Over the last decade, the variability of PPI measures has been higher than the variability of food CPI measures. Stochastic analysis suggests that this will continue over the next ten years, as illustrated for the case of Mexico (Figure 1.19). Future editions of the OECD-FAO Agricultural Outlook will explore the relationships between producer and consumer prices in more detail.
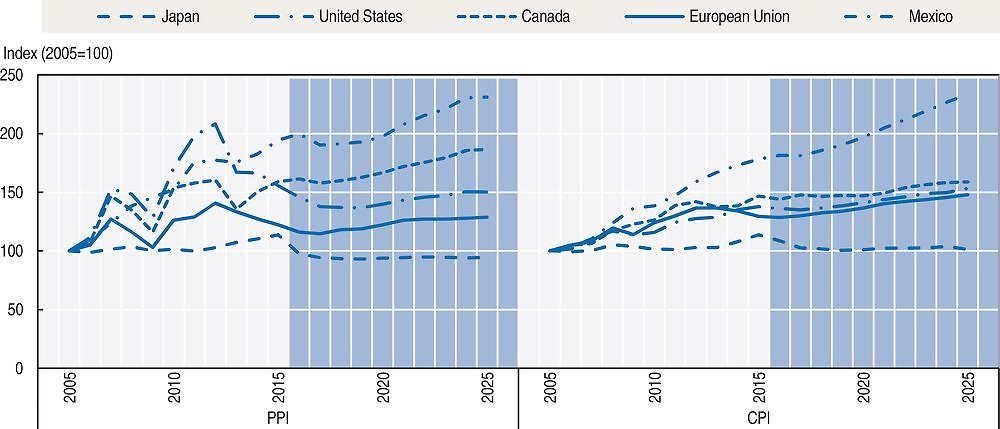
Source: OECD/FAO (2016), “OECD-FAO Agricultural Outlook”, OECD Agriculture statistics (database), https://doi.org/10.1787/agr-data-en.
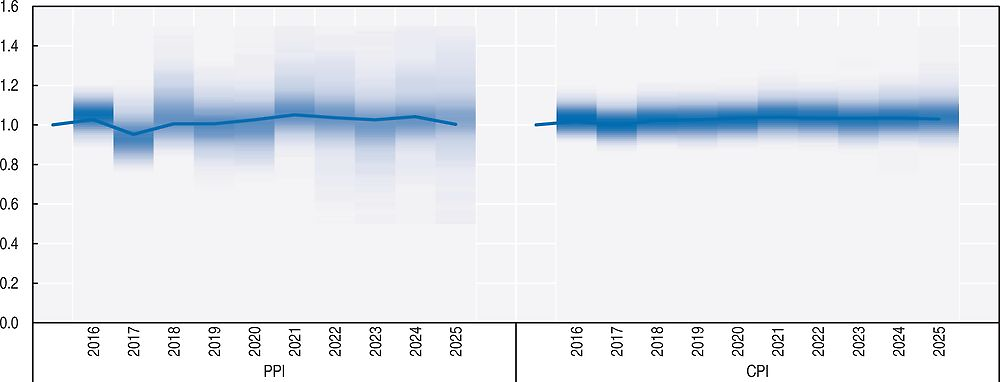
Note: The PPI and CPI measures of yearly variability are assessed by computing the ratio of the measure in year t over the same measure in year t-1. The darker shade around CPI variability measure suggests lower variability.
Source: OECD/FAO (2016), “OECD-FAO Agricultural Outlook”, OECD Agriculture statistics (database), https://doi.org/10.1787/agr-data-en.
Conclusion
Over time, the share of raw product value in retail food products has declined. This trend is projected to continue over the next ten years. At the same time, farm prices will remain more volatile than consumer prices due to several factors including weather-dependency (crops) and long production cycles (livestock).
The continued demand for agricultural commodities is projected to be met by efficiency gains in production which will keep real agricultural prices relatively flat. Nevertheless, there will be some relative price changes reflecting changes in the composition of demand and supply constraints. Thus, livestock prices are projected to rise relative to crop prices, and the prices of coarse grains and oilseeds are projected to rise relative to the prices of food staples. Those structural trends are likely to be more apparent in the current context of low prices across all commodity groups.
Reference
OECD (2015), Aglink-Cosimo model documentation, www.agri-outlook.org/abouttheoutlook/Aglink-Cosimo-model-documentation-2015.pdf
Note
← 1. The statistical data for Israel are supplied by and under the responsibility of the relevant Israeli authorities. The use of such data by the OECD is without prejudice to the status of the Golan Heights, East Jerusalem and Israeli settlements in the West Bank under the terms of international law.
The position of the United Nations on the question of Jerusalem is contained in General Assembly Resolution 181(II) of 29 November 1947, and subsequent resolutions of the General Assembly and the Security Council concerning this question.
← 2. Aggregate measures of Producer Price Indices (PPI) and Consumer Price Indices (CPI) have been computed on the complete Outlook database with weights determined on the basis of production and consumptions shares respectively.