Chapter 3. 2017 Tax burdens
The 2017 tax burden results based on the eight model family types are presented in Tables 3.1 to 3.11 and Figures 3.1 to 3.7. The model family types vary by marital status, number of children and economic status: single taxpayers, without children, earning 67%, 100% and 167% of the average wage (AW); a single parent, with two children, earning 67% of the AW; a single earner couple at the AW level with two children; two-earner couples at 133% and 167% of the AW with two children; and a two-earner couple, without children, at 133% of the AW.
The chapter presents different measures for the average tax burdens (tax wedge, personal tax rate, net personal tax rate, personal income tax rate and employee social security contribution rate) and marginal rates (tax wedge and net personal tax rate). The results for two measures of tax progressivity are also considered: tax elasticity on gross earnings and labour costs.
The statistical data for Israel are supplied by and under the responsibility of the relevant Israeli authorities. The use of such data by the OECD is without prejudice to the status of the Golan Heights, East Jerusalem and Israeli settlements in the West Bank under the terms of international law.
Average tax burdens
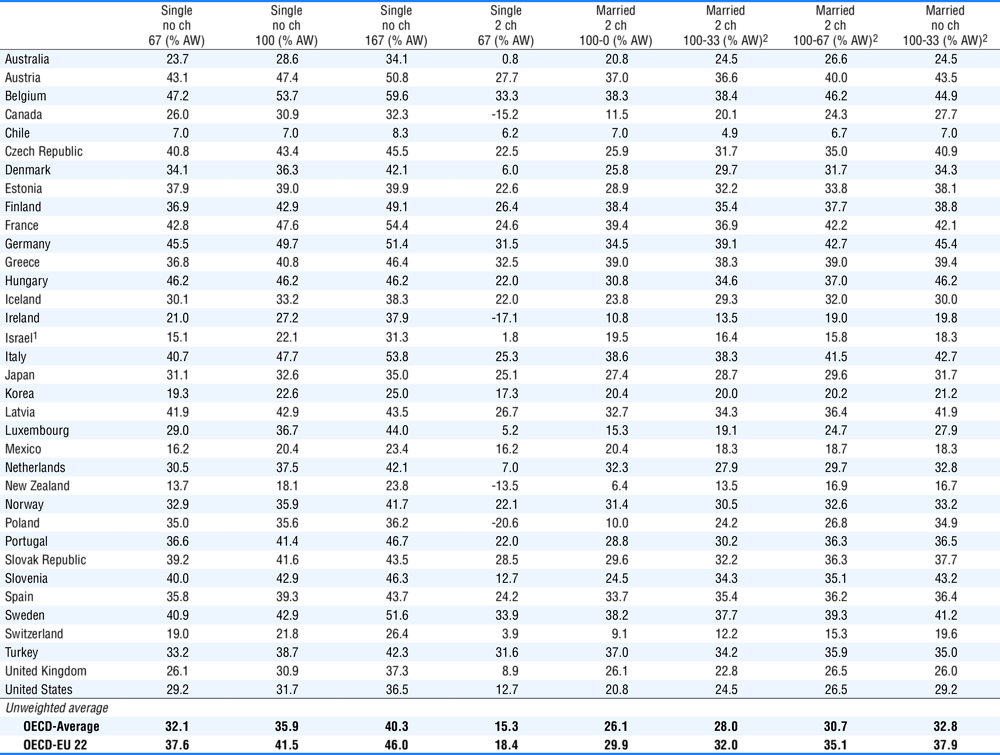
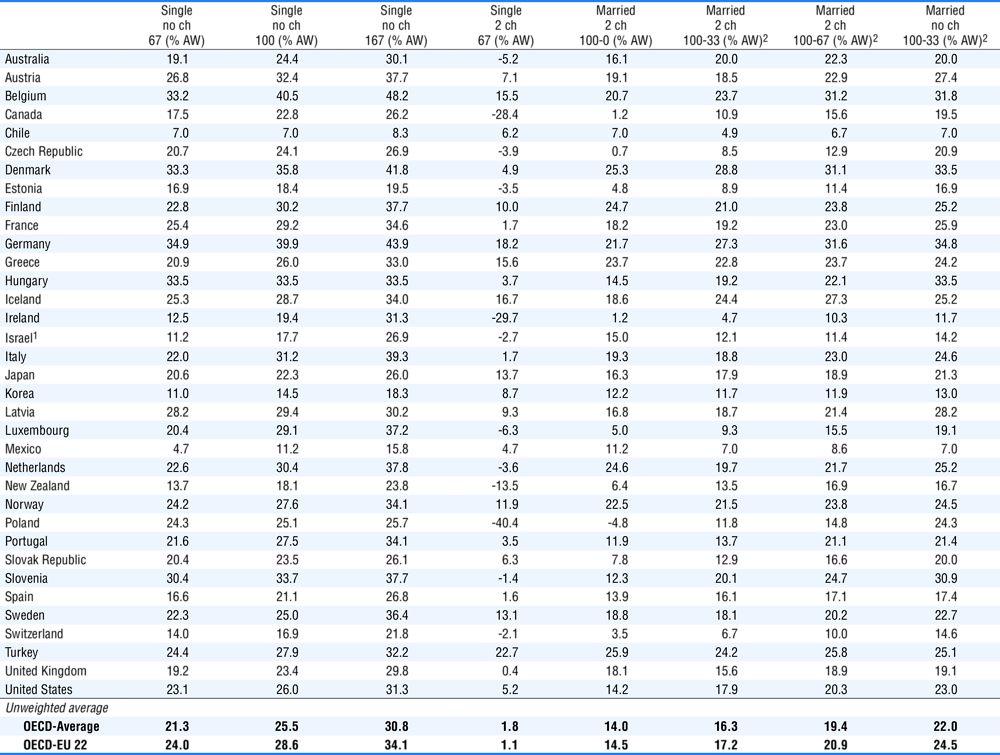
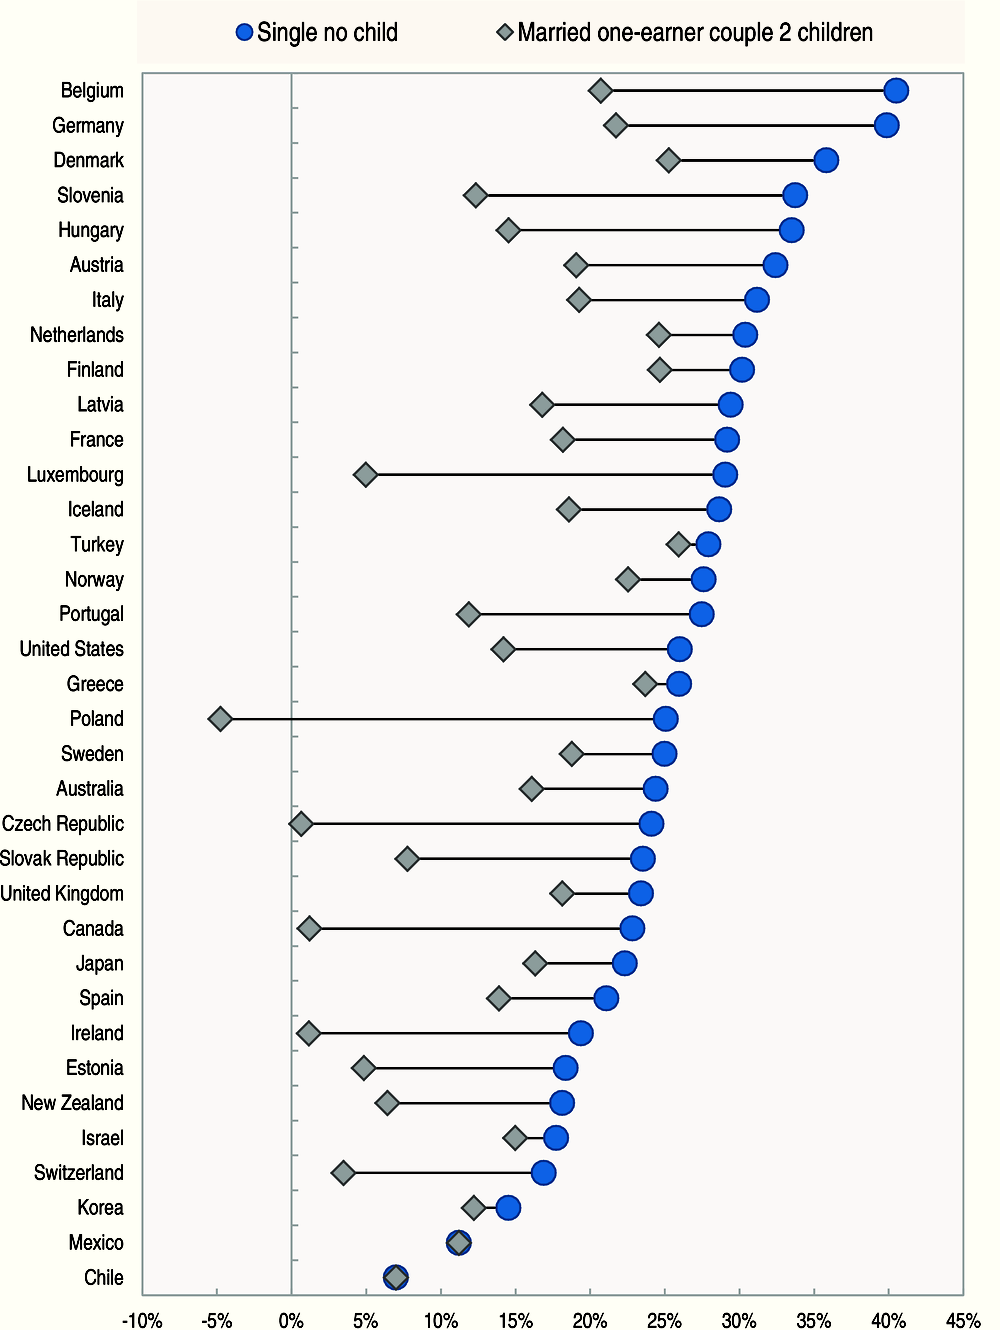
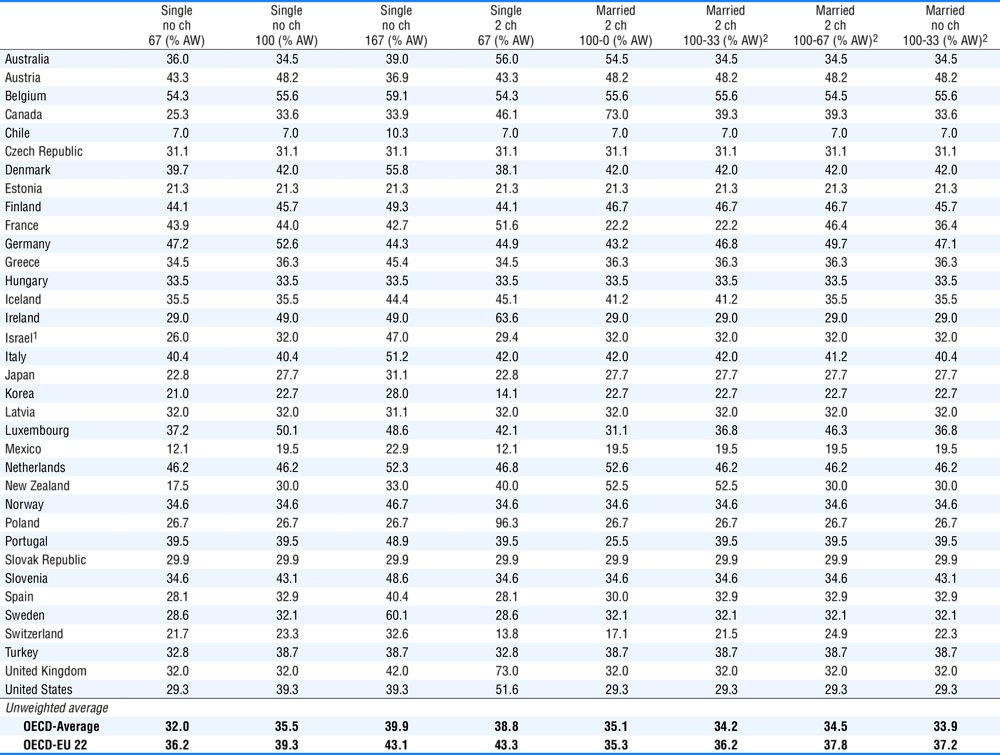
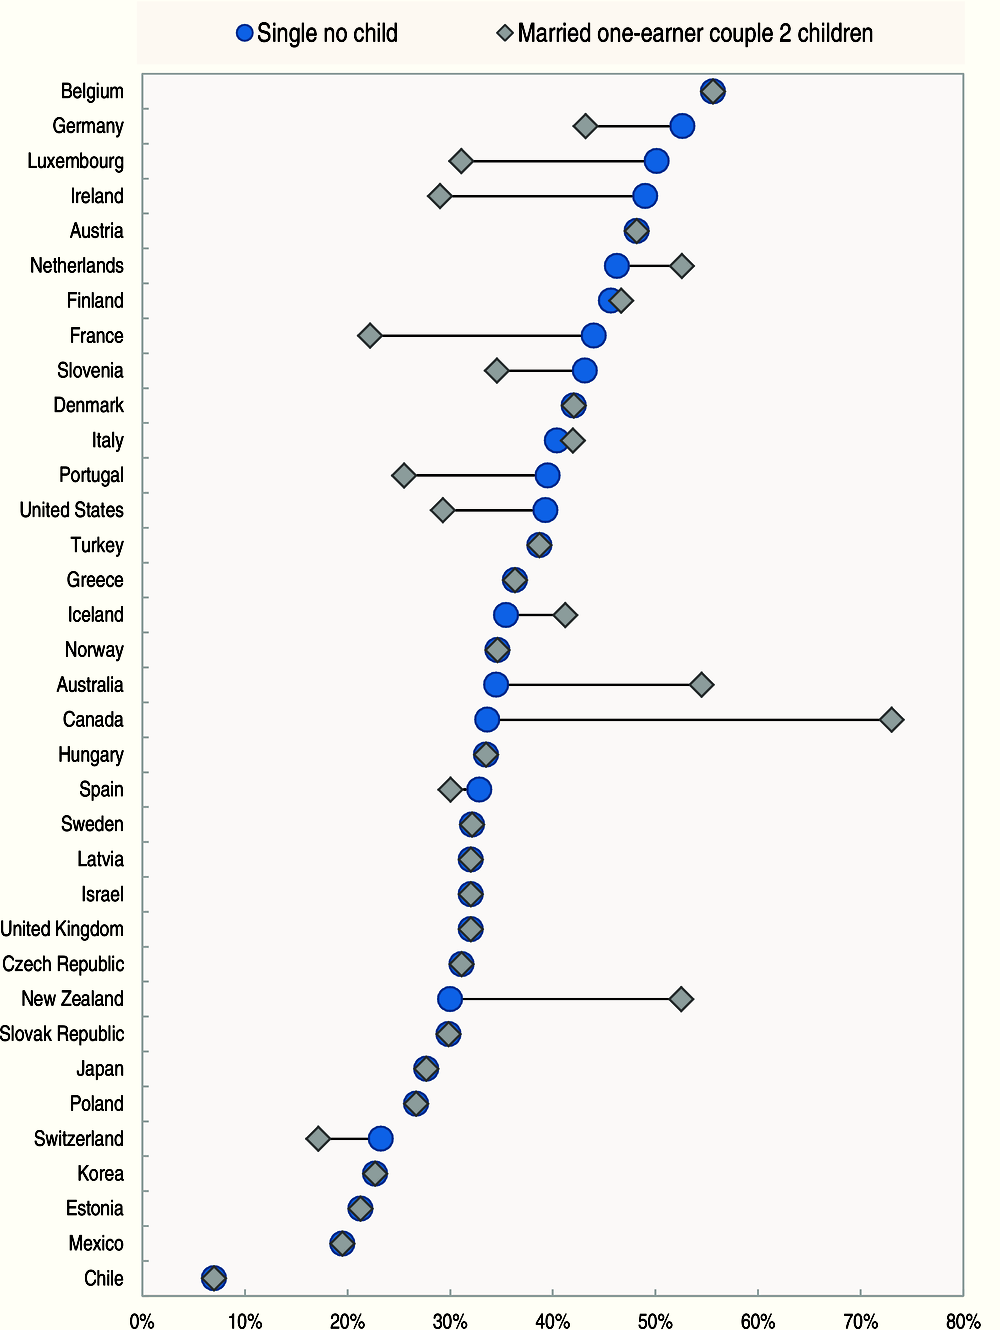
Table 3.1 and Figure 3.1 show the average tax wedge (combined burden of income tax, employee and employer social security contributions) taking into account the amount of cash benefits each specific family type is entitled to. Total taxes due minus transfers received are expressed as a percentage of total labour costs, defined as gross wage plus employers’ social security contributions (including payroll taxes). In the case of a single person on average wage the tax wedge ranges from 7.0% (Chile) and 18.1% (New Zealand) to 49.7% (Germany) and 53.7% (Belgium). For a one-earner married couple, with two children, at the same wage level the tax wedge is lowest in New Zealand (6.4%) and Chile (7.0%) and highest in France (39.4%) and Greece (39.0%). As stated in Chapter 1, the tax wedge tends to be lower for a married couple, with two-children, at this wage level than for a single individual without children due to both receipt of cash benefits and/or more advantageous tax treatment. It is also interesting to note that the tax wedge for a single parent, with two children, earning 67% of the average wage is negative in New Zealand (-13.5%), Canada (-15.2%), Ireland (-17.1%) and Poland (-20.6%). This is due to the amount of cash benefits received by these families plus any applicable non-wastable tax credits that exceed the sum of the total tax and social security contributions that are due.
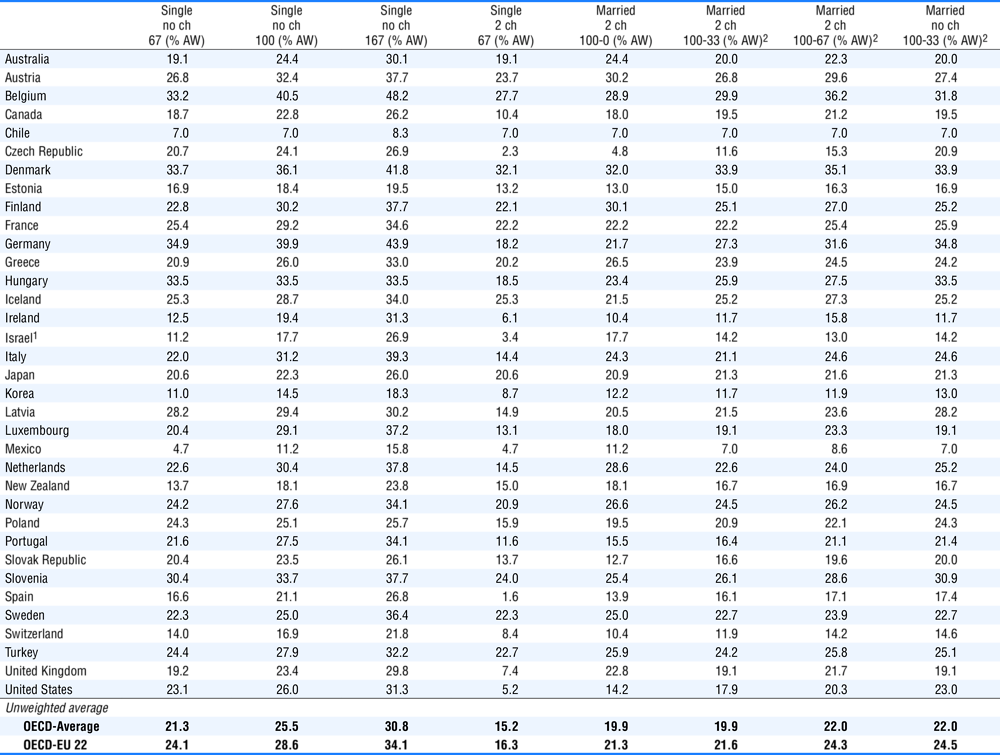
Table 3.2 and Figure 3.2 present the combined burden of the personal income tax and employee social security contributions, expressed as a percentage of gross wage earnings (the corresponding measures for income tax and employee contributions separately are shown in Tables 3.4 and 3.5). A single person at the average wage level without children has an average tax plus contributions burden of more than 40% only in Belgium (40.5%). The lowest average rates were in Chile (7.0%), Mexico (11.2%), Korea (14.5%), Switzerland (16.9%), Israel (17.7%), New Zealand (18.1%), Estonia (18.4%) and Ireland (19.4%).
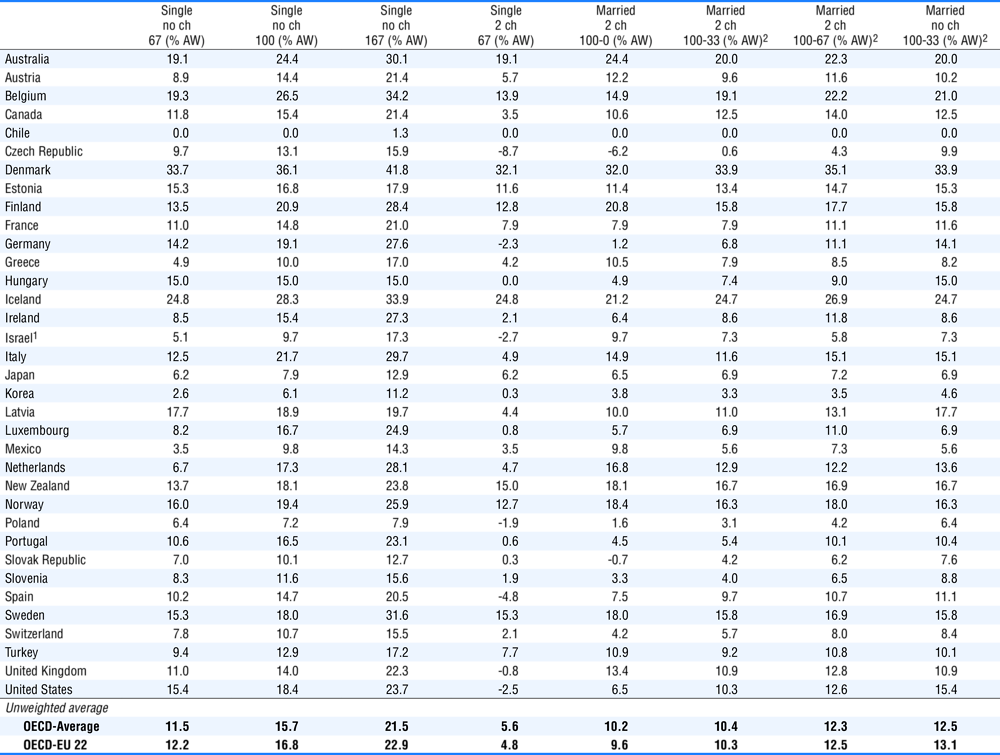
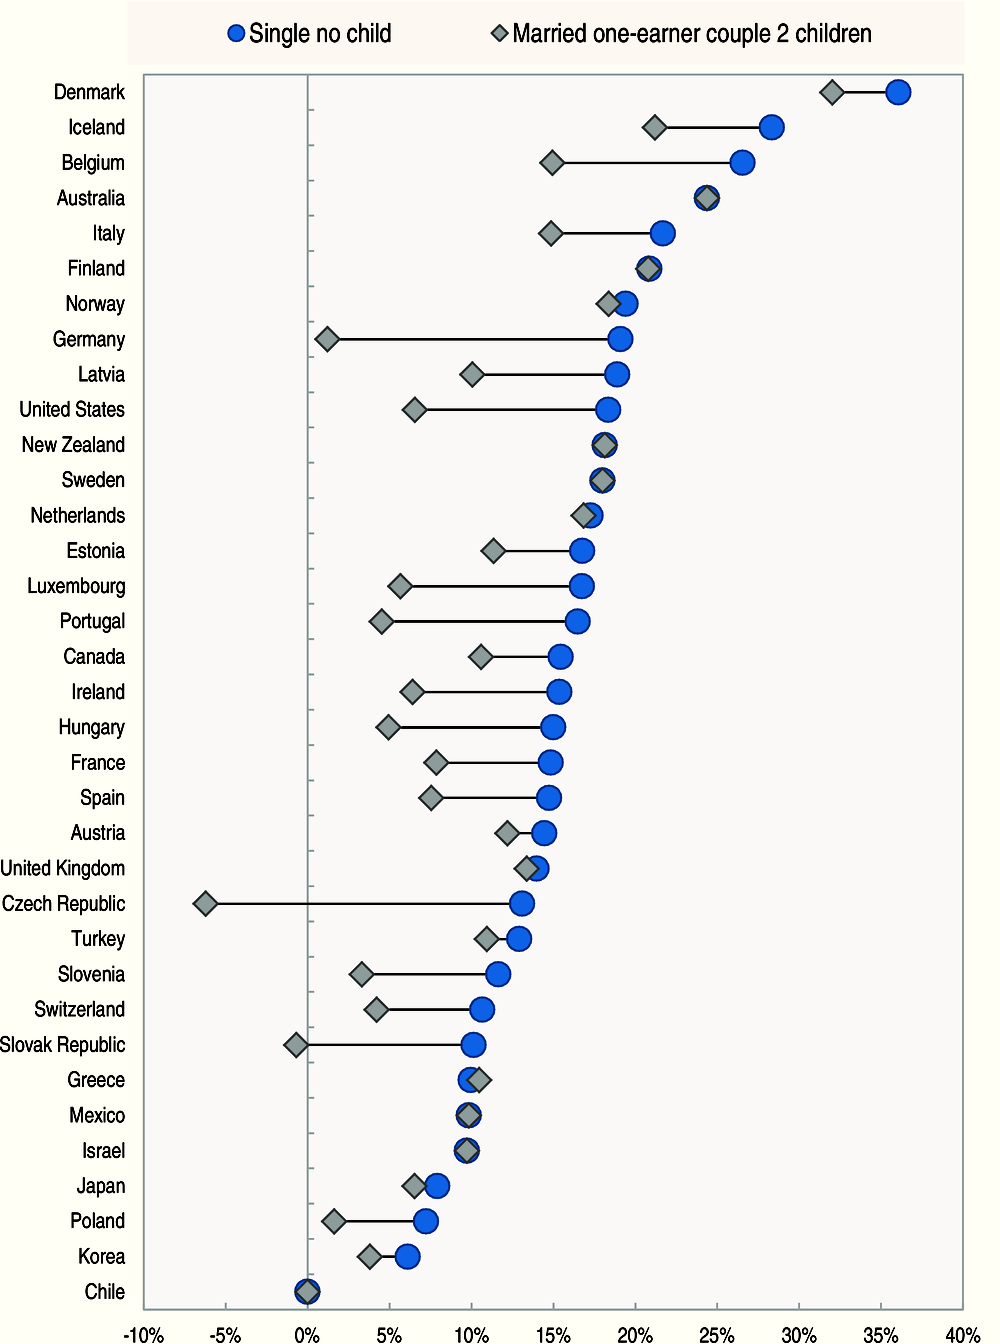
Table 3.3 shows the combined burden of income tax and employee social security contributions, reduced by the entitlement to cash benefits, for each family-type. Figure 3.3 illustrates this burden for single individuals without children and one-earner married couples with two children, with both family types on average earnings. Comparing Tables 3.2 and 3.3, the average tax rates for families with children (columns 4 -7) are lower in Table 3.3 because most OECD countries support families with children through cash benefits.
A lower burden is also observed for a single individual, without children, at 67% of the average wage in Canada because of a cash transfer paid to mitigate the burden imposed by the federal consumption tax (i.e. the Goods and Services Tax Credit; further details can be found in the country chapter contained in Part III of this Report). The same is true in Denmark for single taxpayers at 67% and 100% of the average wage and two-earner married couples, without children, at 133% of the average wage who receive a Green Check to compensate for increased environmental taxes.
Comparing Tables 3.2 and 3.3, for single parents, with two children, earning 67% of the average wage, 29 countries provide cash benefits. In Poland, Canada and Ireland these represent respectively 56.3%, 38.9% and 35.8% of income and they are at least 25% of income in three other countries: New Zealand (28.6%), Denmark (27.2%) and Slovenia (25.3%). 28 countries provide benefits for a one-earner married couple, with two children, earning the average wage level, although these are less generous relative to income, ranging up to 24.3% (Poland). The lower level of cash benefits for the married couple can be attributed to three reasons: single parents may be eligible for more generous treatment; the benefits themselves may be fixed in absolute amount; or the benefits may be subject to income testing.
Table 3.4 shows personal income tax due as a percentage of gross wage earnings. For single persons, without children, at the average wage (column 2) – the income tax burden varies between 0% (Chile) and 36.1% (Denmark). In most OECD member countries, at the average wage level, the income tax burden for one-earner married couples with two children is substantially lower than that faced by single persons (compare columns 2 and 5). These differences are clearly illustrated in Figure 3.4. In eleven OECD countries, the income tax burden faced by a one-earner married couple with two children is less than half that faced by a single individual (the Czech Republic, Germany, Hungary, Ireland, Luxembourg, Poland, Portugal, the Slovak Republic, Slovenia, Switzerland and the United States). In contrast, there is no difference in six countries – Australia, Chile, Israel, Mexico, New Zealand and Sweden. In Finland, the average personal income tax rate for the single worker was one tenth of a percentage point higher than for the one-earner married couple.
There are only two OECD member countries where a married average worker with two children has a negative personal income tax burden. This is due to the presence of non-wastable tax credits, whereby credits are paid in excess of the taxes otherwise due. This results in tax burdens of -6.2% in the Czech Republic and -0.7% in the Slovak Republic. Similarly, single parents, with two children, earning 67% of the average wage show a negative tax burden in seven countries – the Czech Republic, Germany, Israel, Poland, Spain, the United Kingdom and the United States –. In two other countries – Chile and Hungary – this family-type pays no income tax.
A comparison of columns 5 and 6 in Table 3.4 demonstrates that if the second spouse has a job which pays 33% of the average wage, the income tax burden of the family (now expressed as 133% of the average wage) is slightly higher in nineteen countries, the largest differences being in the Czech Republic (6.8 percentage points) and Germany (5.6 percentage points). At the same time, the income tax burden is lower in fourteen countries, the largest differences being in Finland (-5.0 percentage points), Australia (-4.4 percentage points) and Mexico (-4.2 percentage points). There is no impact on the tax burden in Chile and France.
An important consideration in the design of an income tax is the level of progressivity – the rate at which the income tax burden increases with income. A comparison of columns 1 to 3 in Table 3.4 provides an insight into the levels of progressivity in the income tax systems of OECD countries. Comparing the income tax burden of single individuals at the average wage level with their counterparts at 167% of the average wage (columns 2 and 3), the lower paid worker faces a lower tax burden in all countries except in Hungary. There, a flat tax rate is applied on labour income and all households without children pay the same percentage of income tax. The same is true for single individuals at 67% of the average wage level compared with their counterparts at the average wage level, with an additional exception in Chile where neither pay income tax. Finally the burden faced by single individuals at 67% of the average wage level represents less than 25% of the burden faced by their counterparts at 167% in four OECD countries: Chile (0%), Korea (23%), Mexico and the Netherlands (both 24%).
The addition of social security contributions to the average tax rate reduces this progressivity as well as the proportional tax savings (i.e. tax savings of the low income workers relative to the higher income workers). When comparing Table 3.2 with Table 3.4, the OECD personal average tax burden of single individuals at 67% of the average wage level is only 31% lower than their counterparts at 167% compared to the OECD average tax savings of 46% for personal income taxes alone. The OECD average tax savings observed for one‐earner married couples with two children at the average wage level relative to the average single workers falls from 35% to 22%. These lower figures reflect that there is little variation between social security contribution rates across family types, as shown in Table 3.5.
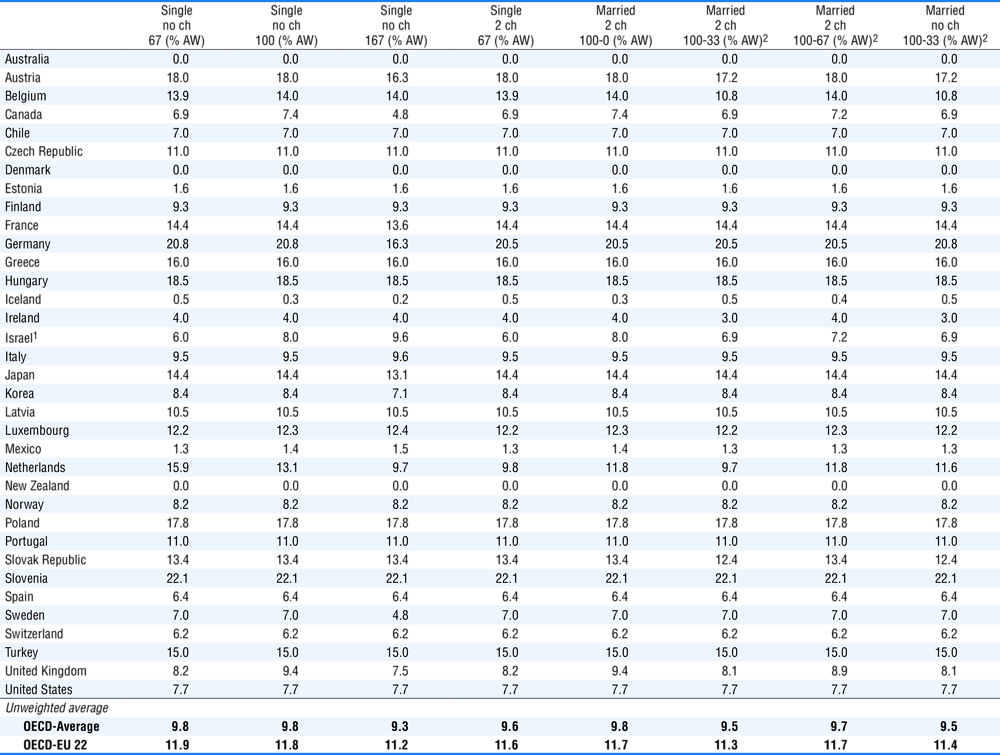
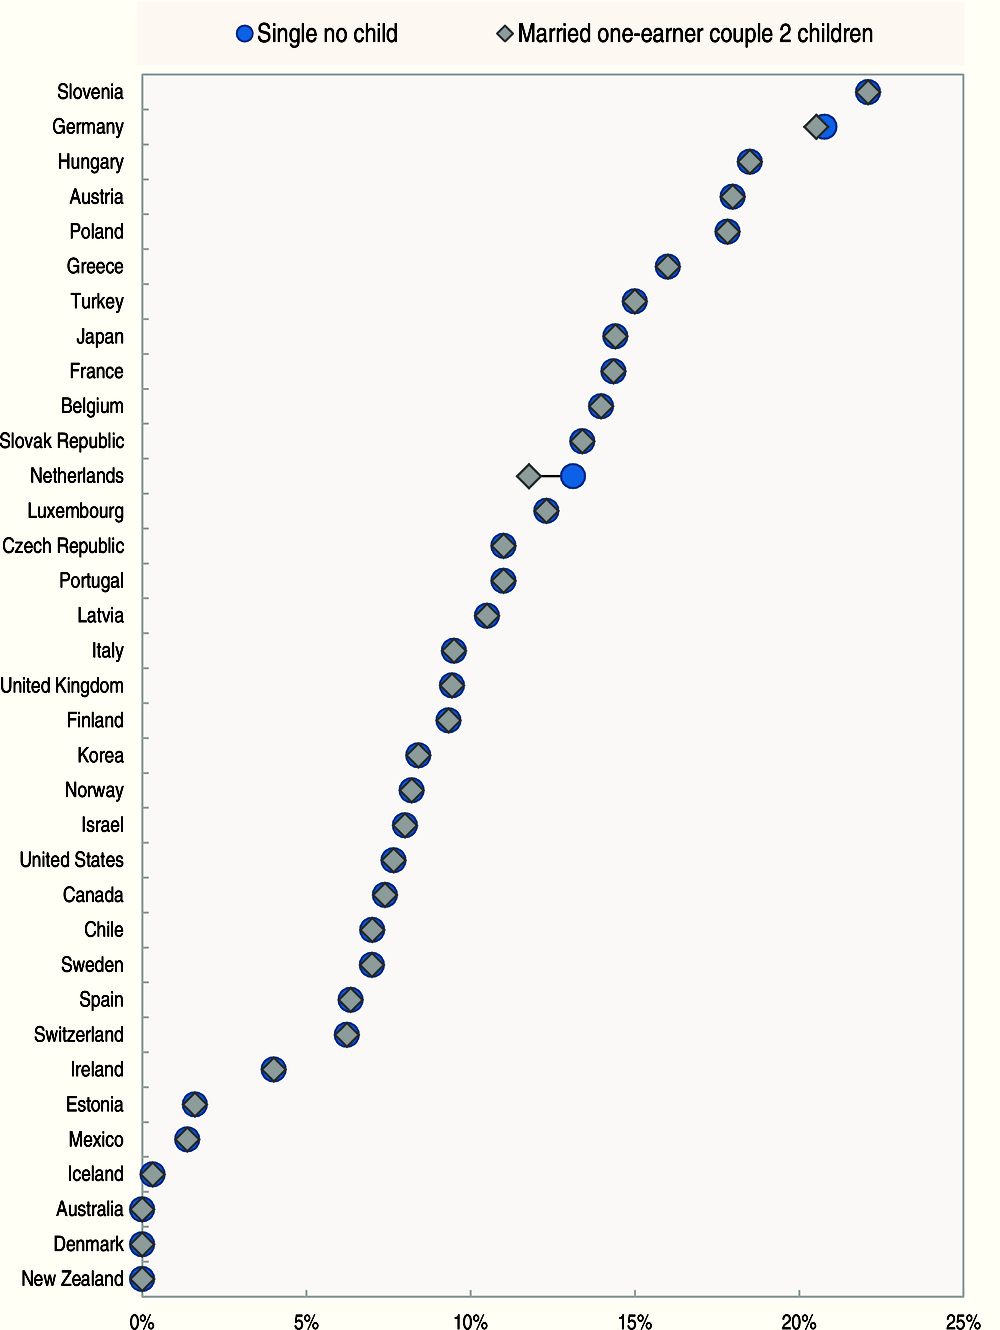
Table 3.5 shows employee social security contributions as a percentage of gross wage earnings. For a single worker without children at the average wage (column 2) the contribution rate varies between zero (Australia, Denmark and New Zealand) and 22.1% (Slovenia). Australia, Denmark and New Zealand do not levy any employee social security contributions paid to general government and there are three other countries with very low rates - Iceland (0.3%), Mexico (1.4%) and Estonia (1.6%). Social security contributions are usually levied at a flat rate on all earnings, i.e. without any exempt threshold. In a number of OECD member countries a ceiling applies. However, this ceiling usually applies to wage levels higher than 167% of the average wage. The flat rates result in a constant average burden of employee social security contributions for most countries between 33% and 167% of average wage earnings. Some examples of a constant proportional burden for employee social security contributions for over the eight model family types, are (in decreasing order of rates) Slovenia (22.1%), Hungary (18.5%), Poland (17.8%), Greece (16.0%), Turkey (15.0%), the Czech Republic and Portugal (11.0%), Latvia (10.5%), Finland (9.3%), Norway (8.2%), the United States (7.7%), Chile (7.0%), Spain (6.4%), Switzerland (6.2%) and Estonia (1.6%).
In addition, at the average wage level only Germany and the Netherlands impose different burdens of social security contributions on employees according to their family status (see Figure 3.5).
Marginal tax burdens
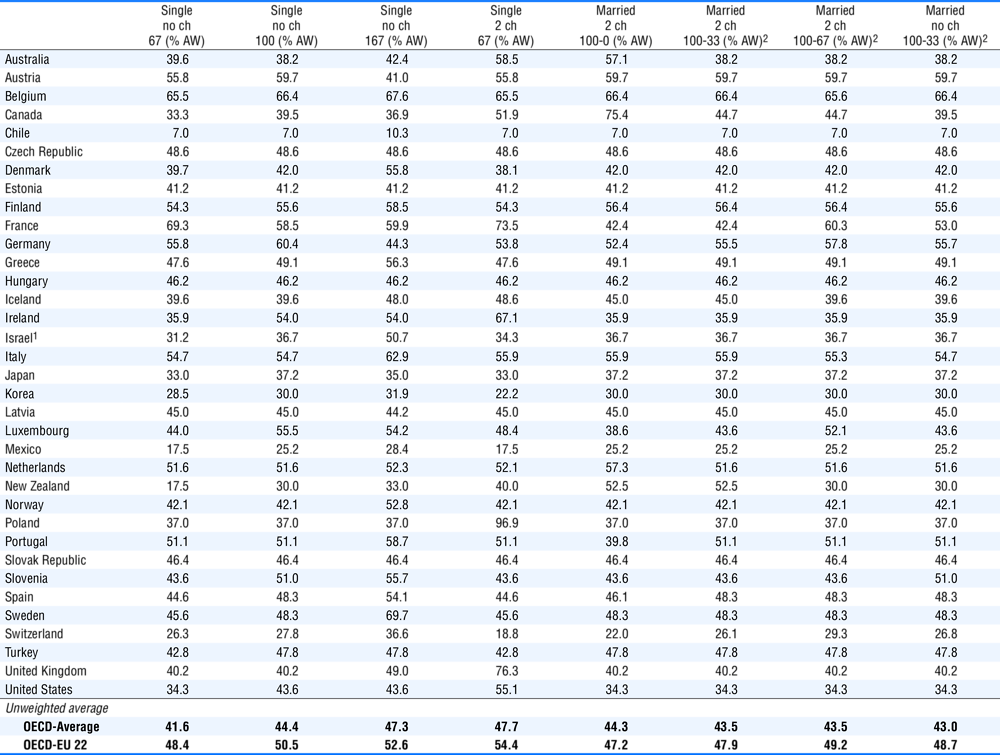
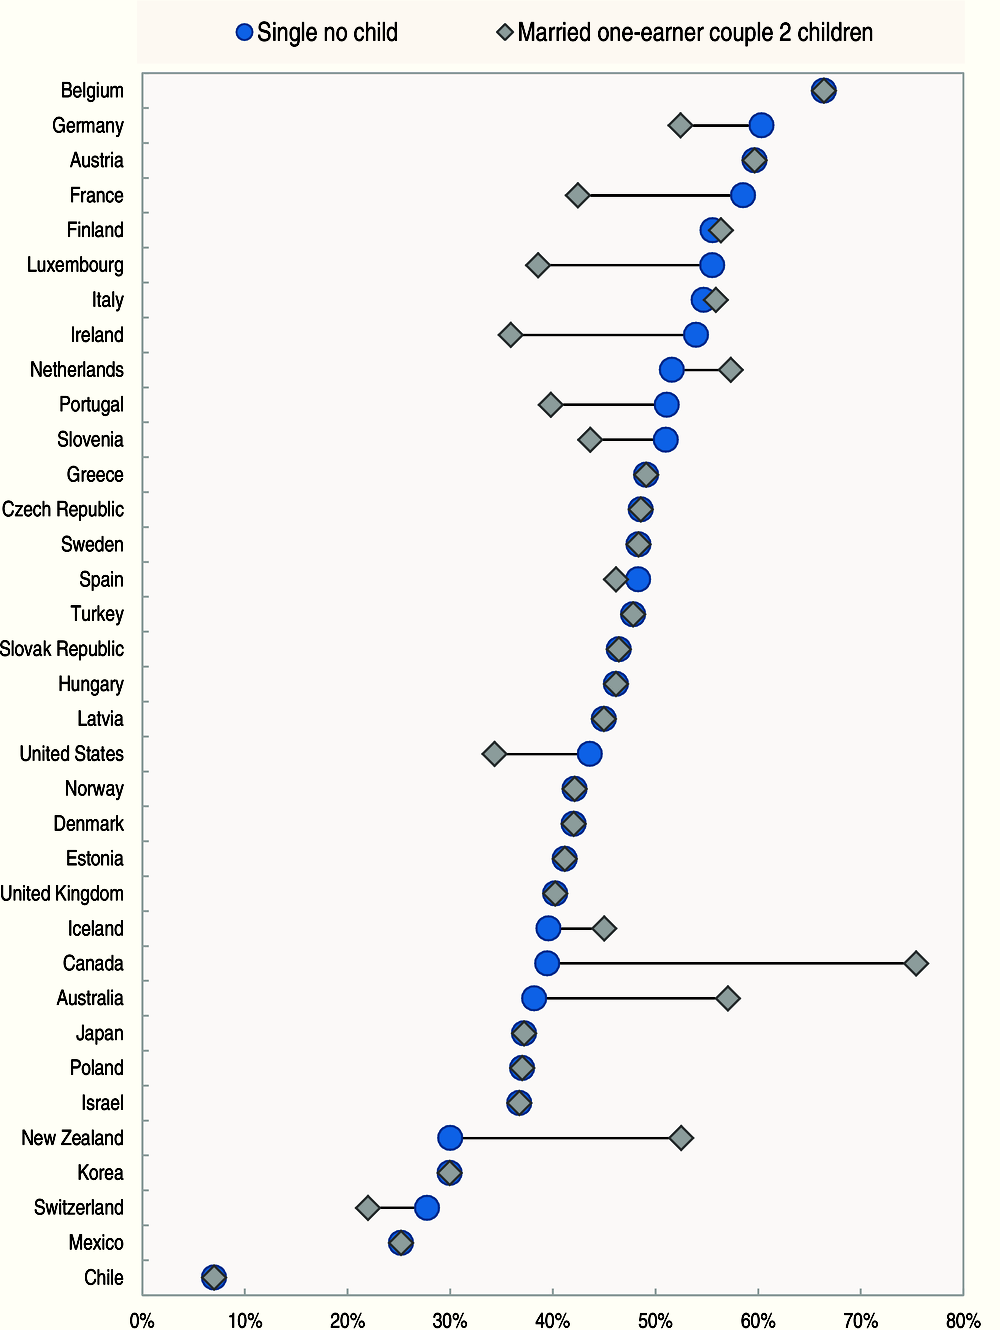
Table 3.6 and Figure 3.6 show the percentage of the marginal increase in labour costs that is deducted through the combined effect of increasing personal income tax, employee and employer (including payroll taxes) social security contributions and decreasing cash transfers. It is assumed that the gross earnings of the principal earner rise by 1 currency unit. This is the marginal tax wedge. In most cases, it absorbs 25% to 55% of an increase in labour costs for single individuals on average wage without children. However, in six OECD countries these individuals face higher marginal wedges – Belgium (66.4%), Germany (60.4%), Austria (59.7%), France (58.5%), Finland (55.6%) and Luxembourg (55.5%). Mexico (25.2%) and Chile (7.0%) have the lowest marginal tax wedge.
In twenty-two OECD member countries, the marginal tax wedge for one-earner married couples at average earnings with two children is either the same or within 5 percentage points as that for single persons at average wage earnings with no children. The marginal tax wedge is more than 5 percentage points lower for one-earner married couples in eight countries: Ireland (18.1 percentage points), Luxembourg (16.9 percentage points), France (16.1 percentage points), Portugal (11.3 percentage points), the United States (9.3 percentage points), Germany (8.0 percentage points), Slovenia (7.4 percentage points) and Switzerland (5.8 percentage points). In contrast, the marginal rate for one-earner married couples with two children is more than 5 percentage points higher than it is for single workers, with no children, in Canada (35.9 percentage points), New Zealand (22.5 percentage points), Australia (18.9 percentage points), the Netherlands (5.7 percentage points) and Iceland (5.4 percentage points). These higher marginal rates arise because of the phase out of income-tested tax reliefs and/or cash benefits. When an income-tested measure is being phased out, the reduction in the relief or benefit compounds the increase in the tax payable. These programmes are set out in greater detail in the relevant country chapters in Part III of the Report.
Table 3.7 and Figure 3.7 show the incremental change to personal income tax and employee social security contributions less cash benefits when gross wage earnings increase at the margin (it is assumed that the gross earnings of the principal earner rise by 1 currency unit). As in the case of the tax wedge, in most cases personal income tax and employee social security contributions absorb 25% to 55% of a worker’s pay rise for single individuals without children at the average wage level. The marginal tax rate for the average worker is lower than 25% only in Chile (7.0%), Mexico (19.5%), Estonia (21.3%), Korea (22.7%) and Switzerland (23.3%).
In twenty-two OECD member countries, the net marginal personal tax rate for one‐earner married couples with two children at the average wage level is either the same or within 5 percentage points as that for single persons with no children. The marginal rate is more than 5 percentage points lower for the one-earner married couples in eight countries: France (21.8 percentage points), Ireland (20.0 percentage points), Luxembourg (19.0 percentage points), Portugal (14.0 percentage points), the United States (10.0 percentage points), Germany (9.4 percentage points), Slovenia (8.5 percentage points) and Switzerland (6.2 percentage points). In contrast, the marginal rate for one-earner married couples with two children is more than 5 percentage points higher than it is for single persons with no children in Canada (39.4 percentage points), New Zealand (22.5 percentage points), Australia (20.0 percentage points), the Netherlands (6.4 percentage points) and Iceland (5.7 percentage points). Similar to the marginal tax wedges, these higher marginal rates arise because of the phase out of income-tested tax reliefs and/or cash transfers.
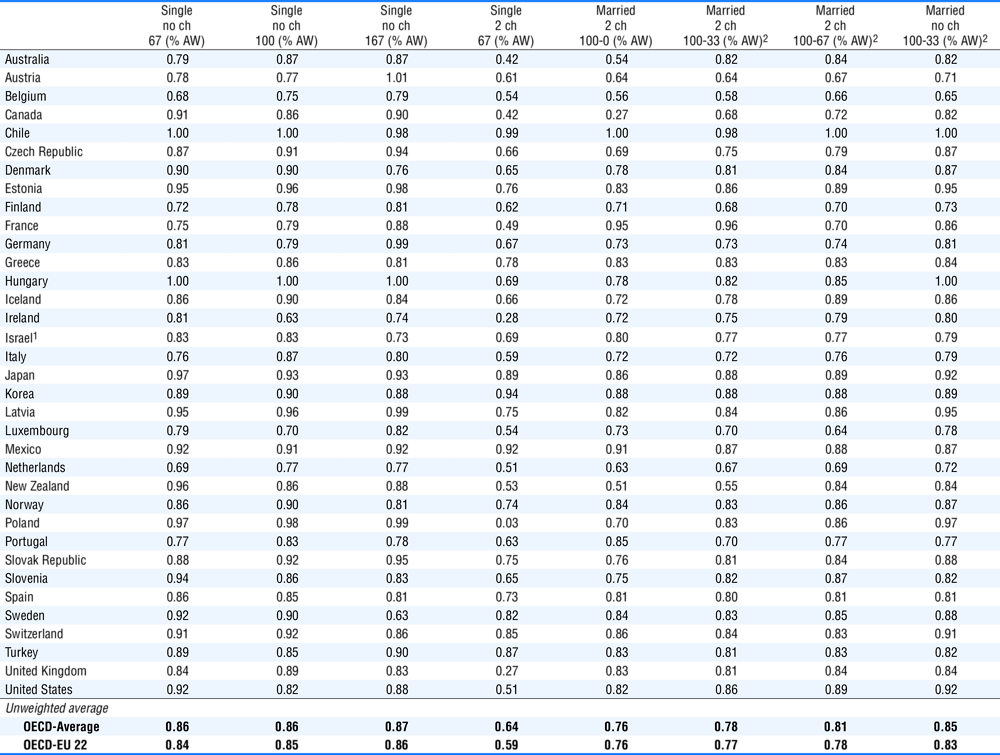
Table 3.8 shows the percentage increase in net income relative to the percentage increase in gross wages when the latter increases by 1 currency unit, i.e. the elasticity of after-tax income.1 Under a proportional tax system, net income would increase by the same percentage as the increase in gross earnings, in which case the elasticity is equal to 1. The more progressive the system is – at the income level considered – the lower this elasticity will be. In the case of the one-earner married couples, with two children, at the average wage, column 5 of Table 3.8 shows that Canada (0.27), New Zealand (0.51), Australia (0.54), and Belgium (0.56) have, on this measure, the most progressive systems of income tax plus employee social security contributions taking into account tax provisions and cash transfers for children at this income level. In contrast, Chile (1.00), France (0.95) and Mexico (0.91) either implement or are close to a proportional system of income tax plus employee social security contributions – at least for this family type.
It is interesting to note that the elasticity exceeds one for a single individual at 167% of the average earnings in Austria (1.01), indicating that the income tax system at this point in the income scale is regressive. In other words, a percentage increase in gross pay leads to an increase in net income in excess of the percentage increase in gross wage earnings.
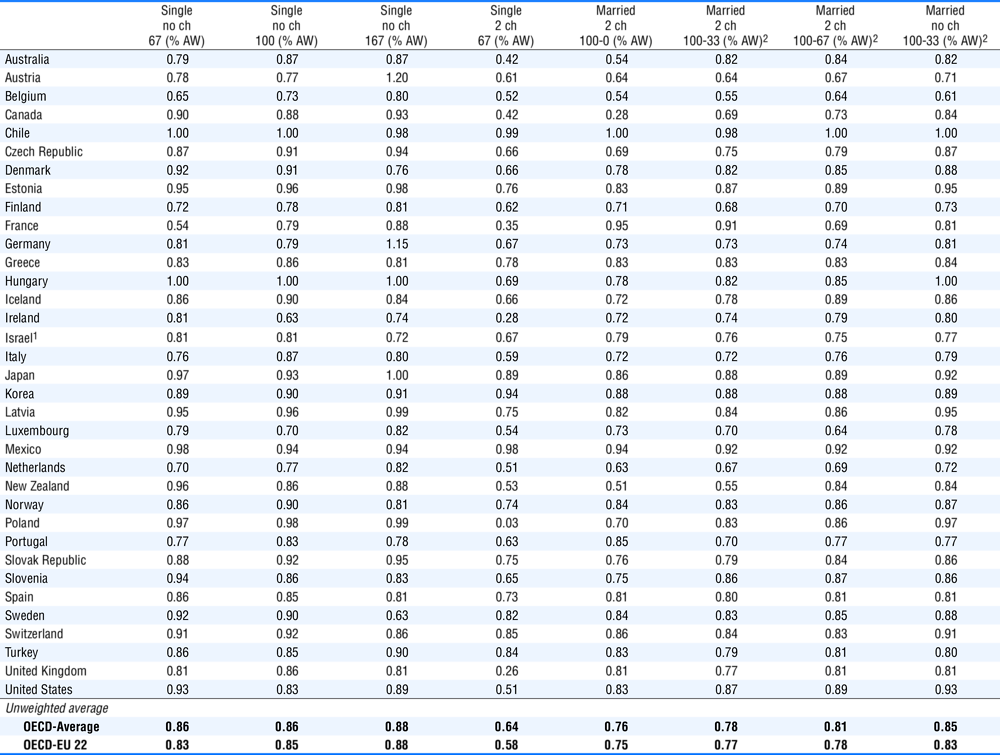
Table 3.9 provides a different elasticity measure: the percentage increase in net income relative to the percentage increase in labour costs (i.e. gross wage earnings plus employer social security contributions and payroll taxes) when the latter rises by 1 currency unit.2 In this case, taxes and social security contributions paid by employers are also part of the analysis. In more than half of the OECD member countries the value of this elasticity lies between 0.5 and 0.97 for the eight selected family-types. This elasticity is below 0.5 for single parents earning 67% of the average wage level in Australia and Canada (both 0.42), France (0.35), Ireland (0.28), the United Kingdom (0.26) and Poland (0.03) and for one-earner married couples at the average wage level with two children in Canada (0.28). In contrast, the elasticity is between 0.98 and 1.0 for all family types in Chile and some family types in Hungary, Japan, Mexico and Poland, and one family type in Estonia (single worker earning 167% of the average wage; i.e. 0.98) and Latvia (single worker earning 167% of the average wage; i.e. 0.99). Under this elasticity measure the income tax system is regressive for a single individual at 167% of average earnings in Germany (1.15) and Austria (1.20).
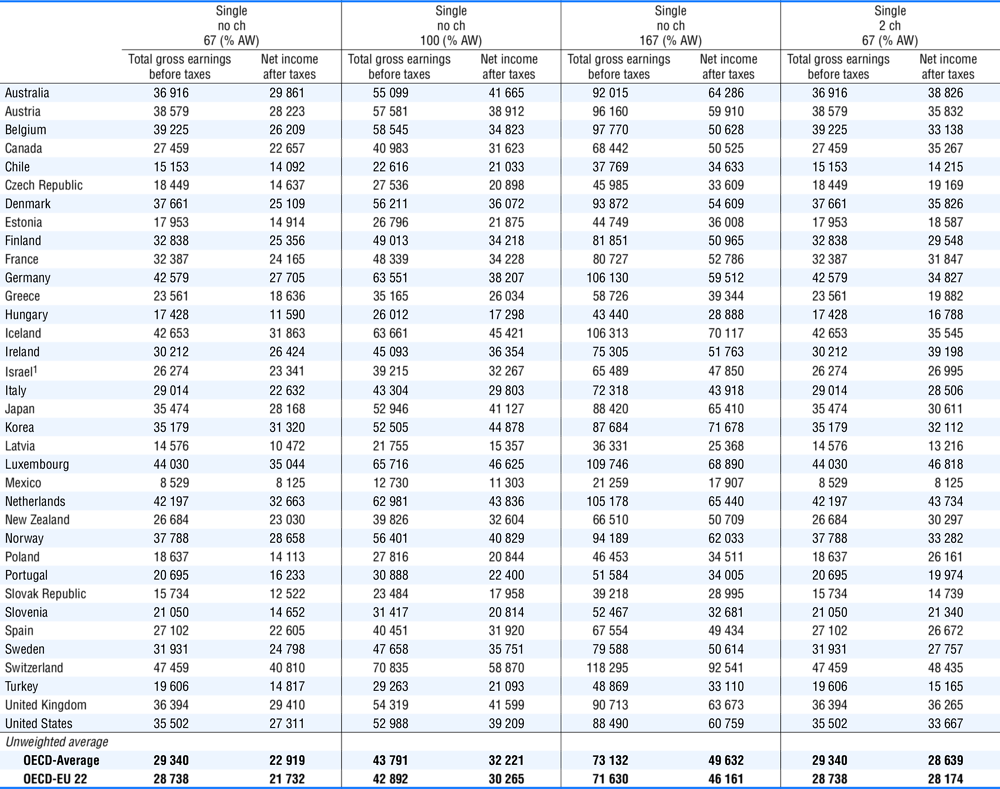
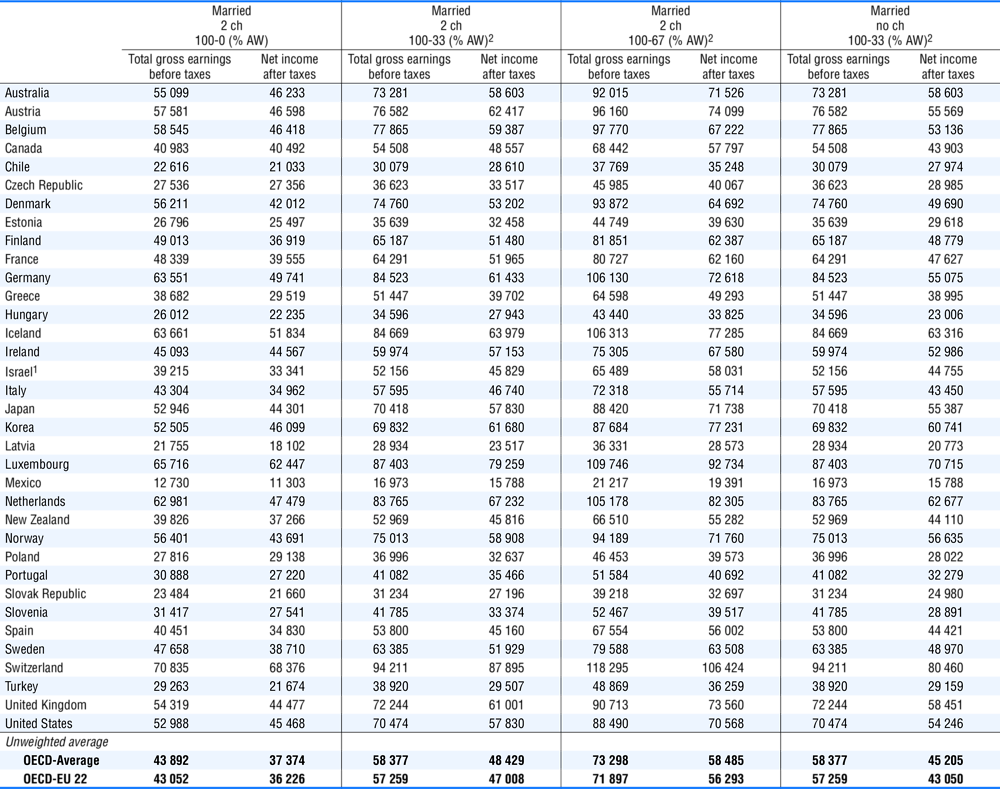
Table 3.10 sets out figures for gross wage earnings and net income for the eight family-types after all amounts have been converted into U.S. dollars with the same purchasing power. Single workers with the average wage take home (see Table 3.10, column 4) over USD 37 000 in twelve countries: Switzerland (USD 58 870), Luxembourg (USD 46 625), Iceland (USD 45 421), Korea (USD 44 878), the Netherlands (USD 43 836), Australia (USD 41 665), the United Kingdom (USD 41 599), Japan (USD 41 127), Norway (USD 40 829), the United States (USD 39 209), Austria (USD 38 912) and Germany (USD 38 207). The corresponding lowest levels were in Mexico (USD 11 303), Latvia (USD 15 357), Hungary (USD 17 298) and the Slovak Republic (USD 17 958). In the case of a one-earner married couple with two children at the average earnings level, families take home over USD 50 000 in Iceland, Luxembourg and Switzerland; with the lowest level again being in Mexico. With the exceptions of Chile and Mexico, the one-earner married couple takes home more than the single individual, both family types at the average wage level, due to the favourable tax treatment of this family and/or the cash transfers to which they are entitled.
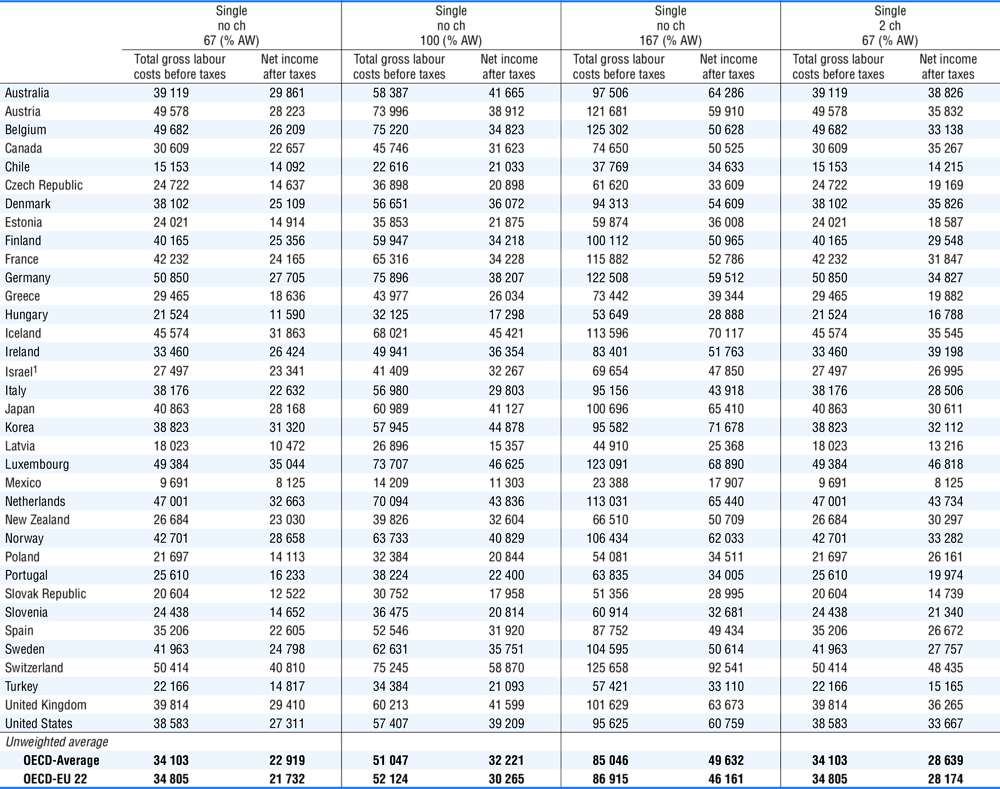
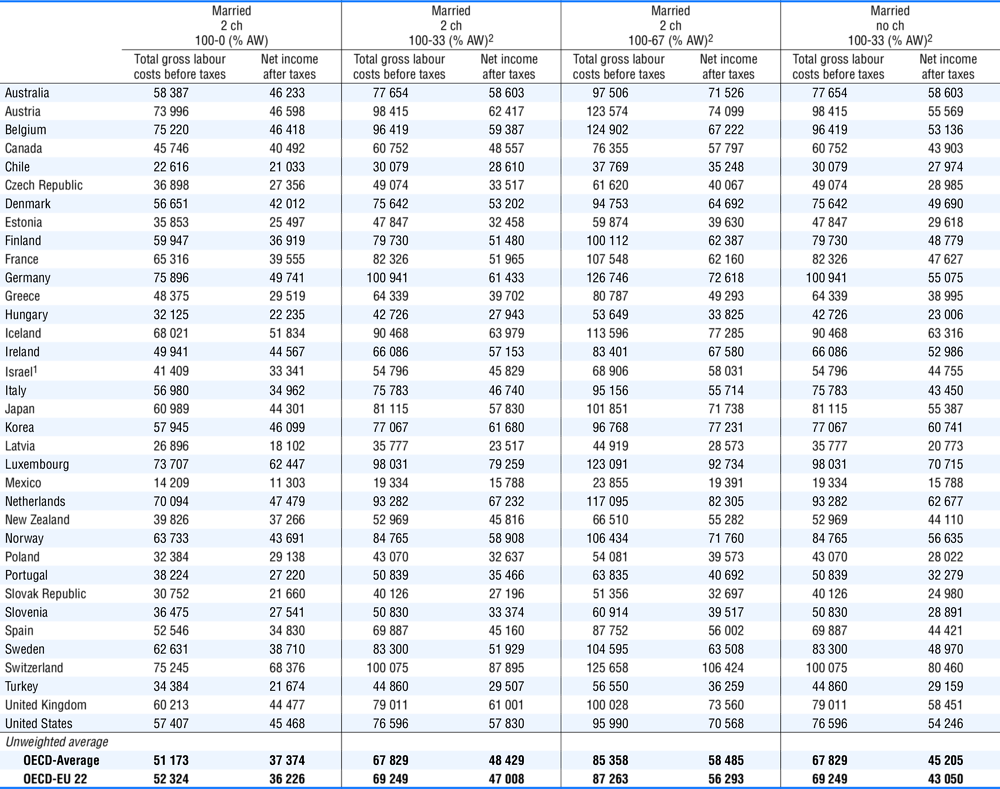
Table 3.11 shows the corresponding figures to Table 3.10 for labour costs and net income. Thus, the “net” columns in Tables 3.10 and 3.11 are identical. Usually, labour costs are much higher than gross wages, because any employer social security contributions (including payroll taxes) are taken into account. If measured in US dollars with equal purchasing power, labour costs for single workers earning the average wage level are highest in Germany (USD 75 896), Switzerland (USD 75 245) and Belgium (USD 75 220), and lowest in Mexico (USD 14 209), Chile (USD 22 616) and Latvia (USD 26 896). Annual labour costs are equal to annual gross wage in Chile and New Zealand. In those countries neither compulsory employer social security contributions nor payroll taxes are levied on wages. However, employers in Chile are subject to non-tax compulsory payments related notably to pension schemes.
|
Table 3.1. Income tax plus employee and employer contributions less cash benefits, 2017
|
|---|
|
As % of labour costs, by family-type and wage level
|
 |
|
Note : ch = children |
|
1. Information on data for Israel: http://oe.cd/israel-disclaimer. |
|
2. Two-earner family. |
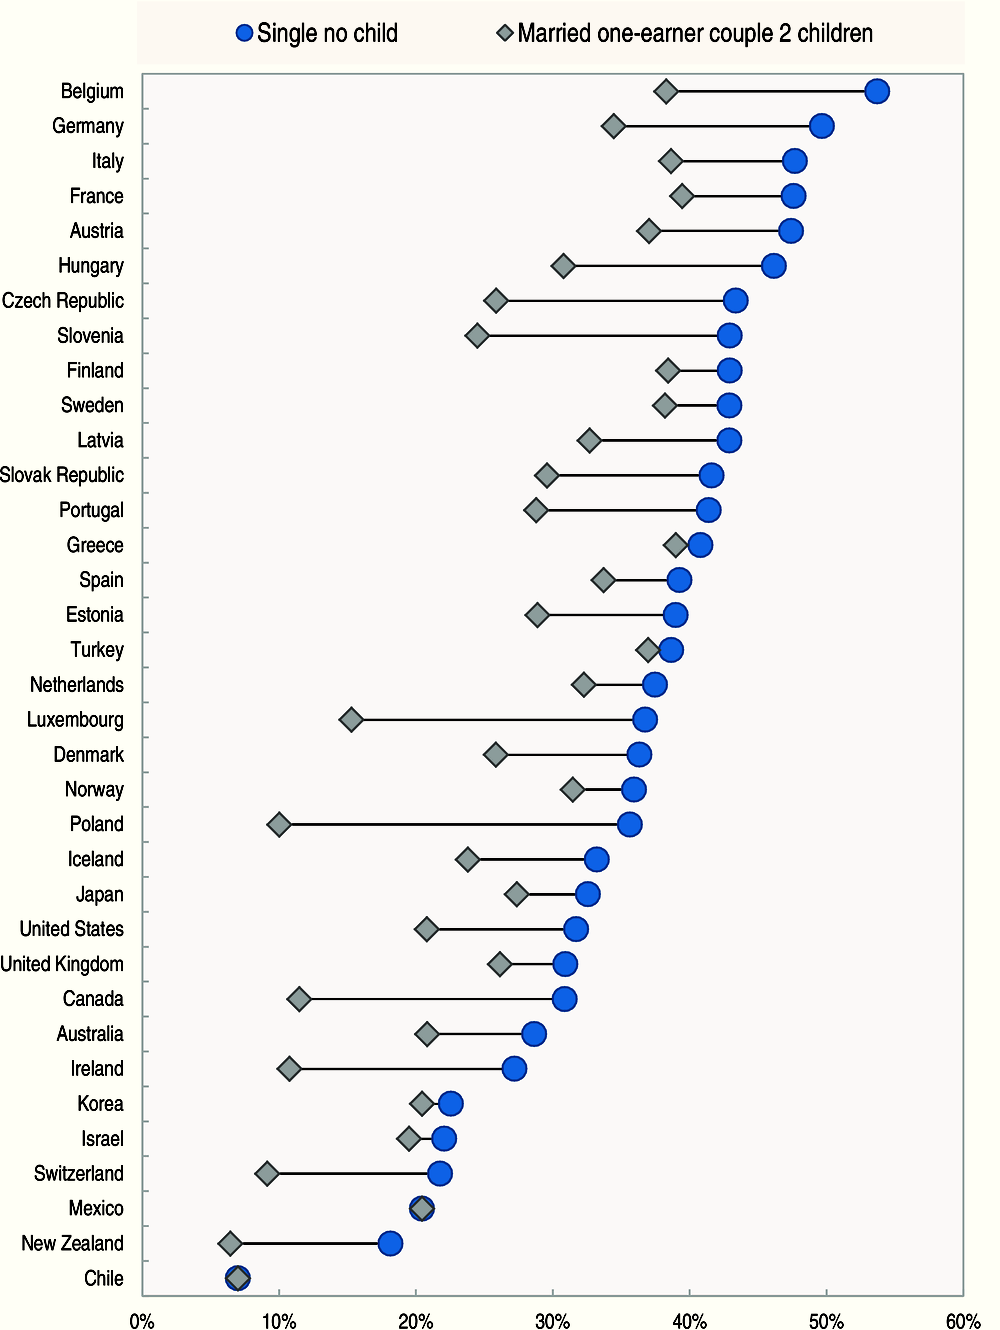
Note : The family type “single no child” corresponds to a wage level of 100% of average wage. The family type “married one earner couple 2 children” corresponds to a combined wage level of 100%-0% of average wage.
Source : OECD calculations based on country submissions and OECD Economic Outlook, Volume 2017 (No. 102).
|
Table 3.2. Income tax plus employee contributions, 2017
|
|---|
|
As % of gross wage earnings, by family-type and wage level
|
 |
|
Note : ch = children |
|
1. Information on data for Israel: http://oe.cd/israel-disclaimer. |
|
2. Two-earner family. |
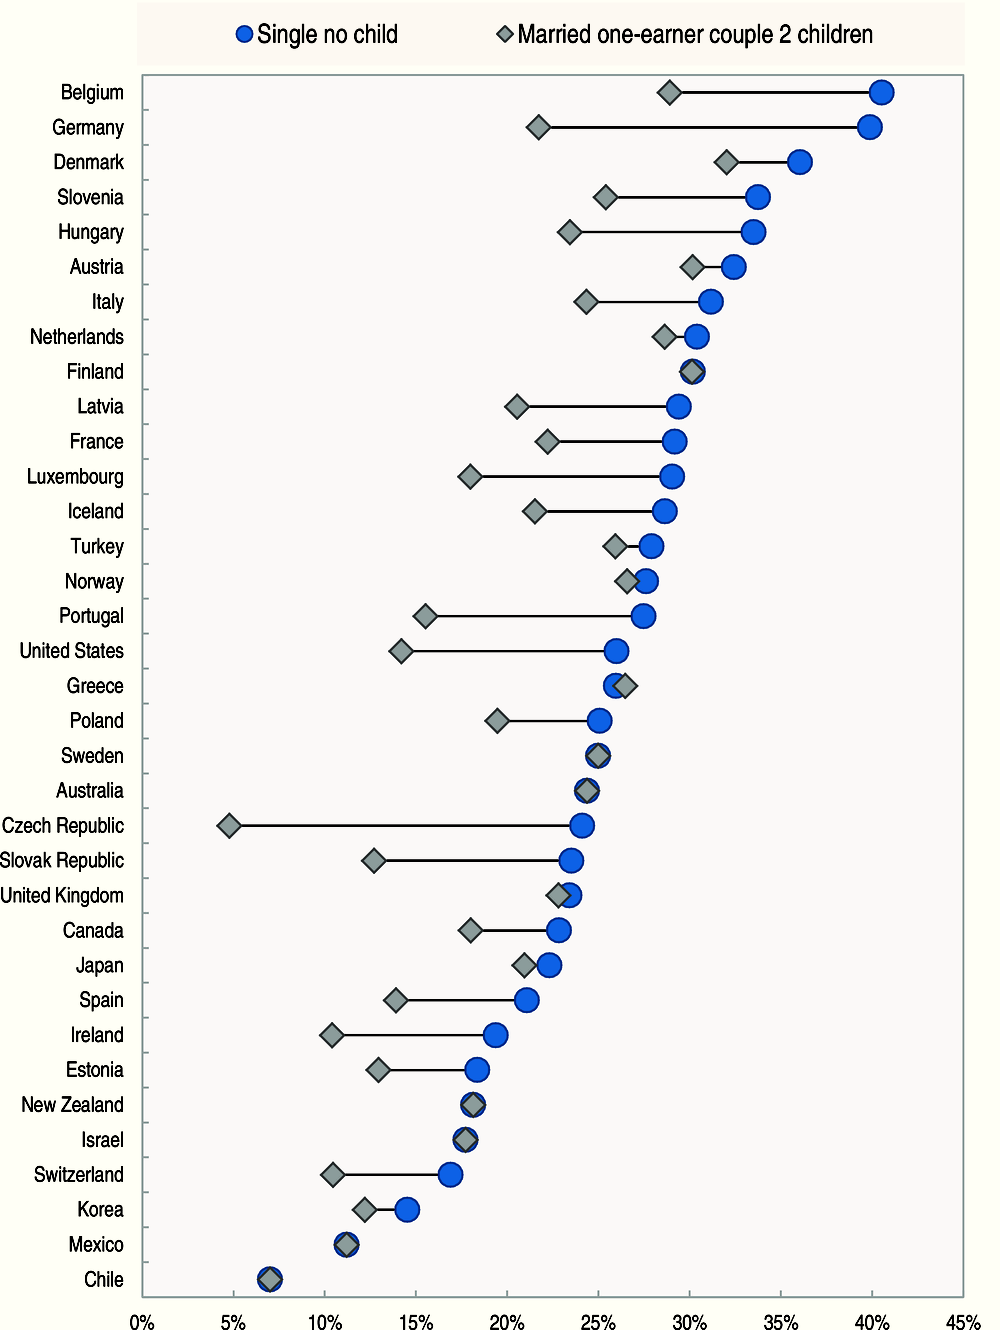
Note : The family type “single no child” corresponds to a wage level of 100% of average wage. The family type “married one earner couple 2 children” corresponds to a combined wage level of 100%-0% of average wage.
Sources : Country submissions, OECD Economic Outlook Volume 2017 (No. 102).
|
Table 3.3. Income tax plus employee contributions less cash benefits, 2017
|
|---|
|
As % of gross wage earnings, by family-type and wage level
|
 |
|
Note : ch = children |
|
1. Information on data for Israel: http://oe.cd/israel-disclaimer. |
|
2. Two-earner family. |
Note : The family type “single no child” corresponds to a wage level of 100% of average wage. The family type “married one earner couple 2 children” corresponds to a combined wage level of 100%-0% of average wage.
Source : OECD calculations based on country submissions and OECD Economic Outlook, Volume 2017 (No. 102).
|
Table 3.4. Income tax, 2017
|
|---|
|
As % of gross wage earnings, by family-type and wage level
|
 |
|
Note : ch = children |
|
1. Information on data for Israel: http://oe.cd/israel-disclaimer. |
|
2. Two-earner family. |
Note : The family type “single no child” corresponds to a wage level of 100% of average wage. The family type “married one earner couple 2 children” corresponds to a combined wage level of 100%-0% of average wage.
Source : OECD calculations based on country submissions and OECD Economic Outlook, Volume 2017 (No. 102).
|
Table 3.5. Employee contributions, 2017
|
|---|
|
As % of gross wage earnings, by family-type and wage level
|
 |
|
Note : ch = children |
|
1. Information on data for Israel: http://oe.cd/israel-disclaimer. |
|
2. Two-earner family. |
Note : The family type “single no child” corresponds to a wage level of 100% of average wage. The family type “married one earner couple 2 children” corresponds to a combined wage level of 100%-0% of average wage.
Source : OECD calculations based on country submissions and OECD Economic Outlook, Volume 2017 (No. 102).
|
Table 3.6. Marginal rate of income tax plus employee and employer contributions less cash benefits, 2017
|
|---|
|
As % of labour costs, by family-type and wage level
|
 |
|
Note : ch = children |
|
It is assumed that gross earnings of the principal earner in the household rise. The outcome may differ if the wage of the spouse goes up especially if partners are taxed individually. |
|
1. Information on data for Israel: http://oe.cd/israel-disclaimer. |
|
2. Two-earner family. |
Note : The family type “single no child” corresponds to a wage level of 100% of average wage. The family type “married one earner couple
2 children” corresponds to a combined wage level of 100%-0% of average wage.
Source : OECD calculations based on country submissions and OECD Economic Outlook, Volume 2017 (No. 102).
|
Table 3.7. Marginal rate of income tax plus employee contributions less cash benefits, 2017
|
|---|
|
As % of gross wage earnings, by family-type and wage level
|
 |
|
Note : ch = children |
|
It is assumed that gross earnings of the principal earner in the household rise. The outcome may differ if the wage of the spouse especially if partners are taxed individually. |
|
1. Information on data for Israel: http://oe.cd/israel-disclaimer. |
|
2. Two-earner family. |
Note : The family type “single no child” corresponds to a wage level of 100% of average wage. The family type “married one earner couple 2 children” corresponds to a combined wage level of 100%-0% of average wage.
Source : OECD calculations based on country submissions and OECD Economic Outlook, Volume 2017 (No. 102).
|
Table 3.8. Percentage increase in net income relative to percentage increase in gross wages, 2017
|
|---|
|
After an increase of 1 currency unit in gross wages, by family-type and wage level
|
 |
|
Note : ch = children |
|
Net income is calculated as gross earnings minus personal income tax and employees’ social security contributions plus family benefits. The increase reported in the Table represents a form of elasticity. In a proportional tax system the elasticity would equal 1. The more progressive the system at these income levels, the lower is the elasticity. The reported elasticities in Table 3.8 are calculated as (100-METR)/(100-AETR), where METR is the marginal rate of income tax plus employee social security contributions less cash benefits reported in Table 3.7 and AETR is the average rate plus employee social security contributions less cash benefits reported in Table 3.3. |
|
1. Information on data for Israel: http://oe.cd/israel-disclaimer. |
|
2. Two-earner family. Assumes a rise in the labour costs associated with the principal earner in the household. |
|
Table 3.9. Percentage increase in net income relative to percentage increase in gross labour cost, 2017
|
|---|
|
After an increase of 1 currency unit in gross labour cost, by family-type and wage level
|
 |
|
Note : ch = children |
|
Net income is calculated as gross earnings minus personal income tax and employees’ social security contributions plus family benefits. The increase reported in the Table represents a form of elasticity. In a proportional tax system the elasticity would equal 1. The more progressive the system at these income levels, the lower is the elasticity. The reported elasticities in Table 3.9 are calculated as (100- METR)/(100-AETR), where METR is the marginal rate of income tax plus employee and employer social security contributions less cash benefits reported in Table 3.6 and AETR is the average rate plus employee and employer social security contributions less cash benefits reported in Table 3.1. |
|
1. Information on data for Israel: http://oe.cd/israel-disclaimer. |
|
2. Two-earner family. Assumes a rise in the labour costs associated with the principal earner in the household. |
|
Table 3.10a. Annual gross wage and net income, single person, 2017
|
|---|
|
In US dollars using PPP, by family-type and wage level
|
 |
|
Note : ch = children |
|
1. Information on data for Israel: http://oe.cd/israel-disclaimer. |
|
Table 3.10b. Annual gross wage and net income, married couple, 2017
|
|---|
|
In US dollars using PPP, by family-type and wage level
|
 |
|
Note : ch = children |
|
1. Information on data for Israel: http://oe.cd/israel-disclaimer. |
|
2. Two-earner family. |
|
Table 3.11a. Annual labour costs and net income, single person, 2017
|
|---|
|
In US dollars using PPP, by family-type and wage level
|
 |
|
Note : ch = children |
|
1. Information on data for Israel: http://oe.cd/israel-disclaimer. |
|
Table 3.11b. Annual labour costs and net income, married couple, 2017
|
|---|
|
In US dollars using PPP, by family-type and wage level
|
 |
|
Note : ch = children |
|
1. Information on data for Israel: http://oe.cd/israel-disclaimer. |
|
2. Two-earner family. |
Notes
← 1. The reported elasticities in Table 3.8 are calculated as (100-METR)/(100-AETR), where METR is the marginal rate of income tax plus employee social security contributions less cash benefits reported in Table 3.7 and AETR is the average rate of income tax plus employee social security contributions less cash benefits reported in Table 3.3.
← 2. The reported elasticities in Table 3.9 are calculated as (100-METR)/(100-AETR), where METR is the marginal rate of income tax plus employee and employer social security contributions less cash benefits reported in Table 3.6 and AETR is the average rate of income tax plus employee and employer social security contributions less cash benefits reported in Table 3.1.