Chapter 2. Special feature: Taxation and skills1
This special feature examines how the labour income tax system can provide incentives or disincentives for workers to invest in human capital and skills. It provides effective tax rates on skills investments incorporating personal income taxes and employees’ social security contributions for the sample case of a 32-year-old single worker undertaking a short course of training. Social security contributions increase the tax burden on skills compared to a scenario where only personal income taxes are considered. The tax burden on skills is also progressive; those on higher incomes and those who earn a higher return on skills investments are taxed at higher effective rates. Analysing the impact of labour taxation on skills investments should be borne in mind by policymakers when considering the taxation of labour.
Introduction
Ensuring that all individuals can develop the skills needed to productively participate in the economy is necessary for inclusive economic growth. Skills investments raise wages and employment, and so can reduce inequality while at the same time expanding the economy’s productive capacity. Improving the level of skills across the economy has positive impacts for individuals and society as a whole.
The taxation of labour income has a key role to play in ensuring that individuals have the right incentives to invest in skills. The labour tax wedge in OECD countries is on average 36.0% of a single workers’ income at the average wage in 2016. The key return to skills investments for workers is better jobs and better wages, so the way these returns are taxed by the labour income tax system is a central determinant of whether individuals in OECD countries face the right incentives to invest in skills.
Previous work by the OECD has used the Taxing Wages models to analyse the impact of the tax system on incentives to invest in skills and to activate skills in the labour market. In particular, the Tax Policy Study Taxation and Skills (OECD, 2017) has outlined a series of indicators of the tax system’s impact on skills. This special feature builds on the methodology presented in that study to estimate Marginal Effective Tax Rates (METRs) and Average Effective Tax Rates (AETRs) on skills investments. They measure how much taxes increase or reduce the net returns to skills investments for an individual, and are key statistics in assessing taxation and skills policies in OECD countries.
The Taxation and Skills study focused only on the impact of the personal income tax (PIT) on skills, and largely omitted a discussion of social security contributions (SSCs) and how they can incentivise or dis-incentivise skills investment decisions. This special feature extends the results of the OECD (2017) study by presenting results for 29 OECD countries for METRs and AETRs on skills incorporating employees’ SSCs for the sample case of a 32-year-old individual undertaking a short course of job-related training.2 Results are presented for 20113 Examining employees’ SSCs is a key component of understanding the overall impact of the tax system on skills investment because in many OECD countries employees’ SSCs make up a substantial portion of the overall labour tax wedge.
The special feature proceeds as follows. The following section briefly introduces the different channels through which the PIT and SSC systems can impact financial incentives to invest in skills; for a more in depth discussion of the ETR methodology, see OECD, 2017. The next section provides the main results for METRs and AETRs for the stylised case of a 32-year old individual engaging in a short skills investment. The penultimate section examines how these tax rates change with income. The last section concludes.
Personal income taxes, social contributions, and financial incentives to invest in skills
Taxation and spending policies create incentives or disincentives for the development and activation of skills in a variety of ways. Higher government spending support for skills can make these investments cheaper for individuals, which may cause them to invest more in skills. Conversely, higher taxes on wages can reduce the benefits of investment in skills for individuals and employers, which may induce them to invest less. Similarly, raising taxes on labour income can reduce the returns to skills investments and discourage labour market activation; this in itself will reduce incentives to invest in skills. Table 2.1 shows how the costs and returns to skills investment are shared between governments and individuals.
How the tax system can impact financial incentives to invest in skills
The METR and AETR on skills summarise the overall positive and negative effects of the tax system on the incentives of an individual to invest in skills. They can be thought of as the difference between the returns to skills in a world with taxes compared to a world without taxes. Analysing the difference in the returns to education in a world with and without taxes is the approach taken to calculating effective tax rates for physical capital by Devereux and Griffith (2003). The work undertaken by Brys and Torres (2013), and further developed in OECD (2017), to develop METRs and AETRs for skills builds on this approach. Using the Taxing Wages models, the tax burden on skills can be calculated for stylised examples in OECD countries.
The difference between the METR and the AETR is a function of the returns to education with and without taxes. In the marginal case, this difference is measured when an individual earns just enough returns on their skills investment to break even (i.e. when the after-tax returns are equal to the costs borne by the individual). The tax burden on such a breakeven skills investment is the METR. The AETR is the difference between the value of a skills investment with and without taxes assuming some other (usually higher) level of skills returns.
These two tax rates are a function of how the tax system both subsidises the costs of an investment in skills, and taxes away the returns to skills. Considering costs first, it can be noted that PITs and SSCs reduce the cost of investing in skills by reducing foregone earnings, a key cost component of a skills investment. Skills investments are time-consuming, which reduces the time available to work and therefore reduces income. Foregone income is often a significant cost of skills investments. However, the amount of income foregone during education is offset by the fact that the government also foregoes the taxes which would have been paid by the individual on this income. This means that the tax system reduces the cost of skills investments relative to what would be the case in a world without taxes, which in turn means that the rate at which foregone earnings would have been taxed is a key component of the METR and AETR.
A second channel by which the tax system impacts the financial incentives to invest in skills is through tax expenditures designed to offset the direct costs of skills. Direct costs of skills investments are the costs other than foregone earnings, and include tuition fees, books and materials. These skills tax expenditures can come in the form of reductions in taxable income of the amounts spent on education or reductions in tax liability in some proportion to education spending. They can also come in the form of tax benefits that reduce or exempt scholarship income from taxation. They can also come in the form of lower levels of PITs or SSCs rates on student wage income. The tax system therefore reduces the cost of skills in two ways. Reduced taxes offset foregone earnings, and tax expenditures can help offset direct costs. As these forms of tax offsetting increase in value, the METR and AETR on skills fall.
A third channel through which the tax system impacts incentives to invest in skills is by reducing the returns to skills by taxing them away. Individuals can earn more after education – they earn an “earnings premium” for their extra skills. These returns are taxed away through PITs and SSCs, reducing the returns to skills. In addition, tax progressivity implies that those whose earnings increase more after a skills investment pay taxes at steadily higher rates. In addition to a fraction of the returns to skills being taxed away, which might occur in a flat-rate tax system, tax progressivity means that a steadily higher fraction of the returns is taxed away. Increasing the tax rate on the earnings increment will increase the METR and AETR. Higher skills may also increase a worker’s employment prospects, but this channel has not been included in the Taxation and Skills models.
In sum, the tax system affects the financial incentives to invest in skills both positively and negatively. It reduces the costs of skills but also reduces the returns; the former through the tax rate on foregone earnings (TFE) and skills tax expenditures (STEs), and the latter through the tax rate on the earnings increment (TEI). Each of these components can be calculated using the Taxing Wages models. These three components will be important in explaining the results in the next sections.
The relative value of the TFE, STEs and the TEI is a function of the PIT and SSC tax schedules, which in turn drive the effective tax rates on skills. In a proportional tax system for example, the marginal tax rate on labour is the same regardless of the income level. This means that the TFE and the TEI will be the same in such a system. If the direct costs of a skills investment are fully tax deductible, then the tax system should be neutral with respect to skills investments: the METR on skills will be zero. This is because the costs of a skills investment are being subsidised by the tax system at the same rate at which the returns to skills are being taxed away. Moreover, this will be the case whether the tax rate is low or high. At a high tax rate, the TEI and TFE will both be high. At a low tax rate, the TEI and the TFE will both be low. In both cases, where the rate at which the tax system reduces costs in the same way as the rate at which it taxes away returns, the tax system is neutral with regard to the skills investment. In such instances skills investments that would be profi from the individual’s perspective in the absence of taxes will still be profitable in the presence of taxes (Brys and Torres, 2013).
Both the AETR and METR are weighted averages of these positive and negative effects of the tax system on incentives to invest in skills, where the weight depends on the level of the earnings increment. Where returns to skills are high, the way these returns are taxed is more important. In such cases the tax rate on the earnings increment is a larger determinant of the overall effective tax rate on skills. Where returns are low, the costs of skills come to matter more. In these cases, the impact of the tax system on foregone earnings is a larger determinant. These impacts are summarised in Table 2.2.
How employees’ social security contributions can impact financial incentives to invest in skills
SSCs are a significant factor to take into account when analysing the financial incentives to invest in skills. This report shows that in 2016 for a single childless individual earning the average wage, an average of 9.8% of pre-tax income is paid in employees’ SSCs in OECD countries. This is compared to 15.7% in income being paid in the form of PIT. Given the size of employees’ SSCs in the overall tax wedge on labour, employees’ SSCs may significantly alter the financial incentives to invest in skills.
Some of the channels through which employees’ SSCs can impact skills are the same as in the case of the PIT. SSCs can increase the TFE and so reduce the tax burden on skills. They can also increase the TEI and so increase the overall taxation on skills. In addition, there may be tax expenditures for skills that exist specifically in the SSC system, such as reduced SSC rates on student income.
The impact of employees’ SSCs on incentives to invest in skills may also differ from the impact of PIT in a variety of ways. SSCs can be less progressive than income taxes, as they are generally levied at a flat rate. A previous Taxing Wages special feature finds that for single taxpayers, the progressivity of the labour income tax system when considering income taxes alone differed from the progressivity of the labour income tax when PIT and SSCs were combined (OECD, 2013a).
Progressivity of the PIT and SSC schedule will increase the effective taxation of skills investments, as higher returns from skills investments will be taxed away at higher rates, reducing the returns and the incentives to invest in skills. The Taxation and Skills Tax Policy Study (OECD, 2017) has pointed out that it is the “local” progressivity of the tax system which is important in assessing the tax impact on incentives to invest in skills. The joint effect of the PIT and the SSC schedule on local progressivity (i.e. at different earning levels) will therefore have an impact on the financial incentives to invest in skills.
SSCs are also important because they entitle taxpayers to social benefits. Income taxes alter the returns to skills investments in part by taxing them away, reducing the increase in after-tax income that a taxpayer earns after increasing their skills. SSCs do this as well; taxpayers pay more SSCs when their earnings rise, so the increase in after-tax income that comes with a skills investment is reduced. However the increased SSCs paid often also increase a taxpayers’ entitlement to social benefits. These can include unemployment insurance, pensions or disability benefits. These positive impacts of increased skills on increased future social benefits through the mechanism of paying increased SSCs are not accounted for in this model. This means that the negative impact of the SSC system on financial incentives to invest in skills may be overstated by the results in this special feature. This is particularly the case for those countries where SSCs form a significant part of the labour income tax wedge, and where social benefits received are closely tied to contributions paid. In this respect, the results presented in this special feature should therefore be interpreted with caution. Incorporating these impacts is challenging, as the relationship between SSCs paid and benefit entitlement is complex and highly non-linear in many OECD countries. These issues are left for future research.
A further channel through which SSCs may impact the financial incentives to invest in skills in a way that is different from the impact of PIT is through impacts on employment. As is well known, high taxes on labour can introduce barriers to the activation of skills in the labour market by reducing the returns to work and the returns to hiring new workers (OECD, 2011). But labour supply responses may differ with respect to PIT and SSCs. Lehmann et al. (2013), for example, provide evidence that labour supply responses are different for PIT and payroll taxes. These tax-induced disincentives to participation in the formal labour market also significantly reduce the incentives to develop skills. This means that the impact of SSCs on labour activation and on incentives to invest in skills may be different from those of PIT.
METRs and AETRs incorporating social security contributions
This section presents the key results of the special feature; the tax rates on skills incorporating employees’ SSCs. Results in this section are presented for a taxpayer at the average wage. In the next section, results are presented for an individual at 70%, 100% and 170% of the average wage. Results are presented at these levels to maintain comparability with the results presented in the Taxation and Skills study, while at the same time approximating the income levels used in Taxing Wages. This special feature focuses on employees’ SSCs, and does not present the results for employers’ SSCs. This is in part due to the more complicated questions of economic incidence of employers’ SSCs on labour, and thus on the impact of employers’ SSCs on skills financing decisions.
To understand these results, it is important to understand some of the key assumptions made in the model. It is assumed that skills are financed by individuals and not employers. It is also assumed that the skills investment is not financed by borrowing; it is assumed that the skills investment is financed by an individual’s prior savings. See the Taxation and Skills Tax Policy Study for an in-depth discussion on the assumptions underlying the model calculations.
The ETRs on skills depend on a wide variety of factors and are affected through a variety of channels. This means that the specifics of the stylised skills investment considered will also significantly drive the results. The results presented should be understood as being specific to the stylised skills scenario presented, and may not be the same for other skills scenarios in a country. For example, because the ETRs are a function of the returns to skills, they vary with the amount of time an individual will remain in the workforce. Because the foregone earnings are a key factor through which the tax system offsets the returns to skills, the individual’s foregone income is a key driver of the ETRs. The additional income that will be earned after studying matters too. Individuals might be taxed differently depending on whether they are single or married, and whether they have children and dependants; the ETRs on skills depend on these factors as well.
This special feature focuses on a 32-year-old single taxpayer with no children, who undertakes a short course of job-related education and earns the average wage before making the skills investment. The results are presented based on tax systems as they existed in 2011. To incorporate the fact that earning is time-consuming, it is assumed that the individual earns 95% of the average wage over the year that they study (i.e. the worker foregoes 5% of income when following the course of training).
Part of the motivation for the use of in-career training is to further examine incentives for individuals to engage in lifelong learning. Lifelong learning is a key concern in ensuring that individuals are adaptable to technological change and globalisation (OECD, 2012). Continuous training is particularly important for individuals whose jobs are placed in jeopardy by these forces. Furthermore, continuous training is important for the development of a knowledge-based, high-productivity economy. Ensuring that the fruits of this productivity are available to all is a core part of driving an inclusive growth agenda (OECD, 2016). This motivates the particular focus on the taxation of lifelong learning.
A second motivating factor in the choice of stylised case to present the METRs is the kinds of tax provisions that exist in OECD countries. Specifically, a course of job-related training is chosen to examine the most common forms of tax support for skills in OECD countries. Many OECD countries that have tax deductions for training require that the training be related to an individual’s current employment. This is designed to prevent inefficient subsidisation of skills spending that is in reality consumption spending. It also however means that in many OECD countries training that is not job-related is not tax deductible or tax-creditable.
METRs incorporating employees’ social security contributions
A METR on skills is defined as the tax burden on a skills investment that just breaks even for the individual who makes the investment. Results for METRs in this scenario incorporating PIT have been presented in the previous OECD tax policy study Taxation and Skills (OECD, 2017). When compared to these results, the inclusion of employees’ SSCs raises METRs on skills on average, as can be seen in Figure 2.1. The average METR across 29 OECD countries where only PIT is included is 9.1% for a stylised in-work training example. When employees’ SSCs are included as well as PIT, the METR rises to 19.7%.
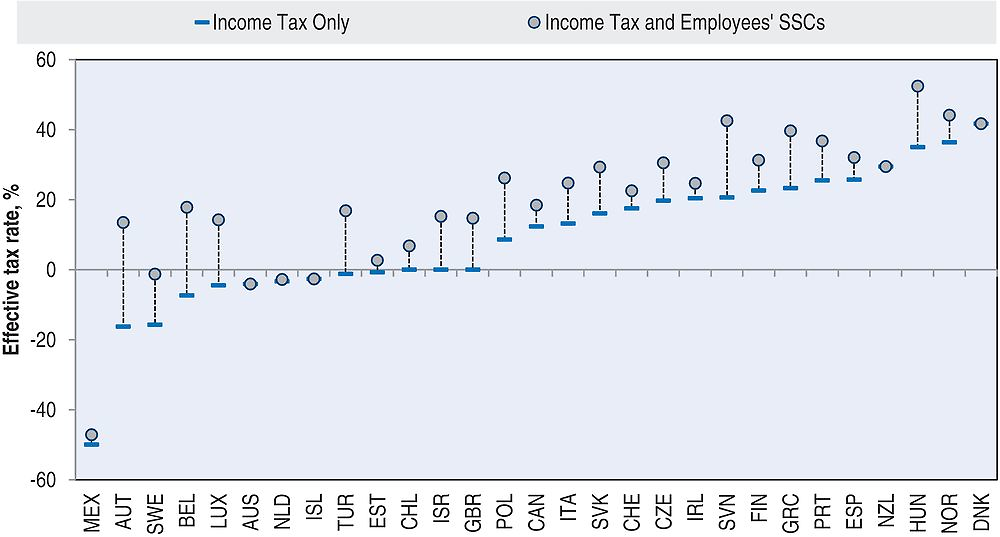
Note: Data are for a 32-year-old single taxpayer with no children, who undertakes a short course of job-related education, earning 95% of the average wage over the year while they study. This figure shows results that incorporate tax deductions for direct costs, tax exemptions for scholarship income, and reduced taxes on student wage income. STEs that subsidise parental spending on education or that subsidise firm spending on education are not included. It is assumed that the skills investment is financed wholly with savings: students do not incur any debt to make a skills investment. Data are presented for 2011.
In the case where only PIT is considered, the highest METR on skills occurs in Denmark which has a METR of 41.7%. Denmark has no employees’ SSCs of SSCs while income taxes are high and progressive, which explains Denmark’s high income tax burden on skills. When employees’ SSCs are incorporated, the highest METR can be found in Hungary with a METR of 52.4%. In the case where only PIT is considered, the lowest METR on skills can be observed for Mexico which has a METR of -49.7%. When employees’ SSCs are incorporated Mexico continues to face the lowest METR, but the inclusion of SSCs causes the METR to rise slightly to -47.1%.4
The extent to which incorporating employees’ SSCs raises METRs on skills varies by country; the sizes of the increases depend on the significance of SSCs in a given country’s labour taxation system, and also on the specific shape of the SSC and PIT schedule around the average wage (where the results are measured). The highest increase in the METR on skills can be found in Austria, where METRs increased from -16.2% when only PIT is considered, to 13.5%, which is still one of the lowest METRs on skills in the sample of countries considered.
The lowest increase in the METRs is zero; this is the case in countries which levy no employees’ SSCs such as Australia, Denmark, and New Zealand. Amongst those countries where an increase is recorded, employees’ SSCs increase METRs by the lowest amount in the Netherlands, where they increase the METR by 0.5%.
The inclusion of employees’ SSCs into the analysis can impact the METR through the TFE and the TEI; that is, through the ways in which the SSC system subsidises costs and reduces returns of skills investments. Where the rate of SSCs is flat, the inclusion of SSCs into the analysis will not alter the overall effective tax burden on skills investments. This is seldom the case, however. For example, in some instances there are ceilings above which an extra currency unit of income may not be liable for additional SSCs. This may mean that SSCs increase the TFE, but not the TEI. In these cases, accounting for SSCs may reduce the tax burden on skills substantially. While this is not observed in Figure 2.1, it may occur at other income levels depending on the location of ceilings in countries’ SSC schedules.
In other cases SSC liability may rise with income. SSC schedules may be progressive due to either higher rates on higher incomes or due to allowances below which SSCs are not levied or are levied at reduced rates. In these cases, accounting for SSCs will raise the TEI by more than the increase in the TFE. In these cases, the overall effective tax rate on skills may be higher where SSCs are taken into account.
Tax expenditures also influence the differential impact of PIT and SSC systems on financial incentives to invest in skills. Skills tax expenditures in many countries often include deductibility of the costs of skills from the PIT base. This reduces the costs of skills and so reduces METRs on skills. These costs are however seldom deductible from the SSC base. This means that, holding other factors constant, AETRs and METRs are likely to be higher when SSCs are incorporated than when PIT alone is considered.
It is also important to consider the ways in which the SSC system interacts with the PIT system. In many countries, employees’ SSCs are deductible from the PIT base. In this special feature the results presented for PIT factor in these deductions of SSCs from the PIT base. This approach follows that taken throughout Taxing Wages. When employees’ SSCs are incorporated, they will add to the tax burden on the earnings increment, but this effect may be partly offset by the fact that the SSCs paid will be deductible from the PIT base and the PIT burden will be reduced. So SSCs cannot necessarily be considered to be levied directly ’on top’ of the PIT schedule, as the imposition of employees’ SSCs affects PIT liability as well. As PIT schedules are more progressive at lower income levels, employees’ SSCs will reduce significantly the PIT that will have to be paid at lower income levels. Employees’ SSCs will therefore result in a smaller increase in the TFE than that they will increase the TEI, resulting in an increase in the METR on skills investments.
AETRs incorporating social security contributions
The AETR on skills differs from the METR on skills in that while the METR examines the tax burden where an individual is just breaking even on a skills investment, the AETR examines the tax burden when an individual is earning a fixed return on a skills investment. The AETR in this skills investment scenario is based on an assumed 15% increase in earnings after a skills investment is made. So an individual that earns 100% of the average wage before a skills investment is assumed to earn 115% of the average wage afterwards.
The AETR in the case where only PIT is included has a cross-country average of 16.1% for the stylised example. This is higher than the METR, as is the case throughout the Taxation and Skills study. The AETR is higher than the METR because as individuals earn higher and higher earnings premiums after a skills investment, they are pushed into higher tax brackets and their returns to skills are taxed away at higher rates. In addition, an average skills investment is assumed to yield a higher pre-tax return compared to a marginal skills investment. Both factors together explain why AETRs are higher than METRs on average.
When employees’ SSCs are included as well as PIT the AETR rises from an average of 16.1% to 24.9% across the countries considered, as is shown in Figure 2.2. As is the case with the METR, there are similar reasons why the AETR on skills is higher when SSCs are incorporated. However, the increase in the AETR is smaller than the increase in the METR when employees’ SSCs are included. In the case where only PIT is considered, the highest AETR on skills can be found in Denmark which has an AETR of 41.7%, as is the case with a marginal skills investment. When employees’ SSCs are incorporated, the highest AETR is observed in Hungary – as with the marginal case – with an AETR of 52.2%. In the case where only PIT is considered, the lowest AETR on skills is observed in Mexico which has an AETR of -11.7%. When employees’ SSCs are incorporated, Mexico continues to face the lowest AETR although it slightly rises to -10.1%.
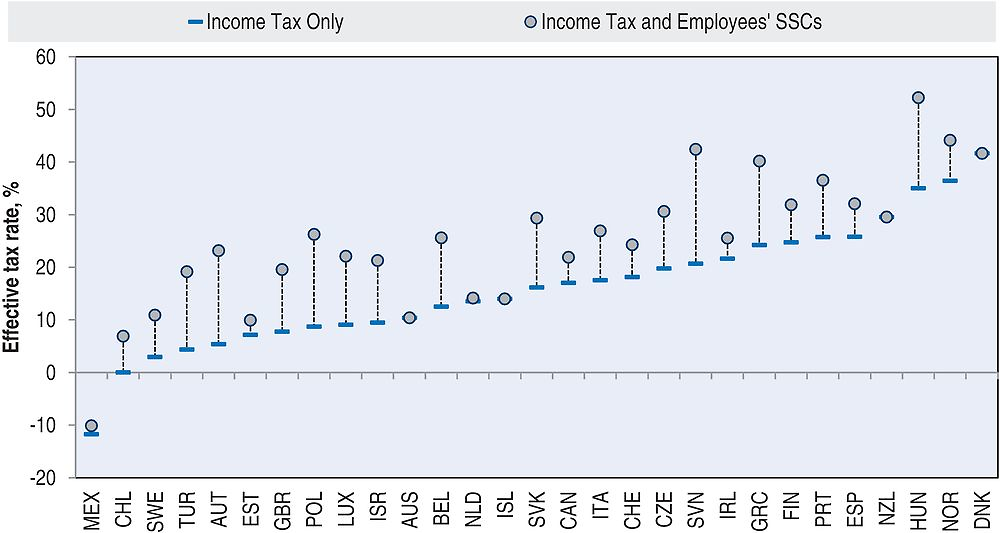
Note: Data are for a 32-year-old single taxpayer with no children, who undertakes a short course of job-related education, earning 95% of the average wage over the year while they study. This figure shows results that incorporate tax deductions for direct costs, tax exemptions for scholarship income, and reduced taxes on student wage income. STEs that subsidise parental spending on education or that subsidise firm spending on education are not included. It is assumed that the skills investment is financed wholly with savings: students do not incur any debt to make a skills investment. Data are presented for 2011.
The extent to which incorporating employees’ SSCs into the analysis raises AETRs on skills varies by country. As with METRs, this depends on the significance of SSCs in a given country’s labour taxation system. The highest increase in the AETR on skills can be observed in Slovenia, where AETRs increased by 21.7 percentage points, from 20.6% when only PIT is considered, to 42.4%. Slovenia has one of the highest shares of SSCs in their labour taxation system, which the analysis suggests increases the financial burden on skills investments.
As with the METRs on skills, the lowest increase in the indicators is zero, which occurs in those OECD countries which have no employees’ SSCs. Among those countries where an increase is recorded, SSCs increase by the lowest amount in the Netherlands, where the AETRs increase by 0.6%. This is due to the fact that the average wage is above the ceiling for most employees’ SSCs in the Netherlands. Some SSCs are levied in the first two tax brackets, but an individual at the average wage receiving a pay increase of 15% will pass over the ceiling for these contributions as well. This result highlights the fact that local features in the tax schedule can have substantial impacts on incentives to invest in skills with a view to increasing income. By contrast, ceilings in the SSC system may mean than effective tax rates on skills are lower for those on higher incomes than for those on lower incomes.
Progressivity of effective tax rates on skills
This section explores how the results vary depending on the income of the taxpayer making the skills investment. The previous section focused on a taxpayer earning the average wage, but highlighted the extent to which local features in the tax schedule could impact incentives to invest in skills. This suggests that comparing the tax burden on skills across the income tax schedule could be instructive. In addition it is important to examine differing incentives to invest in skills across income levels. OECD research has suggested that those with higher incomes are more likely to invest in skills, as are those with higher initial levels of education (OECD, 2013b). Skills beget skills for many individuals. This raises issues regarding the inclusiveness of the tax system with respect to skills which can be informed by examining tax rates on skills across income levels.
Progressivity of METRs incorporating social security contributions
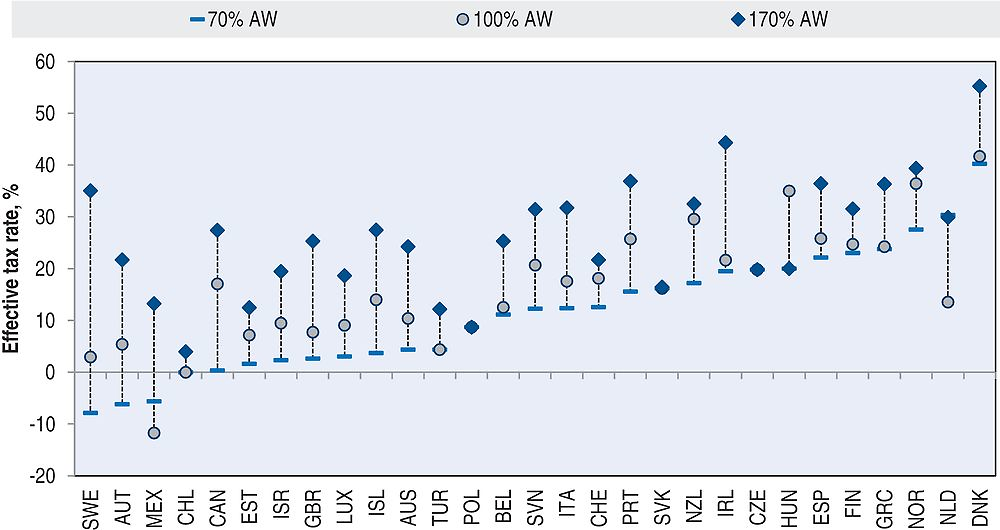
Figure 2.3a suggests that PIT METRs on skills are modestly progressive, though this average conceals significant within-country variation. The increase in the taxation of skills investments in OECD countries is shown in Figure 2.3a. On average, the METR is 10.4% at 70% of the average wage, 9.1% at 100% of the average wage, and 14.2% at 170% of the average wage when only PIT is considered. Thirteen of the 29 countries considered see an increase in the METR on skills between 70% and 100% of the average wage, and 16 of the countries see an increase between 100% and 170%. The largest increase in the METR between 70% and 170% can be observed in Ireland, where the METR rises by 22 percentage points. Ireland has one of the most progressive tax systems in the OECD, which means that at each stage in the income distribution the TEI may be higher than TFE, which in turn means that the METR will rise with income.
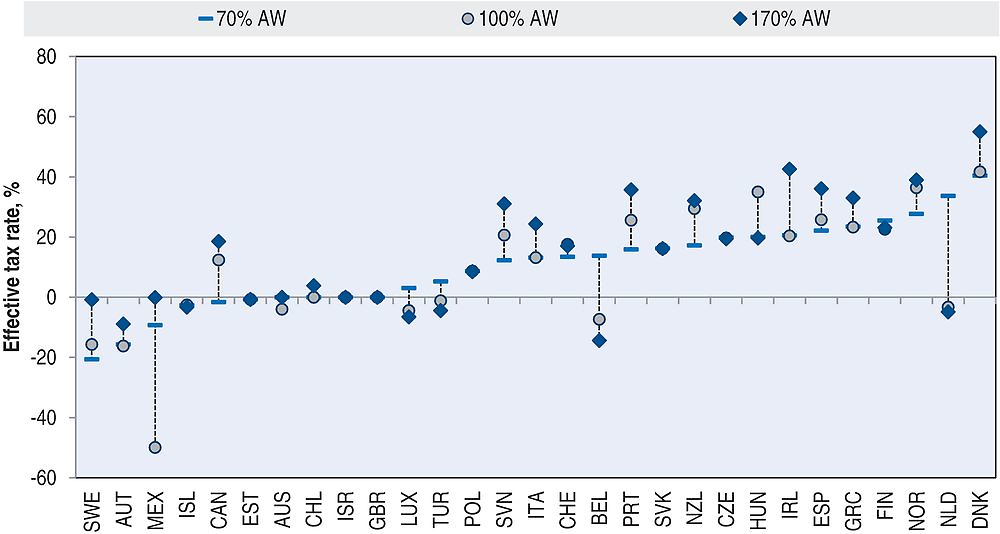
Note: Data are for a 32-year-old single taxpayer with no children, who undertakes a short course of job-related education, earning 95% of the average wage over the year while they study. This figure shows results that incorporate tax deductions for direct costs, tax exemptions for scholarship income, and reduced taxes on student wage income. STEs that subsidise parental spending on education or that subsidise firm spending on education are not included. It is assumed that the skills investment is financed wholly with savings: students do not incur any debt to make a skills investment. Data are presented for 2011
In several countries the METR falls over the income range. Significant decreases are noted in Belgium and the Netherlands. In Belgium, the METR falls from 13.8% at 70% of the average wage to -14.4% at 170% of the average wage. In the Netherlands, the METR falls from 33.7% at 70% of the average wage to -4.9% at 170% of the average wage. This significant fall in the tax burden in the Netherlands is due to the ceiling on employees’ SSCs, above which they no longer impact the METR on skills. Individuals pass above the SSC threshold just above the 70% of the average wage. This means that as individuals earn more income after education, SSCs are no longer paid on a marginal euro of income. This in turn means that SSCs are not deductible from the PIT tax base, and so PIT liability rises somewhat sharply. This in turn means that the PIT system taxes away the returns to skills quite sharply in the Netherlands at 70% of the average wage specifically. Further up the income distribution, this ceiling effect no longer exists. In this instance the tax burden on skills falls significantly; the tax system reduces the returns and subsidises the costs at a similar rate. These effects show that ceilings and thresholds can have a significant impact on incentives to invest in skills at various points in the income distribution.
Progressivity of METRs when incorporating employees’ SSCs is more mixed, as can be seen in Figure 2.3b. On average, the METR is 19.5% at 70% of the average wage, 19.7% at 100% of the average wage, and 22.5% at 170% of the average wage when PIT and employees’ SSCs are considered. Increases in the progressivity of METRs when employees’ SSCs are incorporated are mostly of a smaller degree. The largest increase in METR between 70% and 170% can be observed in Ireland, where the METR on skills increases by 22 percentage points from 70% of the average wage to 170%. Ireland has no ceiling for SSCs, unlike many other countries with SSCs, which could raise the TEI for those on high incomes when SSCs are incorporated, in addition to the high levels of tax progressivity previously mentioned.
It is important to bear in mind that more than one kind of progressivity matters when it comes to skills. Progressivity can exist with respect to income prior to and after a skills investment. On the one hand the tax system can be progressive with respect to income before making a skills investment, which will mean that those on higher incomes before education pay higher rates of tax on their skills investments. On the other hand, the tax system can be progressive with respect to incomes after a skills investment, which will mean that those skills investments that earn higher returns pay higher rates of tax. Many tax systems will feature both forms of progressivity. These figures examine progressivity with respect to income before making a skills investment. Those on higher incomes in most countries pay higher rates of tax on skills investments. The latter form of progressivity – progressivity with respect to the returns to skills – can be seen from the fact that AETRs on skills are usually higher than METRs on skills; those skills investments yielding higher returns are taxed more heavily than those skills investments that simply break even.
Progressivity of AETRs incorporating social security contributions
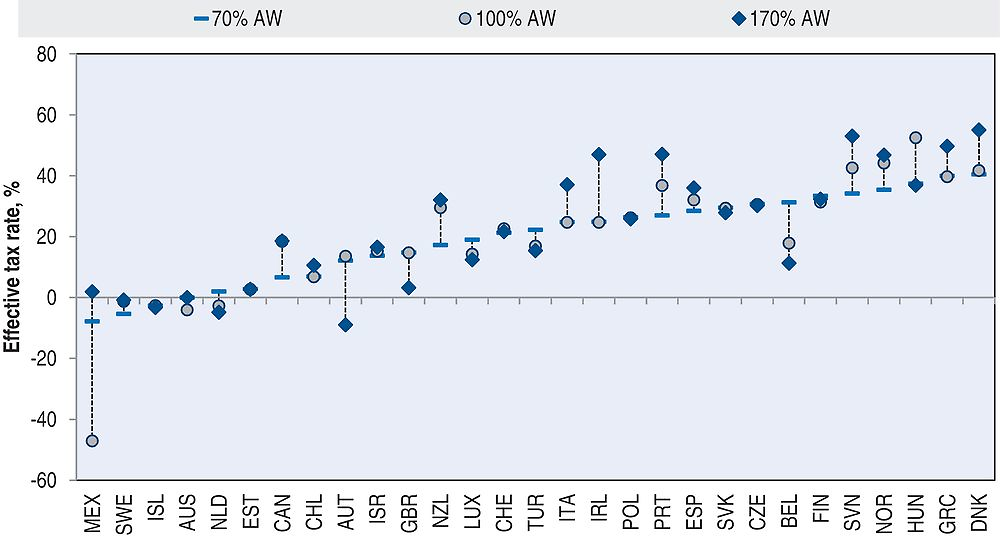
As discussed previously, the AETRs on skills are higher than the METRs; skills investments are more heavily taxed when they earn higher returns than when they earn lower returns. As with METRs, AETRs on skills are also rising with income, though this rise is more uniform across countries and often larger than is the case with the METRs. These results are shown in Figure 2.4a.
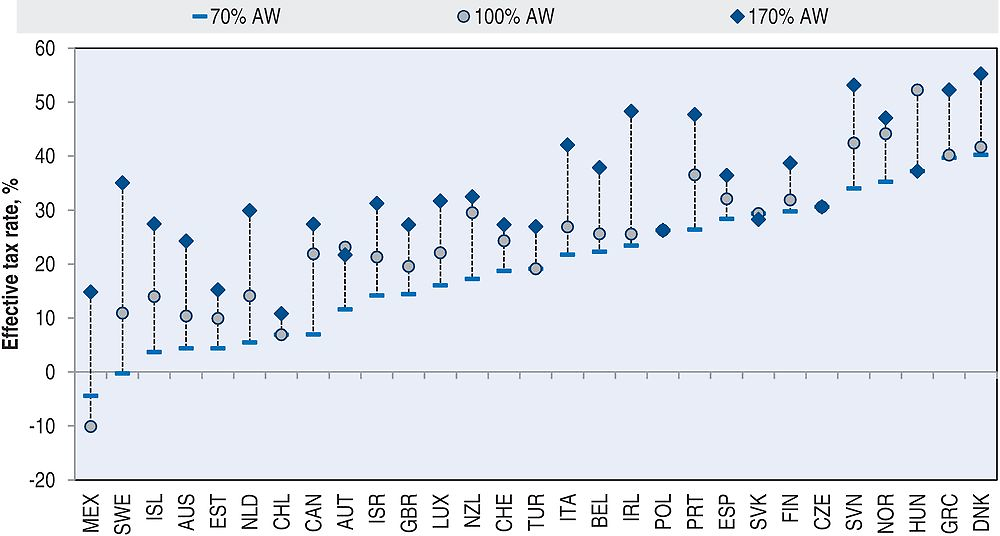
Note: Data are for a 32-year-old single taxpayer with no children, who undertakes a short course of job-related education, earning 95% of the average wage over the year while they study. This figure shows results that incorporate tax deductions for direct costs, tax exemptions for scholarship income, and reduced taxes on student wage income. STEs that subsidise parental spending on education or that subsidise firm spending on education are not included. It is assumed that the skills investment is financed wholly with savings: students do not incur any debt to make a skills investment. Data are presented for 2011.
On average across the 29 countries the AETR is 11.5% at 70% of the average wage, 16.1% at 100% of the average wage, and 26.1% at 170% of the average wage when only PIT is considered. All but two of the countries see an increase in the AETR on skills between 70% and 100% of the average wage, and all but one of the countries see an increase between 100% and 170%. The largest increase in AETR between 70% and 170% is in Sweden, where the AETR increases by 42 percentage points. The smallest is in the Netherlands, where increases in the AETR on skills between 70% of the average wage and 170% is close to zero.
These increases in the AETR across income levels stem in part from the closeness of AETRs to the TEI. Where the costs of skills are comparatively low relative to the returns, the way that the returns to skills are taxed is a more important component of the overall impact of the tax system on skills than the way the tax system subsidises costs. In such instances, the AETR on skills will closely resemble the TEI, which in turn closely follows the income tax schedule in most OECD countries and so is progressive.
Progressivity of AETRs when incorporating employees’ SSCs is not substantially increased or decreased relative to the case where income taxes alone are considered, as can be seen in Figure 2.4b. This is in part due to the lack of progressivity in the average SSC schedule near the average wage compared to the PIT schedule. The results may be different at other points in the income distribution not considered in this special feature. On average, the AETR is 19.4% at 70% of the average wage, 24.9% at 100% of the average wage, and 33.2% at 170% of the average wage when PIT and employees’ SSCs are considered. Only one country (Mexico) sees a decline in the AETR on skills between 70% and 100% of the average wage, only three of the countries sees a decline between 100% and 170%. The largest increase in AETR between 70% and 170% is in Sweden. Only the Slovak Republic sees a decline over the income range, but only by 0.1%.
Conclusion
This special feature has outlined effective tax rates on skills for both a marginal and average skills investment for a mid-career individual undergoing a period of job-related training. The effective tax rates on skills are indicators of the overall extent to which the tax system encourages or discourages skills investment. Overall the incorporation of employees’ SSCs into the analysis raises the tax burden on skills relative to the case where only PIT is taken into account. This is true for both marginal and average skills investments. When employees’ SSCs are taken into account the AETR on skills for the stylised example is 24.9%. For a marginal skills investment, the effective tax rate is 19.7%.
Recent OECD publications have highlighted the crucial role productivity plays in fostering growth that is inclusive and sustainable in OECD economies. Raising productivity levels is a key component in delivering wage increases and increases in standards of living to workers across OECD countries (OECD, 2016). Increasing skills is a key component of raising productivity, and better skills are also associated with a wide variety of positive life outcomes in areas such as employment, longevity and health.
While skills investments are important, they do not receive as much attention from tax policymakers as physical capital investments. This special feature, as well as the OECD (2017) Taxation and Skills Tax Policy Study has sought to address this disparity. This work has shown that, as with taxation of labour income, assessment of the overall impact of both SSCs and PIT needs to be considered when examining incentives to invest in skills.
In most of the examples considered, employees’ SSCs increase the burden on skills. While the impact of the PIT system on financial incentives to invest in skills can be positive, negative or even neutral in differing OECD countries under different skills scenarios, this is not the case with SSCs. This is in part due to the fact that while skills expenditures are often deductible from the PIT base, they are not deductible from the SSC base. This creates a tax distortion in the financial incentives to invest in skills. In some countries however, the inclusion of SSCs reduces the overall burden on skills. This is due to the fact that some SSC systems have ceilings above which no further contributions are paid, which reduces the burden on the financial returns to skills. These ceilings can mean that financial incentives to invest in skills can be higher for those on higher incomes.
This special feature has shown that the combination of the deductibility of SSCs from the PIT base, ceilings and thresholds for SSCs, and changes in rate schedules can all impact individuals’ incentives to invest in skills. These incentives depend on the ways in which the tax system reduces the returns and offsets the costs of skills investments. This means that features in the PIT and SSC schedules can impact individuals’ incentives to invest in skills both above and below an individuals’ current income level. These factors highlight the importance of designing both the PIT and SSC schedules in a coherent way.
Further research is needed to examine the impacts of tax-benefit systems on skills incentives. This special feature presented results for only one stylised case; many other cases could be considered regarding adult education, including skills investments financed by firms as well as vocational skills investments in the form of apprenticeships. In addition, this special feature considered only employees’ SSCs; future research could consider employers’ SSCs as well. Finally, the analysis here has considered the payments into the social security system, not receipts from it such as healthcare benefits, pensions or unemployment insurance. Factoring these into the analysis could greatly change the results on the incentives around skills investments for some countries.
References
Brys, B. and C. Torres (2013), “Effective Personal Tax Rates on Marginal Skills Investments in OECD Countries: A New Methodology”, OECD Taxation Working Papers, No. 16, https://doi.org/10.1787/22235558.
Devereux, M.P. and R. Griffith (2003), “Evaluating Tax Policy Decisions for Location Decisions”, International Tax and Public Finance, Vol. 10, pp. 107-126.
Lehmann, E., F. Marical and L. Rioux (2013), “Labor income responds differently to income-tax and payroll-tax reforms”, Journal of Public Economics, Vol. 99, pp. 66-84.
OECD (2011), Taxation and Employment, OECD Publishing, Paris, https://doi.org/10.1787/9789264120808-en.
OECD (2012), Better Skills, Better Jobs, Better Lives: The OECD Skills Strategy, https://doi.org/10.1787/9789264177338-en.
OECD (2013a), Taxing Wages 2013, OECD Publishing, Paris, https://doi.org/10.1787/tax_wages-2013-en.
OECD (2013b), OECD Skills Outlook 2013 - First Results from the Survey of Adult Skills, OECD Publishing, Paris, https://doi.org/10.1787/9789264204256-en.
OECD (2014), Education at a Glance 2014: OECD Indicators, OECD Publishing, Paris, https://doi.org/10.1787/eag-2013-en.
OECD (2016), The Productivity-Inclusiveness Nexus: Preliminary version, OECD Publishing, Paris, https://doi.org/10.1787/9789264258303-en.
OECD (2017), “Taxation and Skills”, OECD Tax Policy Study, OECD, Paris, Vol. 24.
Notes
← 1. The statistical data for Israel are supplied by and under the responsibility of the relevant Israeli authorities. The use of such data by the OECD is without prejudice to the status of the Golan Heights, East Jerusalem and Israeli settlements in the West Bank under the terms of international law.
← 2. The countries covered are Australia, Austria, Belgium, Canada, Chile, the Czech Republic, Denmark, Estonia, Finland, Greece, Hungary, Iceland, Ireland, Israel, Italy, Luxembourg, Mexico, the Netherlands, New Zealand, Norway, Poland, Portugal, the Slovak Republic, Slovenia, Spain, Sweden, Switzerland, Turkey, and the United Kingdom. France, Germany, Japan, Korea and the United States are omitted due to data limitations. Data are presented for 2011.
← 3. This lag is due in part due to data limitations with regarding to data on the costs of education. Data on the costs of education are taken from Education at a Glance (OECD, 2014) which is published with a time lag.
← 4. Following the revision to the system of national accounts in Denmark in 2014 with respect to the implementation of ESA 2010, the contributions to unemployment funds are not classified as taxes any longer as they are not mandatory. The change has been retroactive.