3. Innovation today: Taking action
Narrowing the digital divide
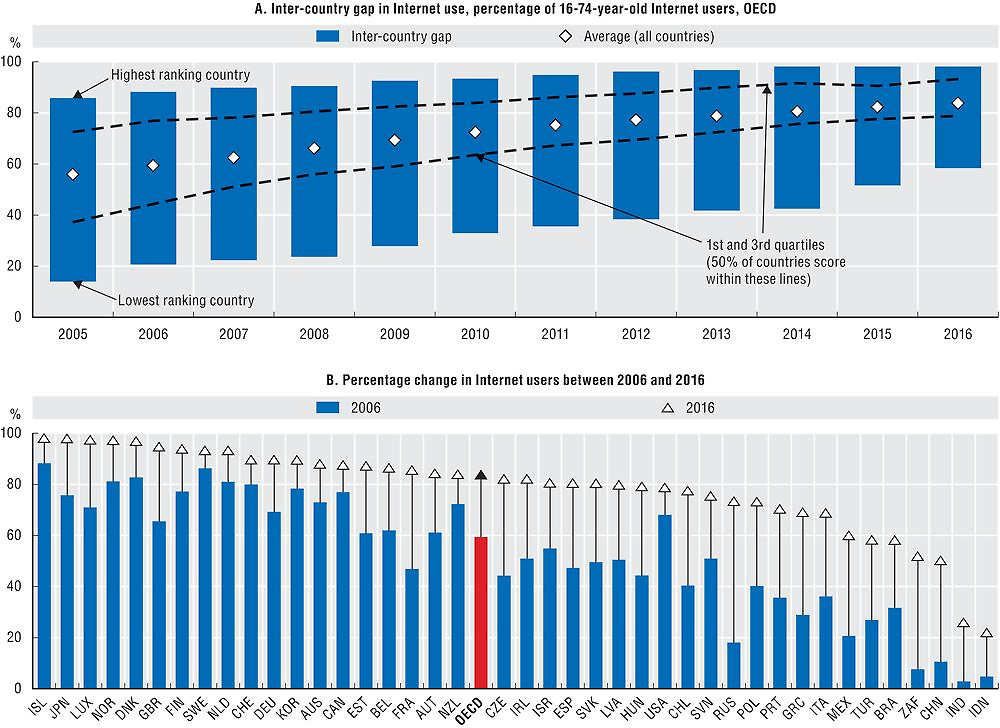
Today’s digital economy is characterised by connectivity between users and between devices, as well as the convergence of formerly distinct parts of communication ecosystems such as fixed and wireless networks, voice and data, and telecommunications and broadcasting. The Internet and connected devices have become a crucial part of most individuals’ everyday life in OECD countries and emerging economies. The share of Internet users in OECD countries grew on average by 30 percentage points over the last ten years (85% in 2016 as compared to 56% in 2005), and more than doubled in the cases of Greece, Mexico and Turkey. Over 50% of 16-74 year olds in Brazil, China and South Africa use the Internet today, narrowing the gap with OECD countries. Some economies are reaching saturation (uptake by nearly 100% of individuals), while there remains significant potential for catch-up in others, especially lower income countries.
Source: OECD calculations based on OECD, ICT Access and Usage by Households and Individuals Database, http://oe.cd/hhind; ITU, World Telecommunication/ICT Indicators Database and national sources, June 2017. See chapter notes.
How to read these figures
Panel A shows the inter-country gap of 16-74-year-old Internet users between 2005 and 2016. In 2016, on average across all OECD countries, 84% of individuals aged 16-74 were Internet users with half of the countries ranging between the first (79%) and the third (93%) quartiles of the distribution. Internet users in the lowest-ranking country represented 58% of the population as opposed to 98% in the highest-ranking country. Panel B indicates the change in Internet use among 16-74 year olds between 2006 and 2016 for each country. In Greece, only about one-third of the population were Internet users in 2006 compared to 70% in 2016.
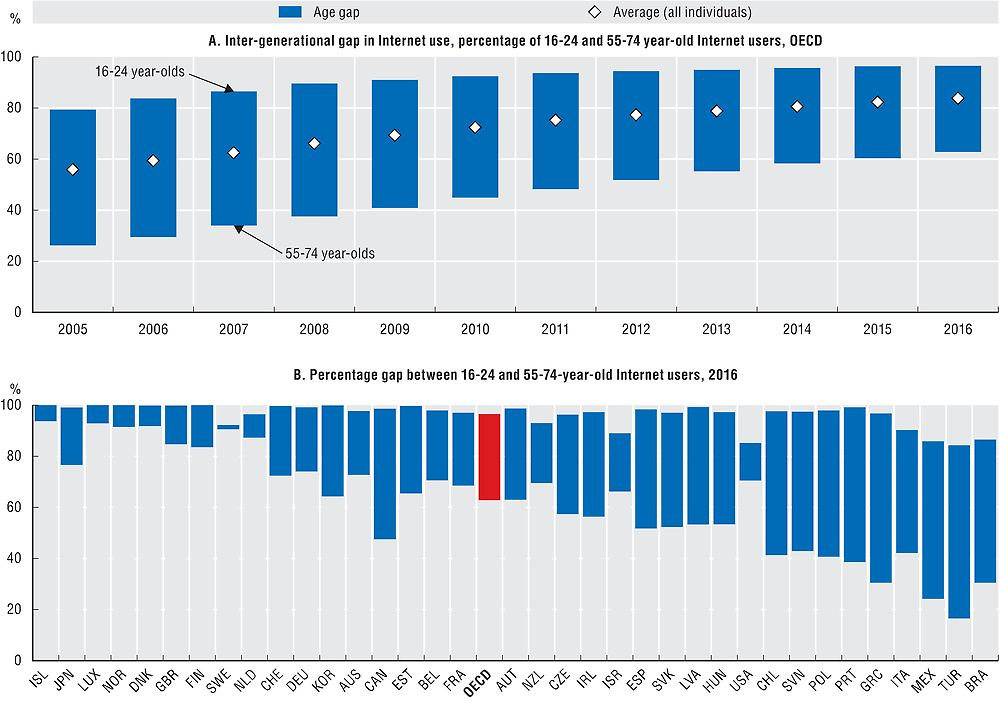
The age gap among Internet users has been closing steadily since 2005. The near future is likely to see further narrowing as technology continues to reduce the cost of online access and today’s “digital natives” become adults. However, there remain significant differences between younger and older generations in a majority of OECD countries, raising the policy issue of digital inclusion of the elderly. In 2016, Internet penetration was slightly above 60% for individuals aged 55-74 as opposed to more than 95% among 16-24 year olds in OECD countries. Cross-country differences remain wide in terms of Internet use by older generations. Over 90% of 55-74 year olds in Denmark, Iceland, Luxembourg, Norway and Sweden reported using the Internet in 2016, against less than 20% in Turkey.
Source: OECD calculations based on OECD, ICT Access and Usage by Households and Individuals Database, http://oe.cd/hhind; ITU, World Telecommunication/ICT Indicators Database and national sources, June 2017. StatLink contains more data. See chapter notes.
Empowering women in science and innovation
Gender equality is an objective of research and innovation policy in many countries and organisations. It aims to promote equal participation and opportunities for women and men, from compulsory education to achieving a better gender balance in research careers from entry positions through to more senior roles. It also entails the integration of the gender dimension in research content, taking into account the biological characteristics and social and cultural features of both women and men. In the OECD area, approximately 30% of graduates in the natural sciences, engineering and ICTs (NSE & ICT) are women, implying considerable under-representation. Women representation among the population of corresponding scientific authors, at close to 22%, is significantly lower than women’s graduation rates at tertiary and doctorate level. Women’s representation is even lower among subgroups of authors with “leadership” characteristics, reflected in high earnings, paid review, editorial activity, as well as a full dedication to research. One potential cause of concern is the relative under-representation of women in certain external engagement activities that are increasingly recognised in governmental research assessment exercises, such as the reported use of research in media reports or technical documents such as patents.

Source: OECD calculations based on OECD, Education Database, September 2017. StatLink contains more data. See chapter notes.

Source: OECD analysis, based on OECD (2016), “International Survey of Scientific Authors: Public use microdata for 2015 pilot study – ISSA1”, OECD, Directorate for Science, Technology and Innovation, http://oe.cd/issa, June 2017. See chapter notes.
The contribution of women to the development of new technologies, as measured by the proportion of patents featuring women inventors, ranges between about 4% in Austria to over 15% in Portugal, on average. In 2012-15, in the United States, 10% of patents were invented by women, compared to 7% in Japan. Significant differences in the share of women inventors are also observed across technology fields. In most countries, the contribution of women to patented inventions is highest in pharmaceuticals (up to 42% in Spain) and biotechnology (49% in Poland), whereas the technology fields where the presence of women inventors is lowest are civil engineering and telecommunications (0.3% in the Czech Republic and Austria). Factors that may contribute to explain these observed patterns include differences in the technological and industry specialisation of countries and in the share of women graduating in science-related fields, and the participation of women in the labour market.

Source: OECD, STI Micro-data Lab: Intellectual Property Database, http://oe.cd/ipstats, June 2017. StatLink contains more data. See chapter notes.
How to identify women inventors?
Identification of women inventors is based on a methodology that relies on country-specific gender-name dictionaries applied to inventors’ names listed in patent documents (for details, see Lax Martínez, Raffo and Saito, 2016). Statistics are available only for economies where more than 80% of inventors’ names can clearly be attributed by gender. As names of inventors from Asian economies remain difficult to disentangle by gender, the indicator could not be compiled for economies such as China or Korea. Data refer to IP5 families by filing date and are grouped according to the inventors’ residence and gender, using fractional counts. Patents are allocated to technology fields on the basis of the International Patent Classification’s (IPC) codes listed in patent documents following the concordance provided by WIPO (2013).
How is women’s representation in science measured?
Estimates of women’s representation in science are based on authors’ self-reported information in the online-based OECD Pilot Survey of Scientific Authors, carried out in 2015 (http://oe.cd/issa). The sample was drawn from documents published in 2011 and indexed in the Scopus database, focusing on the document’s author designated as “corresponding author”. The fields covered in this survey were: Arts and Humanities, Business, Chemical engineering, Immunology and Microbiology, Materials Science, Neuroscience, Physics and Astronomy. Weighted averages take into account the online survey sampling design and non-response patterns by fields, country and journal status. In the chart, women’s absolute and relative representation along various dimensions of scientific research can be assessed through comparison with the 50% benchmark and the share of women in this specific population. Public use microdata files for the ISSA 2015 pilot survey are available for download from the project’s site for research purposes.
Funding long-term, higher-risk research
Research and development (R&D) is a key driver of long-term economic performance. Government plays an important role in supporting investment in this area, especially in cases where the private sector is reluctant to spend due to the scale of investment required, the non-excludability of the resulting assets, or the degree of uncertainty or risk involved.
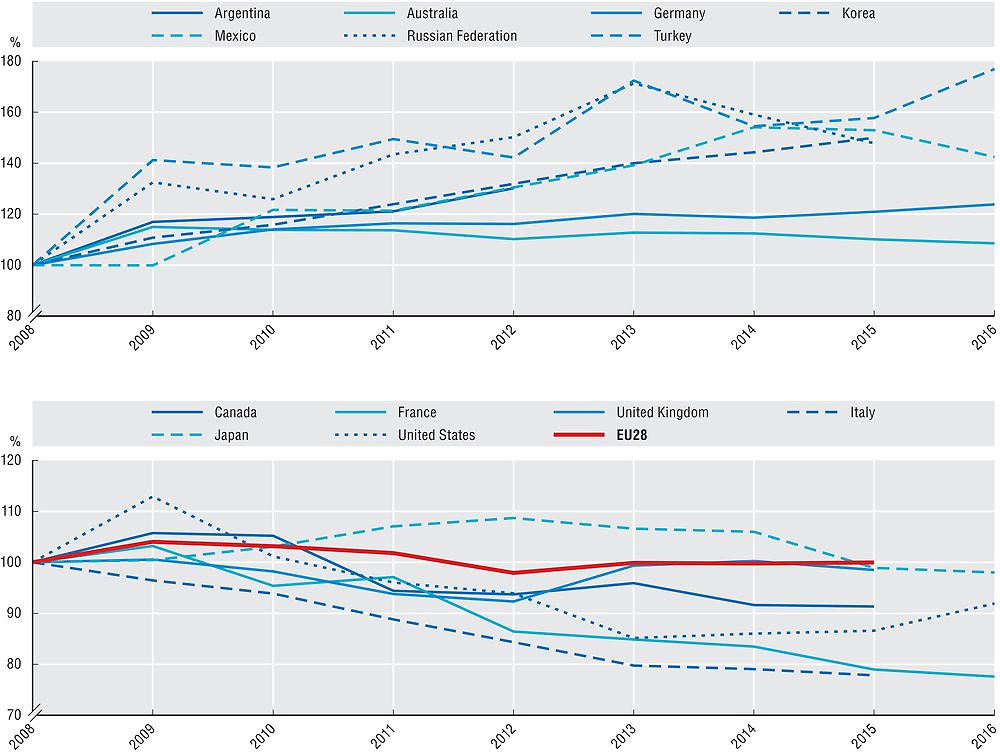
Over the period 2007-16, overall government investment fell both as a share of government spending and as a share of GDP in almost all OECD countries (OECD, 2017b). As a corollary to this, government R&D budgets have levelled-off or declined in many OECD countries and G20 economies. While the level of government R&D budgets in EU 28 countries remained roughly constant over the period 2008-15, France and Italy experienced a decline in real terms of over 20%, with a decrease of over 30% in Latvia and Spain. Government R&D budgets in the United Kingdom and the United States have begun to recover after declining between 2009 and 2012/13. Meanwhile, some countries have witnessed rises in the R&D budget, most notably Turkey (up by almost 80%) and Korea (up by 50%).
In some cases, a fall in government R&D budgets may be partially explained by a re-orientation towards other innovation support instruments, such as R&D tax incentives. However, changes in the R&D support policy mix may impact overall funding for long-term, higher-risk research as R&D tax incentives usually target businesses, which tend to perform less basic research than other sectors.
Source: OECD, Research and Development Statistics Database, http://oe.cd/rds; Eurostat, Statistics on Research and Development, July 2017. StatLink contains more data. See chapter notes.
While governments fund a wide variety of research areas, there is increasing support for long-term and higher-risk research related to societal challenges such as climate change, feeding the growing world population and health conditions such as dementia. In 2016, the United States had a total government R&D budget of USD 149 billion – more than the next nine countries combined. Of this, 60% is allocated to defence and space-related R&D. Turkey and the United Kingdom are the only other OECD countries to devote 20% or more of their government R&D budgets to defence and space R&D. Such data are unavailable for China, Israel, and the Russian Federation.
General advancement of knowledge (GAK) is the main socio-economic objective (SEO) in many countries because it includes all budget allocations earmarked for R&D but which cannot be attributed to a specific objective, as well as all R&D financed from general purpose grants from ministries of education. Further details are available for a subset of 15 European countries, with natural sciences being the main recipient of these funds for R&D.
In many countries, a sizeable proportion of funding is allocated to agriculture, environment and earth exploration, in order to address key societal challenges related to sustainably feeding the growing global population and mitigating climate change. Industrial production, technology, energy and infrastructure also accounts for a large share. The share earmarked for social structures and relationships, which includes R&D related to improving educational provision, is generally relatively small.
Across OECD countries, defence and space-related R&D budgets fell in real terms, from 32% in 2006 to 24% in 2016. Defence R&D bore the brunt of these reductions, most notably in France (-80%), and Sweden (-77%). Only Korea and Poland experienced rises in defence R&D budgets. GAK rose from 28% to 32% over the same period with other areas remaining relatively stable.

Source: OECD, Research and Development Statistics Database, http://oe.cd/rds; Eurostat, Statistics on Research and Development, July 2017. StatLink contains more data. See chapter notes.
How is direct government support of R&D measured?
Data on “government budgetary allocations for R&D” (GBARD) encompass all allocations from sources of government revenue (e.g. taxes) foreseen within the budget. Only funds allocated through the government budgetary process are included; extra-budgetary units and public corporations’ funds are excluded. These data are typically more timely than R&D survey data, but may not precisely follow the OECD Frascati Manual definition of R&D due to limited detail in budgetary systems. Likewise, allocating R&D-related items to socio-economic objectives (SEOs) can be challenging. In some cases, funding for a long-term R&D project may be allocated in a single year. For a number of G20 economies (e.g. China and the Russian Federation), it is not possible to distinguish budgetary support for R&D from other public investments in STI. Further data are available from http://oe.cd/rds.
Addressing global challenges: Dementia
As with many neurodegenerative diseases (NDDs), dementia is a debilitating condition for which there is currently no cure. Both the human and financial costs of dementia are of growing concern, especially given the ageing worldwide population. Scientific research is a cornerstone of efforts to address this global challenge, leading the OECD to issue a call for action to rebalance the risks and rewards of research in order to encourage a broader approach that helps target the disease from an early stage (OECD, 2015b). Experimental analysis of scientific publications’ abstracts over two decades shows a steady increase in research related to dementia among leading countries up to 2012. Thereafter, the rising trend slowed in most leading countries including the United States, where 1.2% of the government’s research budget was estimated to be allocated to NDDs in 2012 (OECD, 2015b). This cannot be accounted for by the incomplete indexing of publications in recent years that is common to bibliometric databases – which should only affect 2015 and 2016 values. However, China has made major strides in this area from a very low initial base.

Source: OECD calculations based on Scopus Custom Data, Elsevier, Version 4.2017, July 2017. StatLink contains more data. See chapter notes.
Which documents are related to dementia?
These experimental estimates are based on searches for the text items “neurodegenerat*”, “dementia” and “Alzheimer” in the abstracts of articles published between 1996 and 2016 in the Scopus database. Neurodegenerative diseases include Alzheimer’s disease and related dementia, Huntington’s disease, Parkinson’s disease and a range of motor neuron diseases. While there is a risk of capturing documents that are not strictly relevant (false positives), the main challenge is to capture all relevant documents with the chosen keywords, minimising the incidence of false negatives in the selection process. This risk is higher for basic brain research with no specific application in sight being alluded to in the abstract. The accuracy of this approach depends on the comprehensiveness of abstract indexing, which implies a bias towards English-speaking journals.
Data on the disciplinary areas of journals in which dementia-related papers are published show the contribution of a wide range of fields, from neuroscience and pharmacology to psychology and nursing. Consistent with a recent OECD analysis of government R&D budgets for research on neurodegenerative diseases (OECD, 2015b), a significant share of these efforts (as implied by publication outputs) is devoted to areas related to the understanding of the basic science behind the disease (e.g. neuroscience, biochemistry). Efforts in the areas of clinical or healthcare-related research for dementia can be implied from the fields of medicine (largest by number), nursing and psychology. The fast growth in the importance of computer science testifies to the crucial role of big data in addressing the complexity of dementia as a means to advance the understanding of risk reduction factors, care and treatment.

Source: OECD calculations based on Scopus Custom Data, Elsevier, Version 4.2017, July 2017. StatLink contains more data. See chapter notes.
How are the disciplinary areas identified?
The disciplinary areas are based on Elsevier’s classification approach whereby each journal in Scopus is assigned to one or more subjects using its “All Science and Journal Classification” (ASJC). This comprises 27 main fields and 334 more narrowly defined subjects. Results are presented for the main fields on a fractional basis. In the case of documents in general journals, each document is apportioned across substantive areas based on the distribution of citing and cited documents ASJC fields. Further work is necessary to understand the extent and nature of interdisciplinary in this area. For example, evidence of interdisciplinarity can be found in instances of highly cited documents on the use of graphene (a nanotechnology product) in the early detection of dementia in patients.
Opening access to science
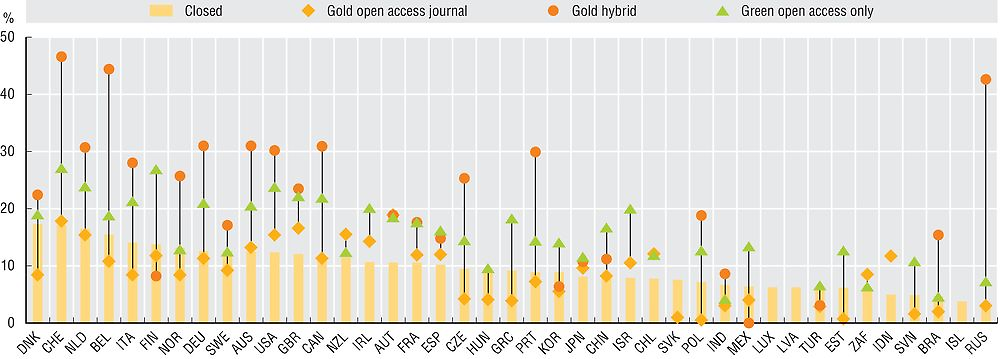
Access to scientific research articles plays an important role in the diffusion of scientific knowledge. Today’s digital opportunities facilitate the sharing of scientific knowledge to promote its use for further research and innovation. The promotion of open access (OA) to publications is relevant to open science (i.e. efforts to make the outputs of publicly funded research more widely accessible in digital format to the scientific community and to society more broadly). A new and experimental indicator, based on online queries for documents about one year after publication, reveals that 60% to 80% of content published in 2016 is only available one year after to readers via subscription or payment of a fee. Journal-based OA (gold) is particularly noticeable in Brazil, as well as in many other Latin American economies. Repository-based OA (green) is especially important for authors based in the United Kingdom. Nowadays, about 5% of authors appear to be paying a fee to make their papers publicly available within traditional subscription journals (gold hybrid).

Source: OECD calculations based on Scopus Custom Data, Elsevier, Version 4.2017; and roaDOI “wrapper” routine for the oaDOI API, https://oaDOI.org, July 2017. StatLink contains more data. See chapter notes.
How to measure open access using online tools
The last edition of this publication measured open access to scientific publications using the results of an online survey of scientific authors worldwide carried out by OECD (http://oe.cd/issa). This edition derives the indicator from an automated online query on a random (non-stratified) sample of 100 000 citable documents (articles, reviews and conference proceedings) published in 2016 and contained in the Scopus database, with associated DOIs (over 90% of cases). Assessment of the OA status of the documents was conducted in June 2017 using the R-language based “wrapper” routine for the oaDOI application programme interface (API) produced by ImpactStory, an open-source website that works to help researchers explore and share the online impact of their research. The API returns information on the ability to secure legal copies of the relevant document for free and the different mechanisms:
Gold open access journal applies to documents associated to publishers included in the Dictionary of Open Access Journals that make their content openly available at no charge to readers.
Gold hybrid indicates that a document is accessible from a publisher that typically requires subscription for general access, but allows open access to the specific document, normally with the author or their sponsors paying article processing charges that provide for open access by third parties (as for most gold open access journals).
Green open access indicates that legal versions of the document exist in repositories or related outfits, and do not match either of the gold categories. This value may be underestimated if the oaDOI fails to identify all legally available copies or nearly identical versions.
When the DOI cannot be resolved to any source of access information, the result is marked as “No information - status not available”. This category is particularly high for China at more than 15%. When the DOI resolves and the return indicates that there are no legal open versions available, the document is marked as “Closed”. This includes documents under embargo.
Assessing the extent to which open access (OA) publications receive more citations than non-OA publications helps policy makers evaluate the social costs and benefits of alternative scientific publication funding mechanisms. This has led to efforts to measure the so-called “open access citation advantage”. Bibliometric results using the latest wave of data available confirm previous survey results presenting a mixed picture (OECD, 2015c; Boselli and Galindo-Rueda, 2016), as not all forms of OA appear to confer an advantage. OA is associated overall with higher citation rates among documents covered by major indices, but this does not apply to documents published in OA journals, which on average tend to be more recent and present lower historical citation rates. Repository-based (green) OA systematically confers a citation advantage. In most cases, higher citation rates are found within countries among “gold hybrid” documents (i.e. those published in subscription journals whose authors pay publishers a fee to enable free online access on the part of potential readers).
Source: OECD calculations based on Scopus Custom Data, Elsevier, Version 4.2017; and roaDOI wrapper for the oaDOI API, https://oaDOI.org, July 2017. StatLink contains more data. See chapter notes.
The impact of open access beyond citation by peers
Citation rates are imperfect measures of scientific impact, even when normalised by field, cohort and type of document. A major concern is that they do not capture the relevance and usefulness of the research to a wider community of potential users of scientific knowledge, who are less likely to publish in peer-reviewed scholarly journals (e.g. general medical practitioners, inventors in business, government officials, etc.). Based on self-reported information by authors, the OECD ISSA1 study shows that open-access documents are more likely to have been cited in a broader set of use settings, such as government reports, patents, legal cases or practitioner protocols, as well as non-peer-reviewed working papers. Given the increasing digital fingerprint of many of those activities, Internet-based metrics are increasingly being used to provide information on broader types of impacts. However, one possible drawback is that these metrics may actually provide measures of “popularity” and in turn distort behaviours if used to conduct research assessment (http://oe.cd/blue-sky). Analysis of the link between different forms of open access to scientific documents and research impact appears to point to a potential decoupling of the quality assurance and access roles traditionally played by academic journals.
Promoting international collaboration and mobility
Collaboration within and across countries is a pervasive feature of research and innovation activities worldwide, and a key driver of knowledge exchange. International collaboration can be documented by tracking the affiliation(s) of co-authors of scientific publications and co-inventors of patented inventions. With the exception of India and Indonesia, all BRIICS (white circles) and OECD countries (blue circles) display higher rates of scientific collaboration than international co-invention. While exhibiting similar levels of engagement in international co-authorships, scientifically and technologically advanced economies such as Japan, Korea and the United States present different levels of co-inventorship, with Asian inventors being relatively less engaged in cross-country collaboration. Small, open economies tend to display higher collaboration rates. Factors such as scientific and technological specialisation, collaboration opportunities, and geographical and institutional proximity may help explain these patterns.

Source: OECD calculations based on Scopus Custom Data, Elsevier, Version 4.2017 and OECD, STI Micro-data Lab: Intellectual Property Database, http://oe.cd/ipstats, July 2017. StatLink contains more data. See chapter notes.
Interpreting the indicators
International co-inventions are the share of inventions that include at least one foreign co-inventor in total patents invented domestically. Data refer to IP5 patent families (inventions patented in the five top IP offices) filed in 2005-15 according to the inventor’s residence, by first filing date and according to the inventor’s residence, using whole counts.
International co-authorship of scientific publications is measured in terms of the share of articles featuring authors affiliated with foreign institutions (from a different country or economy) in total articles produced by domestic institutions. For comparability with data on co-inventions, a whole counts approach is used in this case. This results in larger estimates than presented on a fractional basis in Chapter 3 of this publication.
Indicators of international scientist mobility, based on changes in authors’ affiliations, reveal that mobility is mostly characterised by mutual “brain circulation”, rather than one-directional flows (“brain gain/drain”). However, analysis of net entry and exit flows of scientific authors over time can be highly informative, especially with regard to a science system’s response to events and policies adopted by countries linked to the funding of scientific research, support for scientific international mobility and policies designed to attract the highly qualified. Data on net flows since 2001 show that Switzerland, the United States and Australia attract the largest numbers of scientists, followed closely by China, which has gone from being a large net “donor” to becoming the largest net recipient among major economies. In the United States, the net entry of scientists has slowed in recent years. Japan and India have accumulated net losses, while the Russian Federation began to attract more publishing scientists since 2014. The EU28 area became a net attractor for a short period in 2008-09, but registered a very significant deficit after 2011. Over the last 15 years, almost 36 000 more scientific authors left the EU than entered. This is explained in part by the return mobility of individuals who arrived as students before becoming published scientists. There are significant variations across the largest EU28 countries, with the United Kingdom attracting scientists in 2014-16, while Spain joined Italy in becoming the largest relative net donors among economies with high levels of scientific output.

Source: OECD calculations based on Scopus Custom Data, Elsevier, Version 4.2017, July 2017. StatLink contains more data. See chapter notes.
How to read this figure
This figure decomposes the overall net flow of scientific authors across different years for OECD countries and BRIICS economies over the period 2001-16, expressed in relative terms. This helps to identify the timing and intensity of different phases of net entry and net exit from the perspective of a given country. For example, Germany and Spain experienced a similar cumulative net loss over the period (see the diamond value on the right-hand scale). In the case of Spain, this is the result of a phase of moderate gains in the 2000s, followed by a significant net outflow of scientific authors after the crisis. In contrast, Germany’s pattern is relatively more stable and it has reduced its deficit in recent years.
Monitoring changes in scientist affiliations in global repositories of publications provides a complementary source of detailed information. However, its scope is limited to authors who publish and do so regularly, as otherwise their affiliations cannot be detected and timed in a sufficiently accurate way. Mobility can only be computed among authors with at least two publications. These indicators are likely to understate flows involving countries and fields where there are moves to industry or organisations within which scholarly publication is not the norm. Furthermore, the measurement of mobility can be hard to disentangle from that of collaboration in the case of authors with multiple affiliations in different countries. A fractional mobility count approach has been used in this case.
Supporting business innovation
Government support for business R&D seeks to encourage firms to invest in knowledge that can result in innovations that transform markets and industries and result in benefits to society. Governments can adopt various instruments to incentivise R&D by business. In addition to direct support such as grants and buying R&D services, 30 out of the 35 OECD countries provided fiscal incentives in 2017, up from 16 OECD countries in 2000. As R&D is highly concentrated in large firms, the latter tend to be the main recipients of direct and tax support for business R&D (BERD). New OECD analysis sheds light on the distribution of support by business size for a number of countries. The SME share in R&D tax support ranges from 5% in Hungary to 71% in Latvia and 79% in Norway (small companies only). While direct support is by and large discretionary, the SME share in tax support tends to be more closely aligned with the SME share in BERD, confirming the notion that tax incentives are generally a demand-driven complement to direct government support for R&D. It is worth noting that the SME share in tax support exceeds the share of direct funding in Austria, Canada, France, the Netherlands, Norway and the United Kingdom. All these countries offer refundable R&D tax incentives that particularly target smaller R&D performers, allowing them to make use of earned tax credits even in the case of insufficient tax liability where any excess credits are paid in full or in part to the taxpayer.

Source: OECD, R&D Tax Incentive Indicators, http://oe.cd/rdtax, July 2017. See chapter notes.
How to measure R&D tax incentives
OECD estimates of the cost of R&D tax incentives are combined with data on direct R&D funding, as reported by firms through R&D surveys, to provide a more complete picture of government efforts to promote business R&D. These efforts can now be mapped over time. The OECD data collection on R&D tax incentives (now in its fifth edition) attempts to identify and address subtle differences in the tax treatment of R&D, the relevant tax benchmark and measurement approaches. National experts on science and technology indicators have collaborated with public finance and tax authorities to provide the most up-to-date and internationally comparable figures possible. The estimated cost of provisions for the treatment of R&D expenditures by firms is presented relative to a common benchmark (full deductibility of current R&D) whenever possible. Estimates reflect the sum of foregone tax revenues – on an accruals basis – and refunds where applicable. The latest edition of the OECD Frascati Manual incorporates a new chapter dedicated to the measurement of R&D tax incentives (OECD, 2015a): see http://oe.cd/frascati.
This specific indicator is presented on a experimental basis. International comparability may be limited (e.g. due to variations in SME definitions for business R&D versus R&D tax relief reporting purposes). For BERD and government-funded BERD, SME figures generally refer to enterprises with 1 to 249 employees (i.e. excluding firms with zero employees), unless otherwise specified. A number of countries adopt additional criteria to define SME status. For SME definitions, see http://oe.cd/sb2017_notes_rdtax.
Across countries, R&D intensity in the business sector has a positive correlation (0.3) with the level of government support to business R&D, with some notable exceptions. Germany and Korea present relatively high business R&D intensities compared to their degree of measured government support, while France, Hungary and the Russian Federation have high rates of support relative to countries with similar business R&D-to-GDP ratios. A complementary indicator compares the evolution of government support for R&D and business R&D intensity. Over the 2006-15 period, countries with the largest increase in government support exhibited higher growth in R&D intensity. China and Korea’s growth in R&D intensity is higher than predicted by their change in measured government support. Changes in government support appear to account for approximately 17% of the observed variation in business R&D intensity over the 2006-15 period. Additional analysis shows that almost two-thirds of this explained variation is accounted for by changes in direct support and the remainder by tax support.

Source: OECD, R&D Tax Incentive Indicators, http://oe.cd/rdtax, July 2017. StatLink contains more data. See chapter notes.

Source: OECD, R&D Tax Incentive Indicators, http://oe.cd/rdtax, July 2017. StatLink contains more data. See chapter notes.
Financing entrepreneurship and innovation
Access to finance for new and innovative small firms involves both debt and equity finance. Venture capital (VC) and business angel investments are important sources of equity funding, especially for young technology-based firms. Available industry level data show that VC investments in 2016 were concentrated mostly in the ICT sector, especially in countries such as Estonia, Spain and the Slovak Republic. In Europe, data for 2015 show that more than one-third of business angel deals involved the ICT sector, while in the United States, data for 2016 show that 45% of all deals related to software, Internet and mobile phones.

Source: OECD, based on OECD Entrepreneurship Financing Database, September 2017. See chapter notes.

Source: OECD calculations based on ARI (Angel Resource Institute) and networks surveyed by EBAN (European Trade Association for Business Angels, Seed Funds and other Early Stage Market Players), September 2017. See chapter notes.
Measuring venture capital and angel capital
Data on VC are drawn from national or regional venture capital associations and commercial data providers. There is no standard international definition of VC or an available breakdown by stage of development and industry. The OECD Entrepreneurship Financing Database aggregates original data to fit the OECD classification of venture capital by stages and by aggregate industries. Increased co-operation among national/regional VC data providers is likely to improve data availability to provide internationally comparable information on VC investment in different sectors across countries. Angel capital data are collected from the angel networks and groups surveyed by business angel associations. Data on angel investment are difficult to assess due to the discrete nature of such financing (leading to an “invisible market”) and differences in definitions across countries regarding what constitutes an angel investor. In addition, survey-based data typically suffer from inconsistencies regarding the year-on-year number of respondents, as well as from incomplete market coverage (OECD, forthcoming).
Experimental indicators relying on detailed data from Crunchbase© reveal that the majority of equity funds flowing into digital-related start-ups is concentrated in the apps, data and analytics industries. From 2011 to 2016, equity funding in these two sectors accounted for 80% of all equity funding in the digital-related sectors in Estonia and Latvia, and 70% in China.

Source: Crunchbase© data, www.crunchbase.com, September 2017, as reported in Breschi, Lassebie and Menon (forthcoming). See chapter notes.

Source: Crunchbase© data, www.crunchbase.com, September 2017, as reported in Breschi, Lassebie and Menon (forthcoming), September 2017. See chapter notes.
Insights from Crunchbase©
Crunchbase© provides information on start-up activity and financing within and across countries worldwide. Available variables include company size class, location (city and region), primary role (firms, group, investor or school), status (operational, acquired, IPO or closed), founding date and the dates on which the record was created and updated, respectively. For more information, see Dalle, Denbesten and Menon (forthcoming). In the figures presented here, the sample is restricted to firms founded after 2010 (i.e. five years old or less in 2016) that attracted equity funding over the 2011-16 period. Equity funding includes venture capital and other risk finance such as business angel investments or debt financing. Digital-related sectors are identified on the basis of correspondence between the sectors available in the database with the ISIC Rev.4 industry list. Results reported here should be considered as an initial exploration of Crunchbase© data for the purposes of statistical and economic analysis.
Promoting scientific excellence
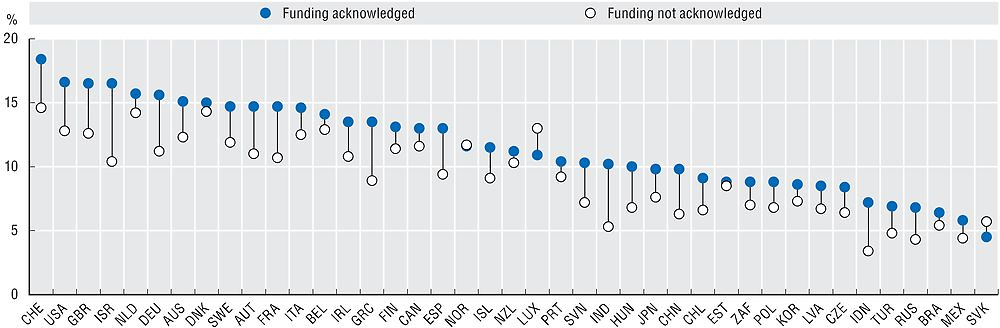
How effective are different mechanisms for funding scientific research? A new and experimental indicator explores the extent to which publishing scientists secure direct funding for their research based on whether authors acknowledge funders in their publications. This provides an approximate, bottom-up view of the extent of activity-specific (and likely competitive) funding, from the viewpoint of researchers, that is linked to scientific outputs. Authors who do not cite specific funders are more likely to rely on institutional resources for research, including their own salaries. Authors based in China, Korea and the United States – where project-based funding is most common – are the most likely to acknowledge sources of funding in their papers. In contrast, authors based in Italy and France presents some of the lowest funding acknowledgement rates, reflecting the relatively higher importance of institutional funding in those countries. A comparison of citation patterns within countries reveals that funding acknowledgement is associated with a significantly higher excellence rate, measured by the proportion of each class that features among the world’s 10% most-cited documents in their field and cohort. This result may be indicative of selection by funders of the most “impactful” activities or a reflection of the benefits of securing additional funding. Assessing the relative efficiency of alternative resource allocation mechanisms requires additional information on funding amounts and selection mechanisms as applied at the micro level. This calls for a more fine-grained data infrastructure to complement the top-down view provided by government R&D budget statistics.

Source: OECD calculations based on Scopus Custom Data, Elsevier, Version 4.2017, July 2017. StatLink contains more data. See chapter notes.
Source: OECD calculations based on Scopus Custom Data, Elsevier, Version 4.2017; and 2015 Scimago Journal Rank from the Scopus journal title list (accessed June 2017), July 2017. StatLink contains more data. See chapter notes.