2. Growth, jobs and the digital transformation
Robotisation in manufacturing
Production is being transformed by advances in fields such as big data, 3D printing, machine-to-machine communication and robots. Comparable and representative data for 2015 on the deployment of industrial robot technologies, for example, show that Korea and Japan lead in terms of robot intensity (i.e. the industrial stock of robots over manufacturing value added). Robot intensity in these economies is about three times that of the average OECD country. Selected Eastern European countries also emerge as intensive robot users, perhaps mirroring their specialisation within manufacturing value chains and their possible role as suppliers of large multinational corporations. Robot intensity in Czech Republic, Hungary, the Slovak Republic and Slovenia has increased three to six times since 2005, considerably above the average growth rate for OECD or EU28 countries (+29% and 54%, respectively). Robot intensity in BRICS economies has also increased, while remaining relatively low compared to OECD countries. In particular, robot intensity in China increased from 23% to 88% of that of the United States. However, these figures should be interpreted with caution, since the indicators are based on the quantity of robots active in an economy at a specific moment and do not capture changes in the effectiveness or quality of robots over time.

Source: OECD calculations based on International Federation of Robotics data, and the World Bank, Word Development Indicators Database, September 2017. StatLink contains more data. See chapter notes.
What is an industrial robot?
An industrial robot is defined by ISO 8373:2012 as “an automatically controlled, reprogrammable, multipurpose manipulator programmable on three or more axes, which can be either fixed in place or mobile for use in industrial automation applications”. The International Federation of Robotics (IFR) collects information on shipments (counts) of industrial robots from almost all existing robot suppliers worldwide. The measure of the stock of robots displayed above has been calculated by taking the first-year stock value from the IFR, adding the sales of robots for subsequent years and assuming an annual depreciation rate of 10%. As a consequence, these metrics do not capture increases in the value of robots or their ability to perform tasks (i.e. no equivalent for horsepower exists for robots). These figures are restricted to manufacturing, mining, construction and utilities, as IFR data obtained by the OECD do not include robots used in services industries other than the R&D sector.
In addition to catalysing growth, technological innovations may have disruptive effects with far-reaching consequences on many domains, including productivity, employment and well-being. Some fear that the increasing use of robots may result in significant loss of jobs, particularly in the case of industrial robots which are designed to carry out tasks otherwise performed by humans. Recent studies find that robots do improve productivity, but that their impact on employment and wages is ambiguous. The figure below shows that the use of robots may complement the use of other technologies, because robots (while not classified as ICT tools) rely on ICT, e.g. software, for their functioning. Workers will therefore need the ICT skills to be able to operate them. The correlation between ICT use on the job and robot intensity emerges as positive, albeit not strong, and points to complementarity between technological and human capital investment to implement transformative industrial processes. As these data relate to the use of robots in manufacturing, economies characterised by relatively larger manufacturing sectors have higher than average robot intensities. Some, including Japan, Korea, Germany and the United States, display above average intensities for both robots and ICT tasks. Conversely, economies where services sectors are relatively more important (e.g. the United Kingdom, Ireland and the Netherlands) tend to display above average ICT task intensities, but a lower than average number of robots per worker.

Source: OECD calculations based on OECD Programme for International Assessment of Adult Competencies (PIAAC) Database and International Federation of Robotics, September 2017. See chapter notes.
How to measure ICT task intensity
Recent OECD analysis has developed an indicator of the ICT task intensity of occupations (Grundke et al., 2017), based on information from the OECD Programme for the International Assessment of Adult Competencies (PIAAC). Compared to earlier studies, this approach helps to distinguish between the tasks that workers perform on the job and the skills with which they are endowed. The indicator reflects the extent to which workers perform tasks ranging from simple use of the Internet to the use of Word or Excel software or a programming language. Not all countries in Figure 28 are reported in Figure 29, because they do not appear in the PIAAC dataset and consequently lack a corresponding measure of ICT task intensity.
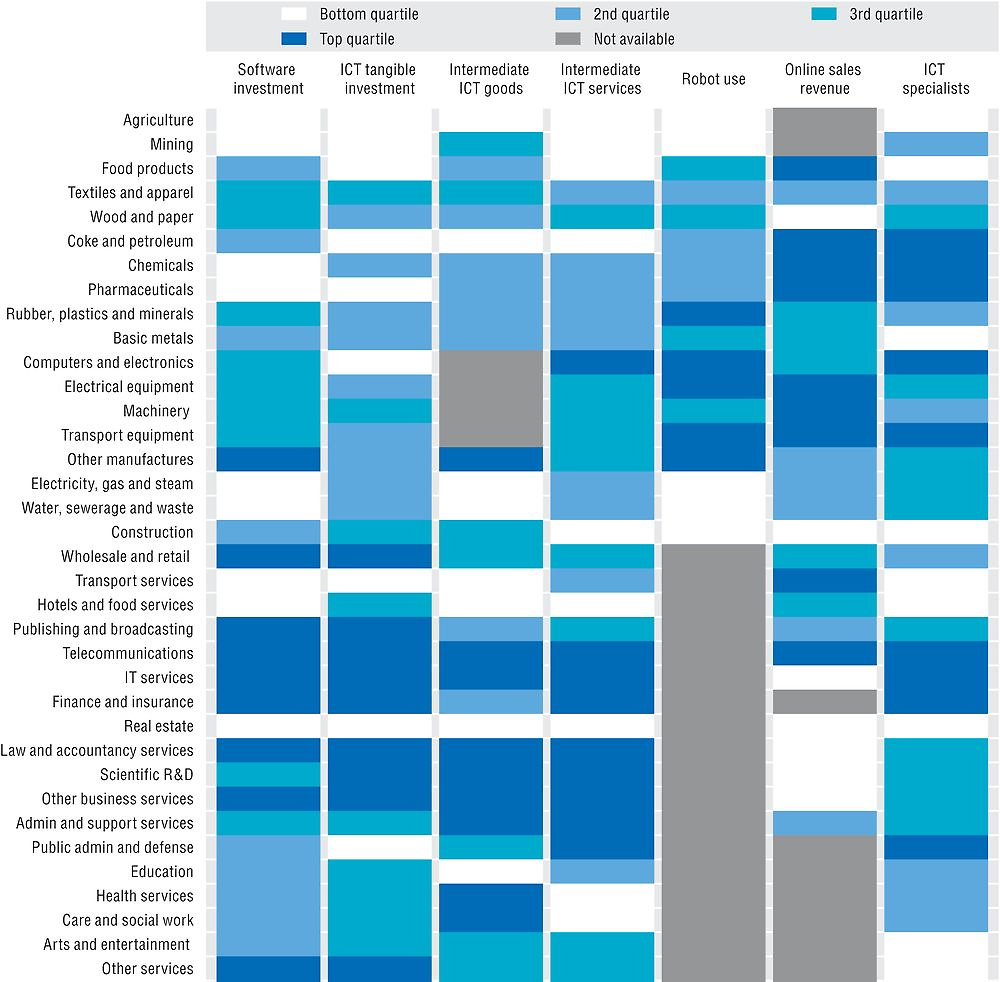
Industries’ digital maturity
Due to their pervasive nature, digital technologies are profoundly transforming economies and societies. The innumerable ways in which the digital transformation is affecting production activities, manufacturing and services impede efforts to provide an encompassing definition of this multifaceted phenomenon. Recent OECD work assesses the digital content of sectors by looking at digitalisation in its technological component (tangible and intangible ICT investment, purchases of intermediate ICT goods and services, robots), the human capital required to embed technology in production (ICT specialist intensity), and the ways in which it changes how firms interface with the market (online sales). While the digital transformation progressively touches all sectors in the economy, it does so in different ways and to various extents across sectors. Some sectors, however, stand out across several dimensions. “IT and other information services” ranks among the top three sectors for all indicators, where such information is available, with the exception of online sales. However, its manufacturing equivalent (i.e. the Computer, electronic and optical equipment sector), does not stand out from other sectors.

Source: OECD calculations based on Annual National Accounts, STAN, ICIO, PIAAC, International Federation of Robotics, World Bank, Eurostat Digital Economy and Society Statistics, national Labour Force Surveys, US CPS, INTAN-Invest and other national sources. See chapter notes.
How to read this figure
Each dot represents a sector. For each indicator, a sector’s value is obtained averaging the values across years and countries. The graph then plots the standardised values across sectors, so that the average sector has value zero. The blue dots represent manufacturing sectors, and the grey ones represent services industries. The darker blue and grey dots represent ICT manufacturing and ICT services sectors, respectively.
Measuring the digital transformation in sectors: A multidimensional approach
Recent OECD work (Calvino et al., forthcoming) develops a taxonomy of sectors by their digital content, taking into consideration a multiplicity of dimensions. All indicators are expressed as sectoral intensities. “Software and ICT tangible investment” is the ratio of Gross Fixed Capital Formation (GFCF) in ICT and software over total GFCF, both in volumes. “Intermediates” represents the ratio of intermediate ICT goods or services purchased by the sector to the purchasing sector’s output, both in real terms. “Robot use” refers to the stock of robots divided by employment in the sector. “Online sales” measures the proportion of turnover coming from online sales. “ICT specialists” relates to the proportion of ICT specialists in total employment. The taxonomy is based on information for the following countries: Australia, Austria, Denmark, Finland, France, Italy, Japan, the Netherlands, Norway, Sweden, the United Kingdom and the United States, for which values for all indicators in all considered sectors and years are non-missing, with the exception of “Robot use” and “Online sales”, where some sectors are not sampled.
Sectors generate, adopt and use technologies at different paces and vary in the extent to which they rely on different types of skills. This is true for the wide array of technologies and skills shaping the digital transformation across economies and societies. OECD analysis shows that some sectors are lagging behind others in terms of the pace of are undergoing digital transformation, regardless of the type of indicator used to measure such a transformation. Agriculture, mining and real estate rank in the bottom quartile of digital intensity across all available indicators. Conversely, telecom and IT services rank consistently at the top of the distribution. Sectors in the middle of the overall ranking often display a large heterogeneity, suggesting that they are engaged in the transformation at different rates, depending on the aspects considered.
Source: OECD calculations based on Annual National Accounts, STAN, ICIO, PIAAC, International Federation of Robotics, World Bank, Eurostat Digital Economy and Society Statistics, national Labour Force Surveys, US CPS, INTAN-Invest and other national sources. StatLink contains more data. See chapter notes.
How to read this figure
For each indicator, sectors are ranked by their value as an average across countries and years. The sectors with the highest intensity (top quartile) are coloured dark blue, while those with the lowest intensity are coloured white. Data on robot use are not available for services other than utilities and constructions (i.e. all ISIC Rev.4 services above 43), while online sales data are not available for “Agriculture” (Division 1-3), “Mining” (5-9), “Financial services” (64-66) and all sectors numbered above 84 in ISIC. Purchases of ICT intermediate goods by the machinery manufacturing sectors are not considered, to avoid mismeasurement.
What skills for the digital future?
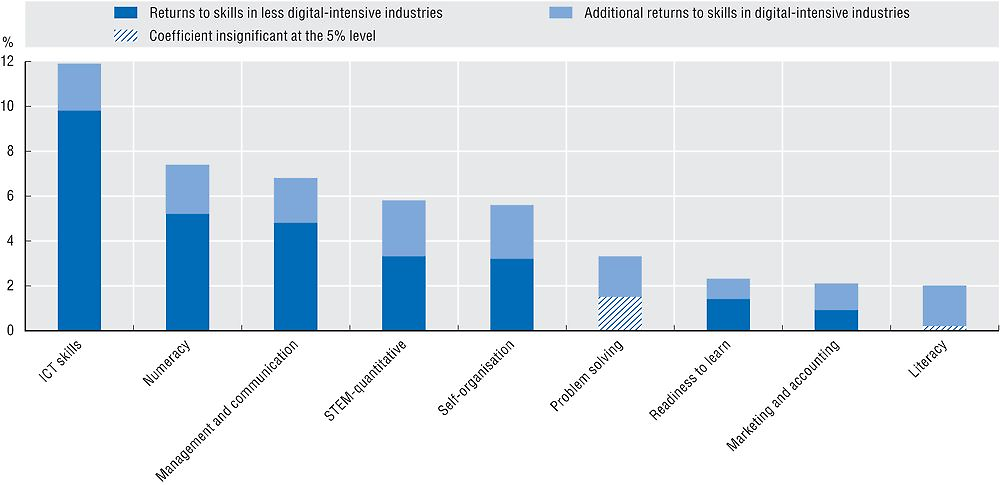
Digitalisation is bringing change to jobs and labour markets across the OECD and beyond. Some jobs are being lost to automation, others will change in their nature and tasks, while new jobs will also emerge as technologies such as artificial intelligence (AI), the Internet of Things (IoT) or big data develop. Workers in industries that are currently most affected by the digital transformation exhibit higher levels of cognitive, as well as non-cognitive and social skills. As the digital transformation unfolds, and increasingly affects other industries that are at present less impacted, the need for solid cognitive skills combined with a good endowment of social skills will continue to increase and extend to the rest of the economy.

Source: OECD calculations based on the OECD Programme for International Assessment of Adult (PIAAC) Database, June 2017. See chapter notes.
Mapping skills and identifying digital-intensive sectors
This analysis encompasses both cognitive and non-cognitive skills, i.e. skills that are generally only partially learnt at school and that relate to people’s attitudes and personality. Measures for non-cognitive skills and social skills have been developed using information about the tasks that workers perform on the job from the OECD Programme for International Assessment of Adult (PIAAC). The mapping exercise has identified six task-based skills that relate to performance on the job and to economic performance, namely: information and communication technologies (ICT)-related skills; science, technology, engineering and mathematics (STEM) and quantitative skills; non-cognitive skills such as managing and communication and self-organisation; and socio-emotional skills such as readiness to learn and creative problem solving (see Grundke et al., 2017)
Digital-intensive and non-digital-intensive industries have been identified by benchmarking sectors across a number of dimensions: the ratio of Gross Fixed Capital Formation (GFCF) in ICT and software over total GFCF; the ratio of intermediate ICT goods or services purchased by the sector to the purchasing sector’s output; the stock of robots per employed person; the proportion of sectoral turnover coming from online sales; and the proportion ICT specialists over total employment, by sector (see Calvino et al., forthcoming, for details).
Understanding which skills are in short supply (and/or high demand) and command a wage premium in digital- or less-digital-intensive industries can help understand what skills matter for the digital transformation.
For a number of skills that are important to firm performance, labour market returns are higher in digital-intensive industries than in less digital-intensive industries. Furthermore, quantitative skills, ICT skills, numeracy and STEM skills as well as self-organisation and management and communication skills seem to be especially important in digital-intensive industries. This may be because workers in those industries operate in a more independent and decentralised fashion (e.g. through teleworking), perform relatively more non-routine tasks, or have to deal with continuously changing settings for which technical skills coupled with communication and organisational skills are increasingly important.
Source: OECD calculations based on the OECD Programme for International Assessment of Adult Competencies (PIAAC) Database, June 2017. See chapter notes.
Jobs gained, jobs lost
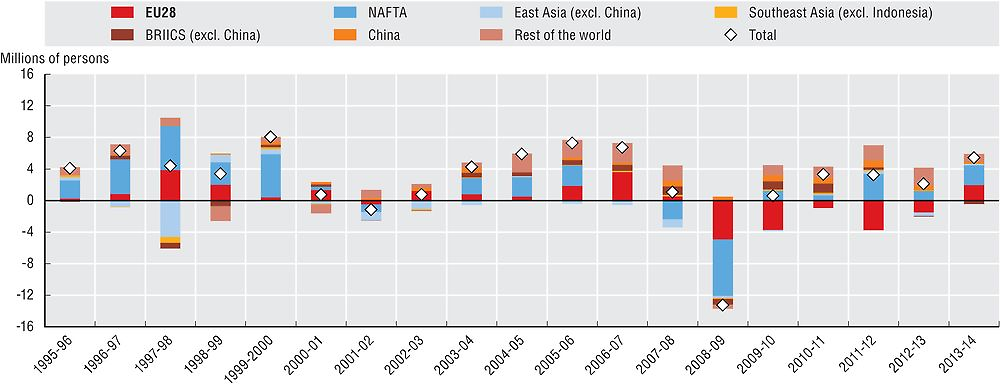
Between 2010 and 2015, total employment in the OECD area grew by 4.9% (a net gain of about 27 million jobs). This increase was driven mainly by non-EU countries, with NAFTA alone experiencing a net gain of 12.9 million compared to a more modest gain of 3.6 million in the European Union. OECD service sectors accounted for the majority of net gains with an increase of 24.8 million, while manufacturing activities added a further 2 million jobs. In 2016, the European Union experienced solid gains for the third year running, with an overall net gain for the period 2010-16 of 6.4 million jobs, including a notable rise in “Professional, scientific, technical and other business services” (3.9 million jobs). However, this trend masks significant variation with Germany and the United Kingdom both experiencing net gains of about 2.5 million jobs, while Greece, Portugal and Spain struggled to return to pre-crisis levels of employment collectively suffering a net loss of 1.5 million jobs over the same period.

Note: Data refer to 2010-15 for Israel, Japan, Korea, Mexico, New Zealand and the OECD area aggregate.
Source: OECD calculations based on Annual National Accounts Database, www.oecd.org/std/na, Structural Analysis (STAN) Database, http://oe.cd/stan and national sources, September 2017. See chapter notes.
How to read these figures
Changes in employment levels by economic activity can be “normalised” to highlight their relative contributions, in each country, to the total change in employment between two periods. This is achieved by expressing the sectoral changes in each country as a percentage of the sum of the absolute changes. The aggregate activity groups are defined according to ISIC Rev.4 classes. The gains and losses represent the sum of those aggregate sectors with positive changes and the sum of those aggregate sectors with negative changes, respectively. Using a finer activity breakdown (e.g. ISIC Rev.4 2-digit Divisions) would produce different estimates for total gains and losses, although the total net change would remain the same.
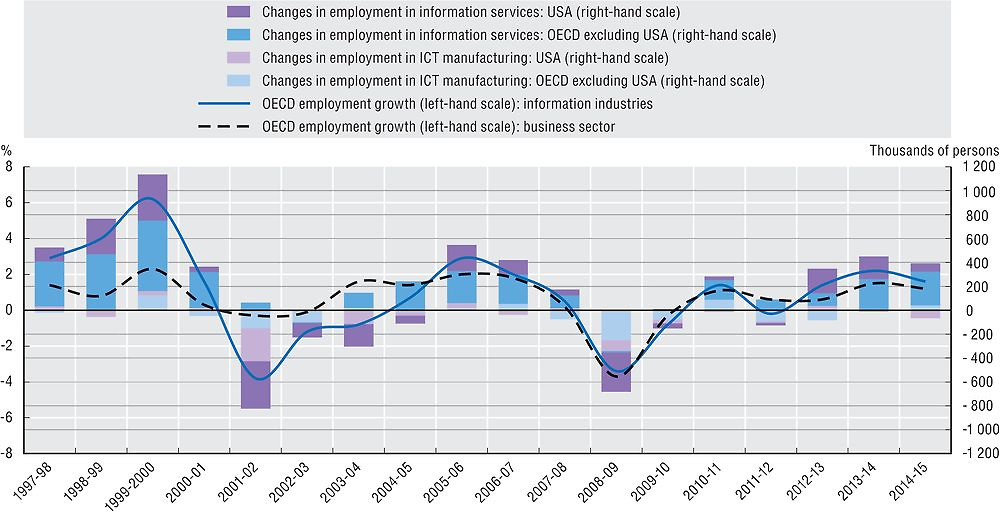
The information industries are considered an important source of growth in OECD countries despite accounting for only 5.5% of business sector employment in the OECD area. Between 1997 and 2015, OECD employment in the information industries grew by 18%, higher than growth in business sector employment over the same period (13%). However, employment in the information sector has been susceptible to relatively high volatility over the business cycle since 1997. After the financial crisis, for example, employment in the information industry fell 4.2% between 2008 and 2010 in the OECD area, shedding over 800 000 jobs. The United States now accounts for about 30% of OECD employment in the information industries (from a peak of about 35% prior to 2001), and remains an important driver of changes in OECD information sector employment. Information services dominate in terms of jobs gained, while the ICT manufacturing sector has experienced a reduction in workforce in many OECD countries, including the United States, over the past decade.
Source: OECD calculations based on Annual National Accounts Database, www.oecd.org/std/na, Structural Analysis (STAN) Database, http://oe.cd/stan and national sources, June 2017. StatLink contains more data. See chapter notes.
Definition of information industries
“Information industries” are defined according to ISIC Rev.4 and cover ICT manufacturing: “Computer, electronic and optical products” (Division 26) and, information services: ISIC Rev.4 Divisions 58 to 60 (“Publishing, audio-visual and broadcasting activities”), 61 (“Telecommunications”) and 62 to 63 (“IT and other information services”). This definition includes both the ICT sector and the Content and Media sector as defined in OECD (2011). The business sector corresponds to ISIC Rev. 4 Divisions 05 to 66 and 69 to 82 (i.e. Total economy excluding “Agriculture, forestry and fishing” (Divisions 01 to 03), “Real estate activities” (68), “Public administration” (84), “Education” (85), “Human health and social work activities” (86 to 88) and “Arts, entertainment, repair of household goods and other personal services” (90 to 99)).
Employment data are drawn mostly from National Accounts (SNA) sources and are measured in terms of persons, except for Canada, Japan and Mexico, which provide figures for jobs. Care should be taken when comparing changes in structural employment in these three countries with the other countries.
Your job depends on my demand for products
Growing economic and political integration worldwide has increased the reliance of employment in one country or region to changes in demand in other countries or regions. The OECD’s Inter-Country Input-Output (ICIO) database enables the decomposition of annual changes in OECD employment to account for changes in final demand for goods and services across different countries and regions. For example, the apparent overall increase of about 9.2 million business sector jobs in the OECD area, between 2009 and 2013, masked a fall of about 10 million jobs due to reduced demand in the European Union, which was more than offset by an increase of about 19.2 million to meet demand in non-EU economies. By 2014, EU demand had picked up sufficiently to exert a positive effect on OECD business sector jobs. In recent years, changes in OECD employment have been increasingly influenced by changes in demand in OECD partner economies.
Source: OECD calculations based on the Inter-Country Input-Output (ICIO) Database, the Structural Analysis (STAN) Database, the Annual National Accounts Database, Trade in Employment (TiM) and national sources, June 2017. See chapter notes.
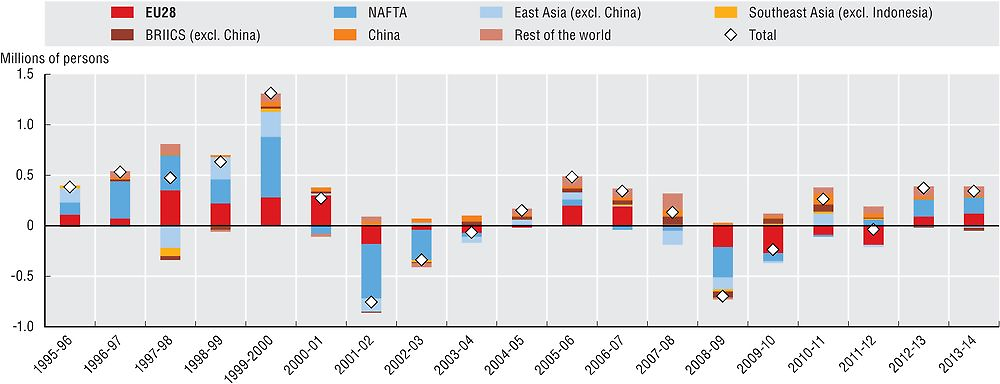
Source: OECD calculations based on the Inter-Country Input-Output (ICIO) Database, the Structural Analysis (STAN) Database, the Annual National Accounts Database, Trade in Employment (TiM) and national sources, June 2017. See chapter notes.
Greater integration in global value chains has implications for the demand for skills in countries. In 2014, in the United States, an estimated 38% of approximately 13 million business sector workers engaged in production to satisfy foreign final demand were high skilled. A similar share (36%) was apparent for the 54 million workers engaged in meeting foreign demand in the 22 EU countries of the OECD, although the bulk of foreign demand originated from other EU countries. Such shares varied across EU countries, ranging from about 25% in Greece and the Slovak Republic to over 40% in countries with large service sectors such as Luxembourg (56%), the United Kingdom (47%), Sweden (46%), Finland (43%) and France (43%). For other OECD countries, the share of high-skilled workers engaged in meeting foreign demand varied between 40% in Canada to about 21% in Australia and Korea. Variations reflect differences in the skills required in production for domestic consumption versus exports, differences in the skill profiles of workers in foreign versus domestic companies, and differences in the structural composition of domestic versus foreign final demand.
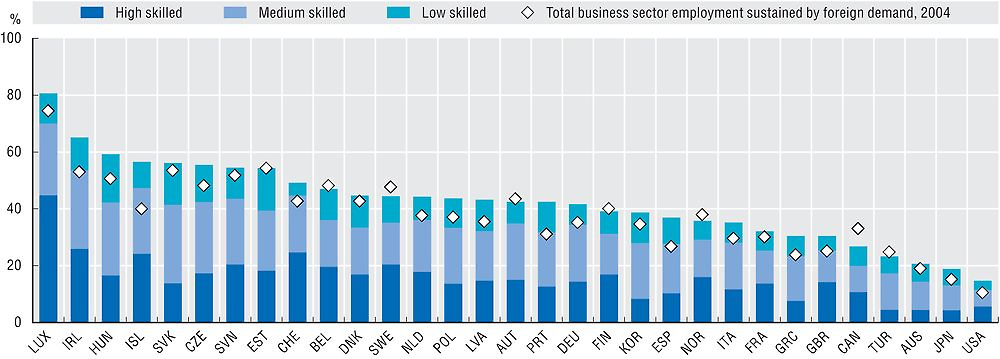
Note: Estimates for jobs sustained by foreign final demand are derived directly from OECD’s Inter-Country Input-Output (ICIO) table for 2004, while estimates for 2014 are preliminary projections or nowcasts. This experimental indicator decomposes total employment sustained by foreign final demand into three groups of skill intensity defined according to major groups of the International Standard Classification of Occupations 2008 (ISCO-08): high-skilled occupations (ISCO-08 major groups 1 to 3), medium-skilled (4 to 7) and low-skilled (8 and 9).
Source: OECD calculations based on OECD’s Inter-Country Input-Output (ICIO), Annual National Accounts, Structural Analysis (STAN) and Trade in Employment (TiM) databases, the World Input-Output Database, European Labour Force Surveys, national Labour Force surveys and other national sources, June 2017. See chapter notes.
Measuring jobs sustained by foreign final demand
The goods and services people buy are composed of inputs domestically produced or imported from various countries around the world. However, the flows of goods and services within these global production chains are not always apparent from conventional international trade statistics, or from national Input-Output or Supply and Use tables, which reveal flows of intermediate goods and services between industries (or product groups) within a country for production to meet domestic and foreign demand. Building on these data sources and other sources, the OECD’s Inter-Country Input-Output (ICIO) database provides estimates of flows of goods and services between 63 economies and 34 economic activities (based on ISIC Rev.3 and including 16 manufacturing and 14 service sectors) for 1995-2011. In this analysis, ICT industries are defined according to ISIC Rev.3 and consist of “Computer, electronic and optical products” (ISIC Rev.3 Divisions 30, 32 and 33), “Post and telecommunications services” (Division 64), and “Computer and related activities” (Division 72).
The most visible use of the ICIO is the development of Trade in Value Added (TiVA) indicators, which highlight the value-added origin (both domestic and foreign) of countries’ exports and final demand. Estimates of jobs embodied in (or sustained by) foreign final demand, can be calculated in a manner similar to estimates of domestic value added embodied in foreign final demand. However, experimental jobs-related indicators rely on some broad assumptions. In particular, they assume that within each industry labour productivity in exporting firms is the same as firms producing goods and services for domestic use only, and that all firms use the same share of imports for a given output, whether exporters or domestic producers only. However, evidence suggests that exporting firms have a higher level of labour productivity and use more imports in production. More effort is required to account for firm heterogeneity within the ICIO framework, in order to reduce the potential upward biases resulting from these current assumptions.
The changing nature of jobs
Innovation and new technologies – especially information and communication technologies (ICTs) – coupled with changes in the way firms organise production, both locally and globally, are changing the jobs and skills profile of the workforce. Economies where workers use ICT more intensively at work are also characterised by a higher share of “non-routine jobs”. These jobs entail the performance of relatively more complex tasks that cannot be easily codified or sequenced (e.g. programming or decision making). This is the case for both services and manufacturing jobs. While jobs in services industries appear relatively more “ICT task intensive”, the positive relationship between non-routine content and ICT task intensity is generally stronger in manufacturing. Firms’ organisational structure, technology adoption, participation in global value chains, and the extent to which routine manufacturing jobs might already have been automated, relocated and offshored are among the factors contributing to these patterns.

Source: OECD calculations based on the OECD Programme for International Assessment of Adult Competencies (PIAAC) Database, June 2017. See chapter notes.
The routine and ICT task content of jobs
Recently, OECD has developed task-based indicators to measure the “routine intensity” (Marcolin et al., 2016) and “ICT task intensity” of occupations (Grundke et al., 2017). Both sets of indicators are built using information from the OECD Programme for the International Assessment of Adult Competencies (PIAAC). The “routine intensity of jobs” captures the degree of independence workers have to plan and organise their activities and time, as well as their freedom to decide what to do on the job and in what sequence. The “ICT task intensity of jobs” reflects the extent to which workers perform tasks ranging from simple use of the Internet to the use of Word or Excel software or a programming language. Compared to earlier studies, these task-based approaches help to distinguish between the tasks that workers perform while at work and the skills with which they are endowed.
Training in firms
Workers performing non-routine tasks or ICT-intensive tasks are generally endowed with relatively higher skills. Firm-based training helps to motivate and reward employees, and align workers’ competences to firms’ needs. Training may also help to reduce inequality and provide low-skilled workers with the skills needed to navigate the digital transformation. Evidence nevertheless suggests that training has been used mostly to further upskill medium and high-skilled workers. On average, in the countries considered, between 30% (the Russian Federation and Greece) and 76% (the Netherlands, Denmark and Finland) of workers receive some training from their employers. With the exception of Turkey, only a quarter or less of workers receiving training are low skilled, whereas high-skilled workers account for between one-quarter (Austria) and three-quarters (the Russian Federation) of those receiving training.

Source: OECD calculations based on the OECD Programme for International Assessment of Adult Competencies (PIAAC) Database, June 2017. See chapter notes.
How to measure training?
Firm-based training endows workers with the skills needed to perform on the job and to transition between jobs – especially in an era of fast technological change. In the absence of internationally agreed methodologies on how to measure investment in firm-based training, the OECD (Squicciarini et al., 2015) has developed a new methodology to estimate different types of training. These include formal training which consists of organised training conducted outside the work environment resulting in the attainment of a degree at an education institution, and on-the-job training which can take place both inside and outside a firm but does not typically lead to the attainment of a formal degree. Training figures are based on the number of employees in the OECD Programme for International Assessment of Adult Competencies (PIAAC) that reported having received training at least once in the year, for both public and private sectors. Numbers are weighted to obtain country-wide representativeness. Frequencies may hide differences in the length of the training period across individuals and countries.
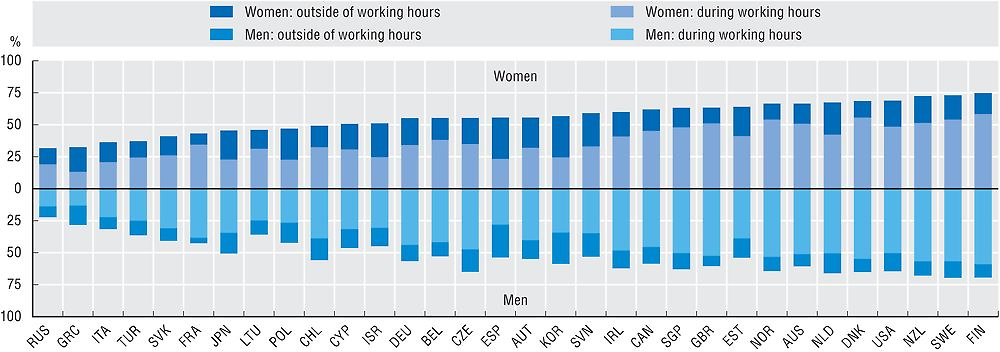
Women in the workplace
The speed, scale and scope of digital transformation are shaping all aspects of life including work. New and atypical work arrangements may lead to increased flexibility but at the cost of reduced job quality. The ways in which knowledge is generated and shared may help to overcome possible cultural or institutional barriers, but also create others. In a time of heightened uncertainty predictions are difficult to make; therefore, skills endowment and upgrading are key to navigating and benefitting from the digital transformation.
Women often earn significantly less than men, even after individual and job-related characteristics are taken into consideration. Skills partially explain the gender wage gap across countries. For example, men tend to have a relatively higher level of STEM-related skills which are positively rewarded by labour markets. The gender wage gap narrows if skills are taken into account, but differences remain and point to other sources of wage inequality, including firms’ organisational choices about project responsibilities, and employees’ tenure or even discrimination.
ICT skills play a significant role in explaining the gender wage gap. Estimates suggest that, other things being equal, returns on ICT tasks are larger for women than for men. Training women and endowing them with additional ICT skills may therefore contribute to increasing their wages and help to bridge the gender wage gap.

Source: OECD calculations based on the OECD Programme for International Assessment of Adult Competencies (PIAAC) Database, September 2017. See chapter notes.

Source: OECD calculations based on the OECD Programme for International Assessment of Adult Competencies (PIAAC) Database, September 2017. See chapter notes.
Training plays a key role in upskilling the workforce and thus augments an economy’s human capital base. According to OECD research, a larger share of women participate in on-the-job training, but the proportion that undertakes training during working hours is significantly lower than that of men. However, this may depend on factors such as differences in the propensity of men and women to engage in part-time work or upskilling, employers’ choices regarding whom to train and expected returns to firms from training.
Source: OECD calculations based on the OECD Programme for International Assessment of Adult Competencies (PIAAC) Database, September 2017. See chapter notes.
Investing in skills to close the gender wage gap
In the absence of internationally agreed measures for investment in training, the OECD proposes an experimental methodology to estimate investment in different types of training. Formal training refers to organised training undertaken outside the work environment that results in the attainment of a degree. On-the-job training may take place both inside and outside a firm but does not typically lead to a formal degree (Squicciarini et al., 2015). In order to assess which skills are relatively more rewarded in the labour markets, the OECD (Grundke et al., forthcoming) estimates returns on skills, analysing the extent to which work compensation in the form of salaries can be explained by the skill endowment of workers. Estimating returns on skills by gender can help identify the types of training more likely to reduce the associated wage gap. Estimates rely on indicators of cognitive skills such as literacy and numeracy, and skills that emerge from an analysis of tasks carried out by individuals on the job (for details see Grundke et al., 2017), as well as PIAAC data. The indicator of ICT tasks is based on job tasks that range from simple use of the Internet to the use of Word or Excel software or a programming language.
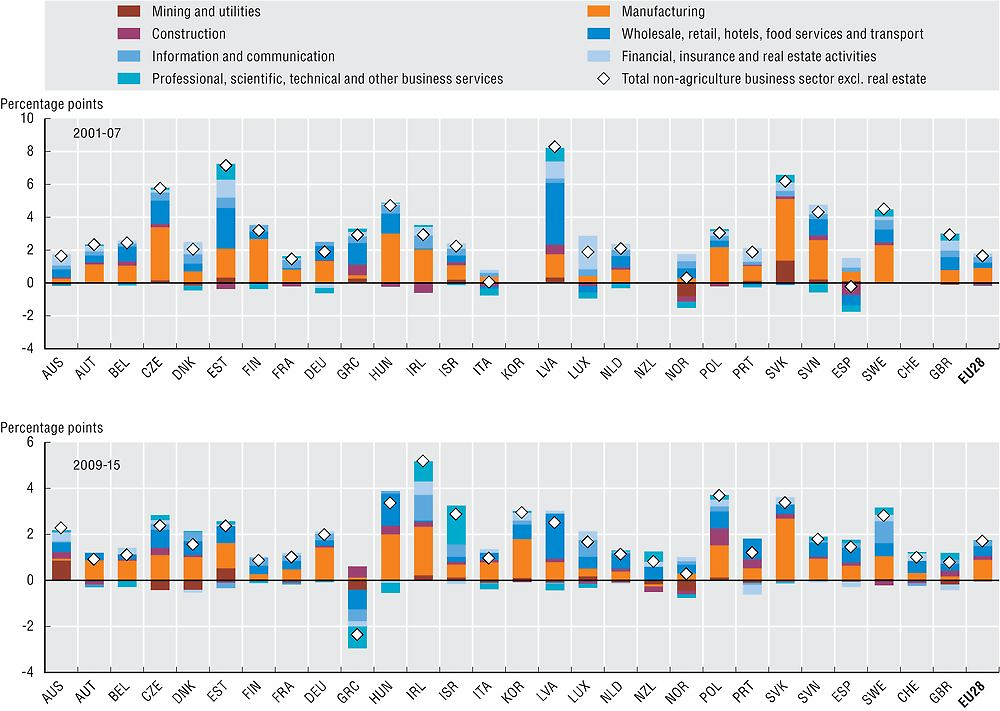
Sectoral productivity
Understanding the drivers of productivity growth at the total economy level requires an awareness of the contribution made by each industry. In the years up to the economic crisis (2001-07), productivity growth in most OECD countries was driven almost entirely by increased productivity in manufacturing and the increasing share of business services in overall activity. For most OECD countries for which data are available, labour productivity growth decreased following the onset of the financial crisis in 2008, with this decline spread broadly across sectors. The Czech Republic, Estonia, Finland, Greece, Latvia, the Slovak Republic, Slovenia and the United Kingdom experienced marked reductions (greater than 2%) in average productivity growth between 2009 and 2015 compared to the period 2001-07 with declines in manufacturing productivity growth particularly evident. However, some countries – such as Australia, Ireland, Israel, Italy, Poland and Spain – registered modest gains.
Source: OECD, Productivity Database, www.oecd.org/std/productivity-stats, September 2017. See chapter notes.
Measuring labour productivity by sector
Labour productivity growth is defined as the rate of growth in real value added per hour worked. Differences in labour productivity growth across sectors may relate, for instance, to the intensity with which sectors use capital (including knowledge-based capital) and skilled labour in their production, the scope for product and process innovation, the degree of product standardisation, the scope for economies of scale and their involvement in global value chains. The comparability of productivity growth across industries and countries may be affected by problems in measuring real value added. For example, most countries assume no change in labour productivity for public administration activities; this sector is not included here. Real estate services are also excluded, as the output of this sector reflects mainly the imputation made for the dwelling services provided and consumed by home owners. In addition, sectors such as construction and several services (for example, hotels and restaurants) are characterised by a high degree of part-time work and self-employment, which can affect the quality of estimates of actual hours worked. See OECD (2017a) for more discussion of productivity measurement issues.
For most OECD countries, the contribution of information industries to total labour productivity growth is relatively small. However, these sectors have significantly higher than average levels of labour productivity, reflecting their relative intensity in fixed (tangible) capital and knowledge-based capital. In 2015, across the OECD area, labour productivity in the information sector was, on average, 60% higher than other industries in the business sector. Ireland had the highest labour productivity level, driven in particular by high growth in the productivity of ICT services, and in part by the presence of several US multinational headquarters in the sector, with high value added but relatively few employees.
Labour productivity reflects changes in the use and efficiency of both fixed capital investment and knowledge-based capital (intangible assets). Estimates of multifactor productivity, by accounting for “measured” capital’s contribution to GDP (including software and R&D that are capitalised in national accounts) capture the impact of “non-measured” intangible assets such as organisational capital or investment in firm-specific training. In general, total economy multifactor productivity in the six-year period following the economic crisis was significantly lower than in the two six-year periods (1995-2001 and 2001-07) preceding the crisis. Of the countries presented, only Denmark and Japan experienced higher multifactor productivity during 2009-15 than in the earlier six-year periods.
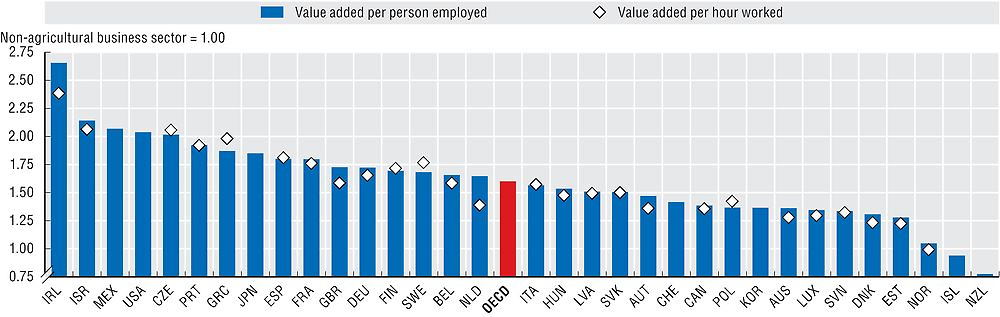
Note: While the preferred measure of labour productivity is value added per hour worked, limited availability of data on hours worked at a detailed level of industry means that value added per person employed is sometimes used as a substitute. Differences between the two measures reflect average hours worked per person. In this chart, higher relative value added per person employed reflects higher hours worked per person in the information industries. Information industries are defined according to ISIC Rev.4: “Computer, electronic and optical products” (Division 26), “Publishing, audio-visual and broadcasting” (58 to 60), “Telecommunications” (61) and “IT and other information services” (62, 63).
Source: OECD, Structural Analysis (STAN) Database, http://oe.cd/stan, and Annual National Accounts (SNA) Database, www.oecd.org/std/na, September 2017. See chapter notes.

Source: OECD calculations based on OECD Productivity Database, www.oecd.org/std/productivity-stats, September 2017. StatLink contains more data. See chapter notes.
The extended ICT footprint
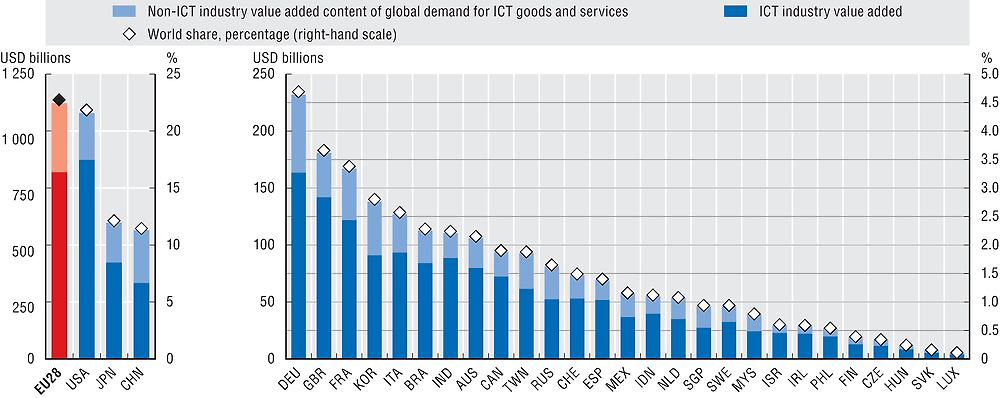
Measuring the value added generated by information and communication technology (ICT) industries only provides a partial view of the importance of ICT to a country’s economy. In addition to final ICT products, the output from domestic ICT industries is also embodied (via intermediate products) in a wide range of goods and services meeting final demand (business capital investment, household and government consumption), both domestically and abroad. Similarly, the output from domestic non-ICT industries is present in many ICT goods and services consumed worldwide through domestic interconnections and participation in global value chains (GVCs). Global demand for ICT goods and services through international trade and investment can drive the activities of many upstream domestic non-ICT industries. Combining the value added generated by domestic ICT industries with the domestic non-ICT industry value added embodied in global demand for ICT goods and services could be a first step towards defining an extended ICT footprint, or “ICT-EF”.
In 2011, the United States, Japan and China together accounted for about 45% of the world’s extended ICT footprint. The European Union as a whole accounted for 23%, a share only marginally higher than that of the United States. Neglecting the value added generated in other sectors of the economy to meet global demand for ICT final goods and services can result in under-estimation of the role played by the “digital” economy. In OECD countries, 19% to 34% of the extended ICT footprint is accounted for by value added generated elsewhere, rising to 41% for China.
Source: OECD, Inter-Country Input-Output (ICIO) Database, http://oe.cd/icio, and Trade in Value Added (TiVA) database, http://oe.cd/tiva, July 2017. StatLink contains more data. See chapter notes.
ICT and the origin of value added
In this analysis, information and communication technology (ICT) industries are defined according to ISIC Rev.3 and consist of “Computer, electronic and optical products” (Divisions 30, 32 and 33), “Post and telecommunications services” (Division 64), and “Computer and related activities” (Division 72). Due to data availability this definition represents an approximation of the more detailed ISIC Rev.3 definition given in OECD (2011).
While ICT industry value added is generally available from official National Accounts (SNA) statistics, tracking the country and industry origins of value added embodied in final ICT goods and services requires the use of TiVA indicators, such as the “Origin of value added in final demand”, based on the OECD’s ICIO database. This provides estimates of inter-country, inter-industry flows of intermediate and final goods and services that allow for the development of a range of indicators to provide insights into countries’ participation in the global economy. Such indicators are not otherwise apparent from conventional official statistics such as reported “gross” trade in goods and services and national Input-Output or Supply and Use tables.
The importance of the extended ICT footprint can be further illustrated by considering ICT-related domestic value added as a share of total economy value added (or GDP). East and Southeast Asian economies accounted for some of the highest shares in 2011. The ICT-EF measure reveals that ICT value added represented 20% of GDP in Chinese Taipei and 18% in Singapore, economies that are particularly reliant on the manufacture of ICT goods. Among OECD countries, Ireland, Israel, Japan, Korea and Switzerland all had shares over 10%, although, with the exception of Korea, the main contribution came from ICT service activities, as was the case for most other OECD countries. To determine how domestic demand generates ICT-related value added abroad, another dimension of ICT-EF can be considered. In particular, the combination of foreign ICT industry value added in final domestic demand for all goods and services, and the foreign non-ICT value added content of domestic demand for ICT goods and services, both of which are present due to importing activities. In the OECD area, on average, ICT-related foreign value added accounted for 2.4% of GDP in 2011.

Source: OECD, Inter-Country Input-Output (ICIO) Database, http://oe.cd/icio, and Trade in Value Added (TiVA) database, http://oe.cd/tiva, July 2017. StatLink contains more data. See chapter notes.

Source: OECD, Inter-Country Input-Output (ICIO) Database, http://oe.cd/icio, and Trade in Value Added (TiVA) database, http://oe.cd/tiva, July 2017. StatLink contains more data. See chapter notes.
Measuring ICT footprints further
Due to ongoing development of the OECD’s ICIO, the concept of extended ICT footprints can be further examined and improvements made to measurement. Notably, the use of an ISIC Rev.4-based industry list and, hence, a “refined” definition of ICT industries and ICIO tables for the years after 2011 to provide more timely indicators. Estimates of capital flow matrices, currently absent from the ICIO infrastructure, could also allow for the inclusion of non-ICT content of capital investment by ICT industries, such as the machinery and equipment used for manufacturing ICT parts and components. This would increase the size of ICT-EF. The ICT content of capital goods is already implicit in the analysis presented here.
Knowledge-based capital
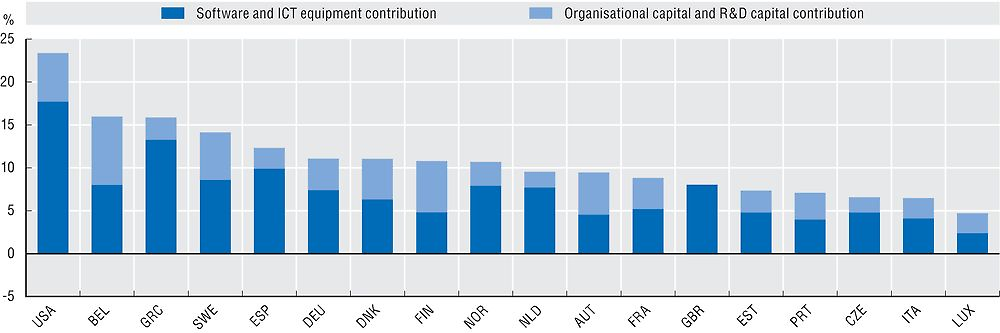
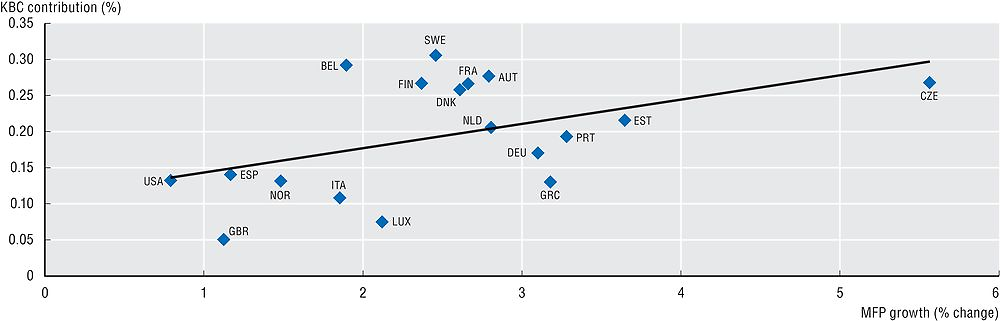
Producing new and better products entails investing not only in research and development (R&D), but also in complementary assets such as software, design, human capital and firms’ organisational capabilities (OC) – in short, knowledge-based capital (KBC). New OECD estimates for 2000-14 (Haines et al., forthcoming) reveal that selected KBC and tangible capital accounted on average for 6% and 14%, respectively, of labour productivity growth. The contribution of software and ICT equipment combined ranged between 2% (Luxembourg) and 18% (the United States) of labour productivity growth, whereas OC and R&D reached up to 8% (Belgium). The considered KBC assets also appear to have contributed indirectly to labour productivity growth; due to the positive relationship between KBC and multifactor productivity (MFP) (i.e. economies experiencing relatively higher MFP growth also exhibit higher KBC contribution). Factors that may explain these observed patterns include the industrial structure of economies and the extent to which investment in KBC generates knowledge spillovers and returns to scale.
Source: OECD calculations based on ANBERD Database, Annual National Accounts Database, the OECD Programme for International Assessment of Adult Competencies (PIAAC), EUKLEMS, INTAN-Invest and the U.S. Bureau of Economic Analysis (BEA) Satellite Accounts, June 2017. See chapter notes.
Source: OECD calculations based on data from OECD ANBERD, the OECD System of National Accounts (SNA), the OECD Programme for International Assessment of Adult Competencies (PIAAC), EUKLEMS, INTAN-Invest, www.intan-invest.net, U.S. BEA Satellite Accounts and the PIAAC Skills Survey. See chapter notes.
Growth accounting estimates usually focus on the market sector only, given that measuring productivity in the non-market sector can prove controversial. However, initial measurement of KBC in the non-market sector, produced in the context of the SPINTAN network, shows that investment in market and non-market sectors goes hand in hand across the countries considered. Hence, the contribution of KBC to economic growth might be even higher than suggested by market sector-based analysis if investment in KBC by the public sector were to be taken into account.

Source: OECD calculations based on Annual National Accounts Database, www.oecd.org/std/ana, INTAN-Invest data, www.intan-invest.net, and SPINTAN data, www.spintan.net, May 2017. See chapter notes.
What is meant by “KBC-augmented” and “growth accounting”?
Knowledge-based capital (KBC) or “intangible assets”, as they are often called, refer to assets that lack a physical nature. The value of KBC stems from its knowledge content and its capacity to add value to other assets. Corrado et al. (2009) list assets such as software and databases, scientific and non-scientific R&D, copyrights, designs, brand equity and marketing research, firm-specific training and organisational know-how among KBC. The international statistical community has recently recognised software, R&D, entertainment, literary and artistic originals, and mineral explorations as capital assets, and includes them within the System of National Accounts (SNA), 2008 Revision. Recent methodological advances have further proposed ways to measure other KBC assets, including design, brands, firm-specific training and organisational capital. While a consensus has yet to be reached on aspects such as prices and depreciation rates for these assets, the methodologies in question derive capital estimates from information reported as intermediate expenditures in National Accounts. Capitalising these assets therefore imposes an adjustment to the value added and labour productivity measures used in the growth accounting analysis (here called “KBC-augmented”). Such an adjustment is implemented with respect to the organisational capital investment in particular, which is estimated based on Le Mouel et al. (2016). Estimates about KBC investment in the non-market sector are sourced from the SPINTAN network.
According to classical economic theory, growth can be achieved by increasing the amount of inputs or by improving the efficiency with which these inputs are used in production. Under a number of assumptions such as perfectly competitive markets and constant returns to scale in production, the growth accounting methodology separates the contributions of inputs accumulation and MFP to GDP or to labour productivity growth. Further details about the methodology and the solutions provided to the data constraints encountered can be found in Haines et al. (forthcoming).
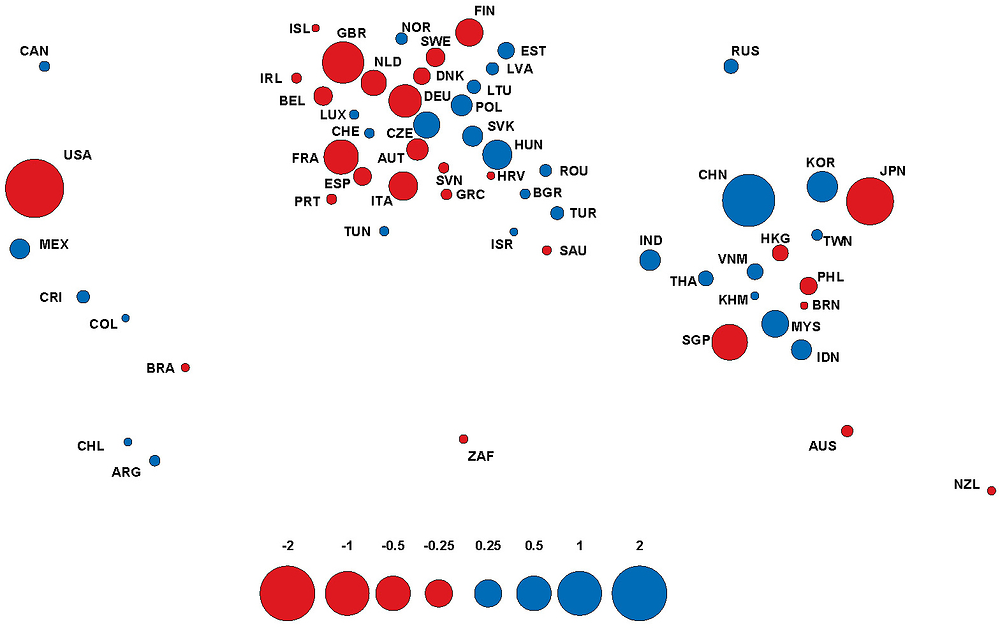
ICT global production networks
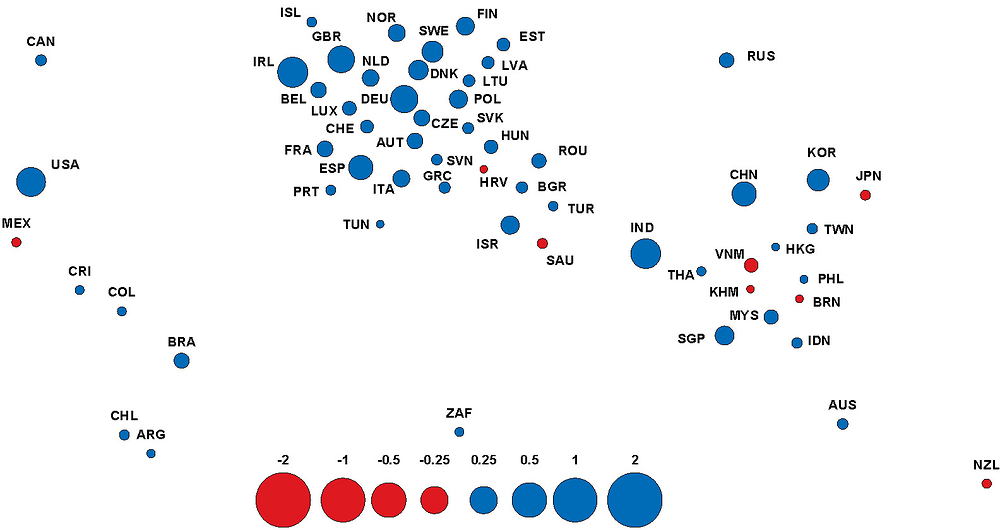
Global production networks are complex webs consisting of flows of knowledge, goods and service inputs, combined at various stages of production. Firms and industries positioned at the centre of global value chains (GVCs) have access to a greater variety of foreign inputs, compared to those at the periphery. Hence, productivity gains are likely to be generated from positioning as well as participation in GVCs. Profound changes in the core/periphery structure of GVCs have taken place over recent decades, particularly in ICT sectors. In 1995, computing and electronics manufacturing value chains were organised around a handful of central hubs in high-income economies, notably Japan and the United States. However, the period 1995-2011 saw an almost universal and substantial decline in importance among these traditional centres of manufacturing (represented by the red circles in the Figure). Conversely, many Asian and Central and Eastern European countries witnessed large increases in centrality, especially in China, as well as the Czech Republic, Hungary, Korea and Malaysia (represented by the blue circles in the Figure). By 2011, global production of ICT electronics no longer centred around a few high-income economies and was shifting towards a more even distribution.
Source: OECD, Inter-Country Input-Output (ICIO) Database, http://oe.cd/icio, July 2017. StatLink contains more data. See chapter notes.
How to read these figures
Economies are placed according to their geographical location. The size of the nodes reflects the magnitude of the change (in levels) of total foreign centrality over the period 1995-2011. As reflected in the key, these changes are graphed using a log scale for readability. Blue coloured nodes reflect increasing centrality and red denotes falling centrality.
Changes in the structure of global production networks are linked to a dramatic rise in the role of IT services. From a low starting point in 1995, the reliance of global production networks on IT services increased for almost every economy over the period 1995-2011 (represented by the blue circles in Figure 54). The increasing influence of IT services was particularly noticeable in countries that experienced the largest declines in computing and electronics manufacturing centrality, namely Germany, the United Kingdom and the United States. However, these changes to IT services were somewhat smaller in magnitude than the overall extent of the relocation of computing and electronics manufacturing. The rising importance of IT services does not only follow the restructuring of high-income economies, but extends to include a broad range of economies, such as Ireland, Korea and Spain, as well as many emerging economies, especially China, India and Singapore.
Source: OECD, Inter-Country Input-Output (ICIO) Database, http://oe.cd/icio, July 2017. StatLink contains more data. See chapter notes.
What does “centrality” mean and how is calculated?
Centrality is a measure of influence or connectivity within the global production network. Central sectors reflect those that are highly connected (both directly and indirectly) and influential within global production networks. Conversely, peripheral sectors exhibit weak linkages to other sectors and countries and so are less influential. This measure is calculated as a PageRank version of Bonacich-Katz eigenvector centralities using the network of input flows between countries and industries detailed in the OECD Inter-Country Input-Output (ICIO) Database, 2015 edition. Centrality is calculated for each country-industry as a baseline centrality, plus a weighted sum of centralities of their trade partners, where the weights are input shares. Thus, countries and industries are considered central if highly connected to other countries and industries both directly and indirectly as a result of trading with highly central trade partners. Total centrality is the average of centrality calculated using forwards linkages (exports of inputs) and backwards linkages (imports of inputs). Centrality is decomposed into foreign and domestic origins. Foreign centrality represents centrality due to (direct and indirect) linkages to foreign sectors, while domestic centrality relates to (direct and indirect) linkages to domestic sectors. IT manufacturing is defined as ISIC Rev.3 sectors 30, 32 and 33: “Computer, electrical and optical products”. IT services consist of ISIC Rev.3 sector 72: “Computer and related activities”. See Criscuolo and Timmis (forthcoming).
ICT hubs
Centrality is a measure reflecting influence relative to all other country-industries in the network. It can be observed within both international and domestic production networks. The relative positioning (centrality) of an industry within a global or domestic production network is likely to differ. The substantial reorganisation of IT manufacturing global production networks has often accompanied broadly similar changes domestically. Many of the high-income economies that have witnessed large declines in their influence in global IT manufacturing production networks (e.g. Japan, the United Kingdom and the United States) have also almost universally experienced a decline in the influence of this industry within their domestic production networks. However, the changes observed in domestic centrality are generally of a lesser magnitude than those linked to foreign centrality. In contrast, several Eastern European and Asian economies have experienced an increase in their centrality for IT manufacturing both in terms of global and domestic production networks (Panel A). However, the relationship here is somewhat weaker, with Indonesia, for example, experiencing much faster increases in domestic centrality than foreign centrality, while Korea has experienced the reverse.
Similarly, changes observed for IT services in terms of centrality within global production networks are often mirrored in domestic production networks. IT services industries in Ireland, India, the United States and several other economies have become increasingly central to global production, as reflected in their increased foreign centrality (Panel B). For many of these same economies, IT services have also become more influential in domestic production networks, and in some cases increasing domestic influence exceeds globally observed changes, for example, in the Czech Republic, Denmark and India.

Source: OECD, Inter-Country Input-Output (ICIO) Database, http://oe.cd/icio, July 2017. StatLink contains more data. See chapter notes.
How to read these figures
The bars represent the change (in levels) of total foreign and domestic centrality over the period 1995-2011. The Panel A represents changes in IT manufacturing (“Computer, electronic and optical products”) and the Panel B represents IT services (“Computer and related activities”).
Over the period 1995-2011, IT manufacturing shifted away from a few high-income hubs, with Asian economies gaining influence as central hubs. In 1995, global production centred largely around Japan and the United States (Figure 56, upper panel). The influence of these central hubs declined by 2011 with a shift eastwards in global production. Out of the top ten most central hubs in 1995, only Chinese Taipei and Korea were more influential in 2011. Extensive reorganisation of production saw emerging economies that were relatively peripheral in 1995 become key hubs by 2011. For example, China (20th in 1995) replaced the United States as the most “central” country-industry in 2011.
In contrast, IT services have almost universally gained “centrality”. In 1995, IT services were not particularly influential for global production (Figure 56, lower panel). Even central countries such as Germany and the United States had a low “centrality” compared to IT manufacturing. Over the period 1995-2011, IT services became relatively more influential globally. This is also true of many economies that were most central at the start of the period. For example, the United States, Germany and the United Kingdom remained in the top four most central economies for IT services throughout 1995-2011. The same period also witnessed the emergence of several new central hubs, such as India and Ireland.

Source: OECD, Inter-Country Input-Output (ICIO) Database, http://oe.cd/icio, July 2017. See chapter notes.
How to read these figures
The bars represent total foreign centrality for those 10 economies with the highest level of total foreign centrality in 1995 (the left-hand figures) and 2011 (the right-hand figures). The upper panel represents IT manufacturing (“Computer, electronic and optical products”) and the lower panel represents IT services (“Computer and related activities”).