Labour market entry
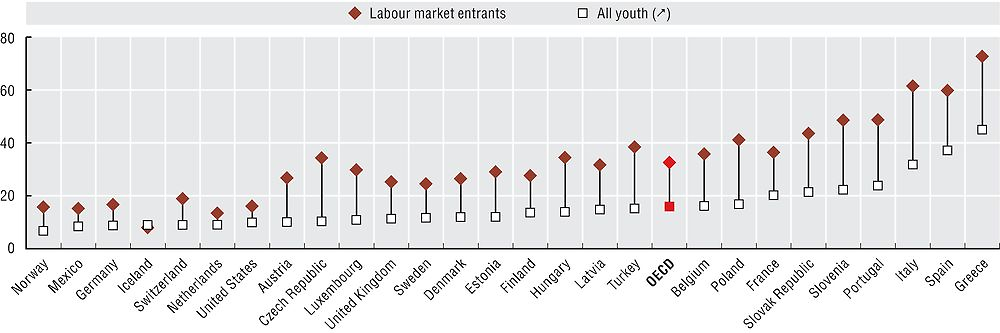
Finding a stable job after leaving school or university can be a lengthy process involving bumps and false starts. Labour market entrants face a much greater risk of unemployment than young people who have been out of education for a while (Figure 4.13). Their unemployment rate is more than twice as high as that of all youth out of education (33 vs. 16% across OECD countries). Young people who recently left education have particular difficulties finding work in countries where youth unemployment remains high in the aftermath of the crisis – in Italy and Greece, over 60% of labour market entrants are looking for work.
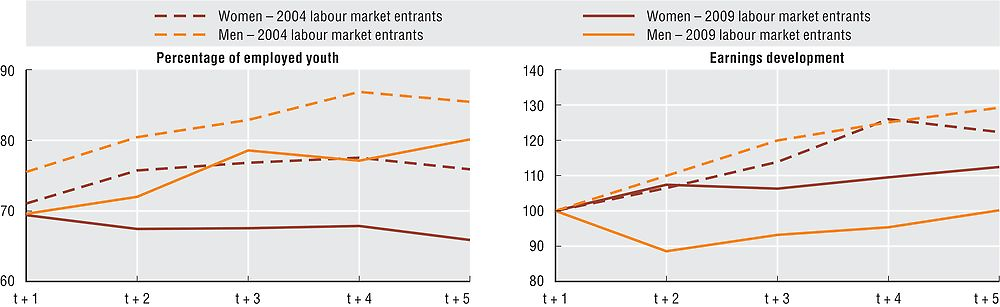
Starting a career is especially hard during recessions, when fewer jobs are available and competition is intense. Young people who transitioned from education to the labour market in 2009 had substantially lower employment rates over the next four years than a comparable cohort who entered the labour market before the crisis in 2004 (left-hand panel of Figure 4.14). Even four years into their careers – in 2008 and 2013, respectively – the crisis cohort had substantially lower employment rates than their pre-crisis peers – the difference was 5 percentage points for young men and 10 percentage points for young women.
Experience from previous recessions shows, moreover, that even those who manage to secure employment have fewer opportunities for promotion and training and therefore tend to suffer from persistently depressed earnings (e.g. Oreopoulous et al., 2012). Also the 2009 cohort of labour market entrants suffered from a much more meagre earnings growth than their pre-crisis peers (right-hand panel of Figure 4.14): for women, earnings rose by a modest 3% per year over the first four years. For men, earnings plummeted by 11% in the year after labour market entry, and only barely recovered over the following three years. The pre-crisis cohort, by contrast, enjoyed solid earnings growth of around 6-7% per year for both women and men during the initial years after labour market entry.
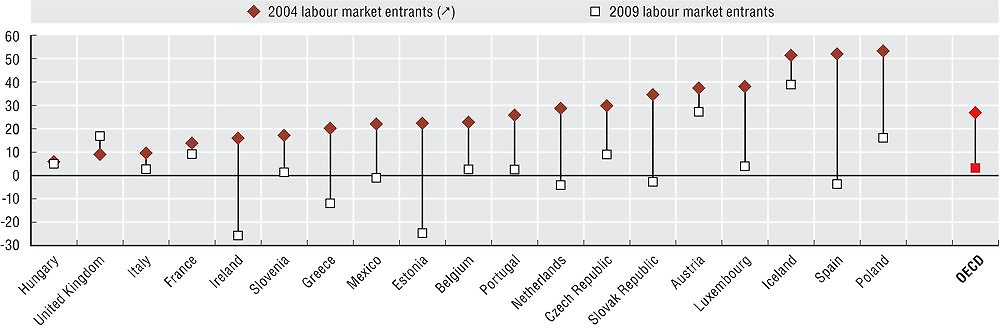
Earnings have grown more slowly for the 2009 cohort of labour market entrants in nearly all countries studied (Figure 4.15). In the Netherlands, for example, a country with one of the highest youth employment rates (see Chapter 1), youth who left education in 2008 saw their real earnings shrink by 2% over five years, compared to a 29% earnings increase for those who graduated in 2003. The drop in earnings growth is particularly large again, however, in the countries hit hardest by the crisis: Spain (-56 percentage points), Estonia (-47 percentage points) and Ireland (-42 percentage points).
In Figures 4.13 to 4.15, labour market entrants are defined as 15-to-29-year-olds who are not enrolled in formal education in the reference year but who were in education the year before. Figure 4.13 gives the share of unemployed out of all active young people for labour market entrants and for all youth not in education.
Figures 4.14 and 4.15 show the shares of young people in (part-time or full-time) employment and the development of real monthly earnings for the 2004 (pre-crisis) cohort and the 2009 (crisis) cohort of labour market entrants for the first four years after labour market entry. Real earnings are expressed in relation to the earnings in the initial year after labour market entry (2004 or 2009, respectively). No earnings data are available for Estonia in 2008, Hungary in 2005 and 2006, Iceland in 2012, Mexico in 2008 and Spain in 2013. Therefore, the earnings development was interpolated for Hungary between 2004 and 2007 and for Iceland between 2011 and 2013, and extrapolated for Estonia and Mexico in 2008 and Spain in 2013 (end of the cohort tracking periods).
Further reading
Carcillo, S. et al. (2015), “NEET Youth in the Aftermath of the Crisis – Challenges and Policies”, OECD Social, Employment and Migration Working Papers, No. 164, OECD Publishing, Paris, https://doi.org/10.1787/5js6363503f6-en.
Oreopoulos, P., T. von Wachter and A. Heisz (2012), “The Short- and Long-Term Career Effects of Graduating in a Recession”, American Economic Journal: Applied Economics, Vol. 4, No. 1, pp. 1-29, https://doi.org/10.1257/app.4.1.1.
Quintini, G. and S. Martin (2014), “Same Same but Different: School-to-work Transitions in Emerging and Advanced Economies”, OECD Social, Employment and Migration Working Papers, No. 154, OECD Publishing, Paris, https://doi.org/10.1787/5jzbb2t1rcwc-en.
Figure notes
Figure 4.13: 2013 for Germany and Turkey. Data are missing for Australia, Canada, Chile, Israel, Japan, Korea and New Zealand.
Figures 4.14 and 4.15: OECD averages shown are for all countries with available data: Austria, Belgium, the Czech Republic, Estonia, France, Greece, Hungary, Iceland, Ireland, Italy, Luxembourg, Mexico, the Netherlands, Poland, Portugal, the Slovak Republic, Slovenia Spain and the United Kingdom.
Source: Calculations from EU-LFS and national labour force surveys for the Mexico, the United States and Turkey.
Source: Calculations from EU-SILC and the Mexican National Occupation and Employment Survey (ENOE).
Source: Calculations from EU-SILC and the Mexican National Occupation and Employment Survey (ENOE).