Chapter 4. Country tables, 1990-2016

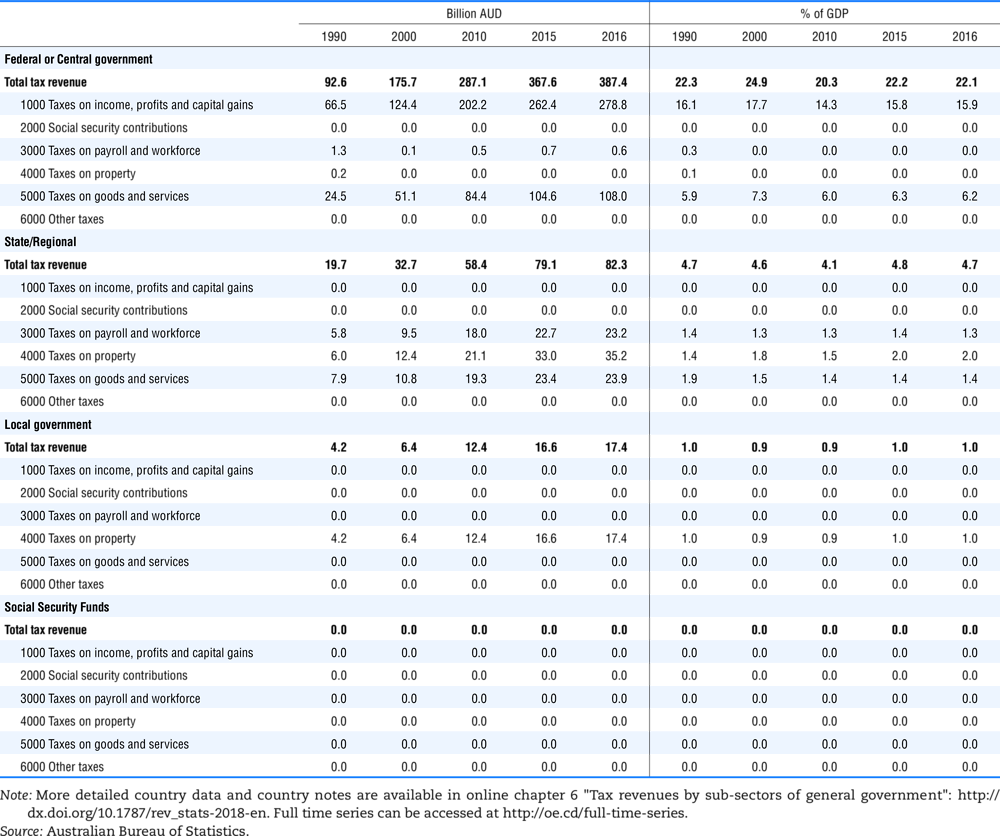
Chapter 4 provides a summary of tax revenues by category and by level of government for each OECD country from 1990-2016.


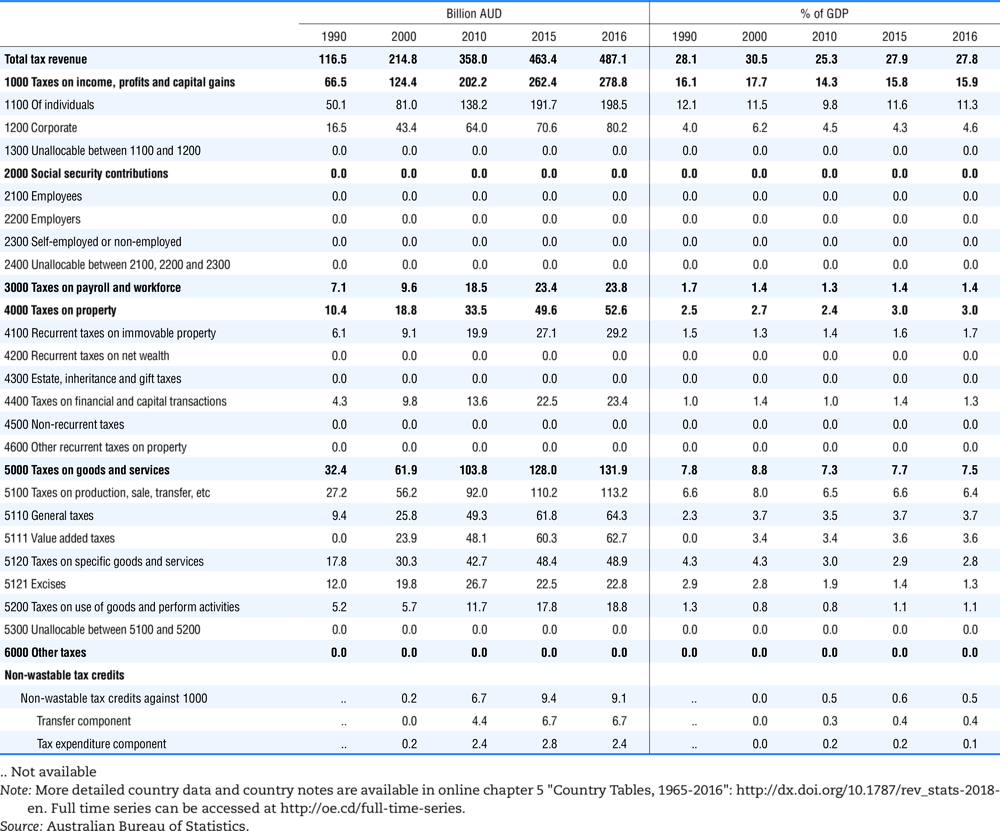
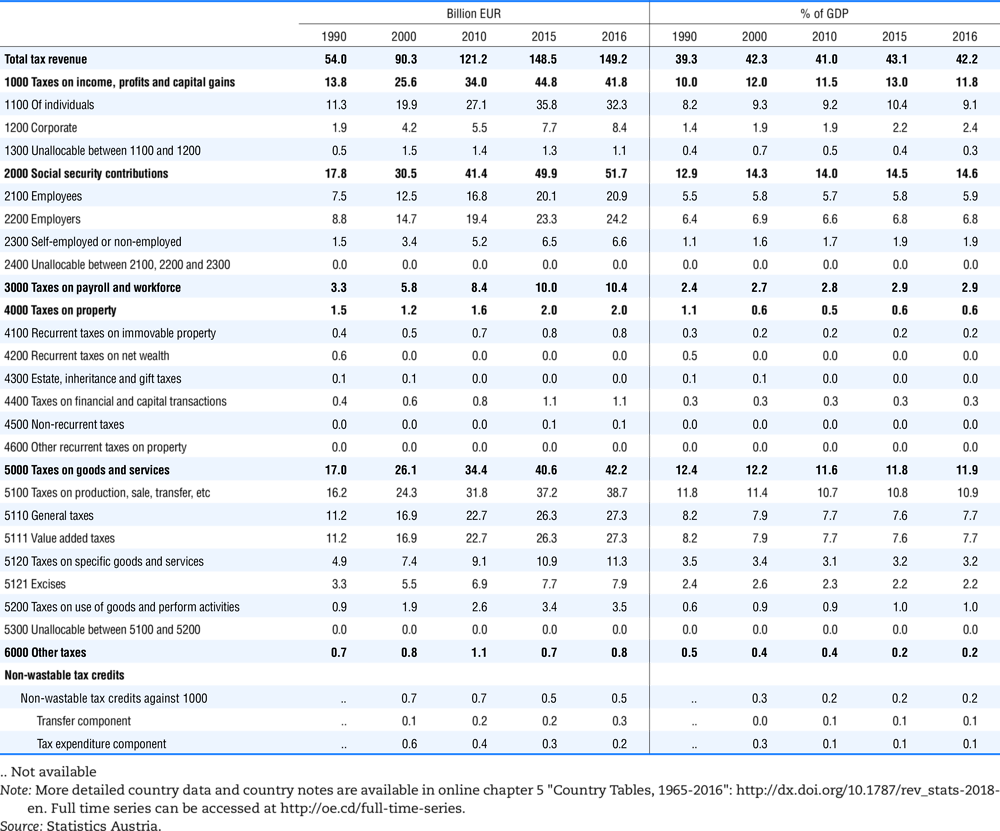
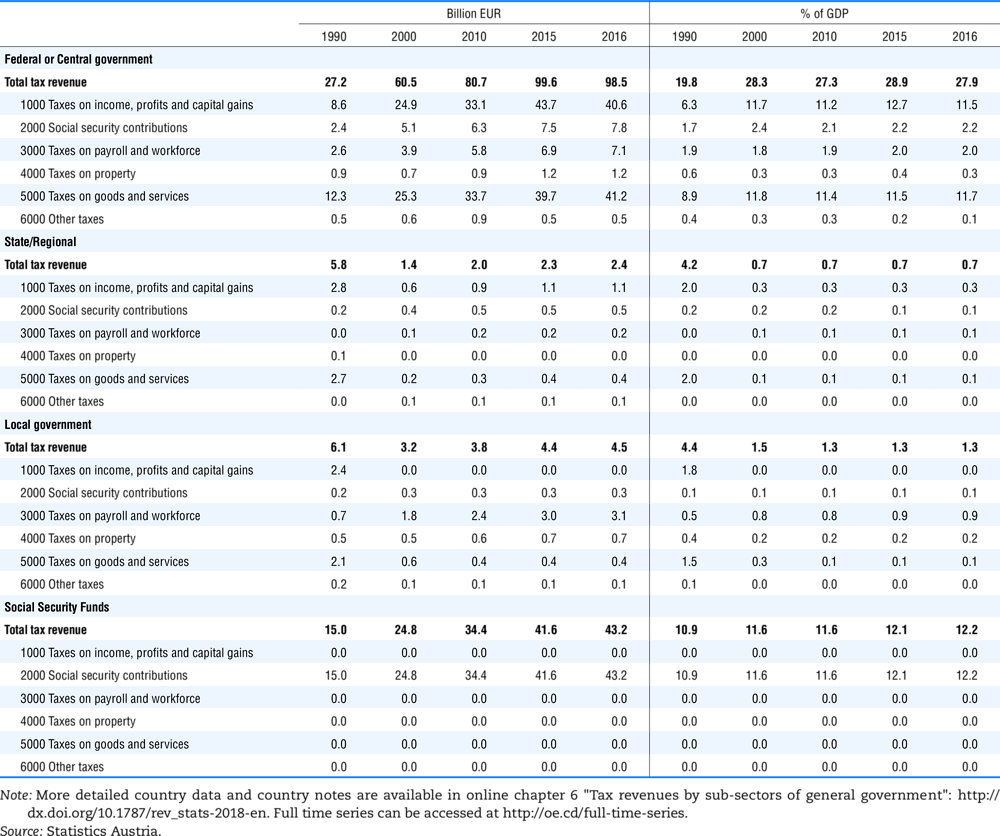
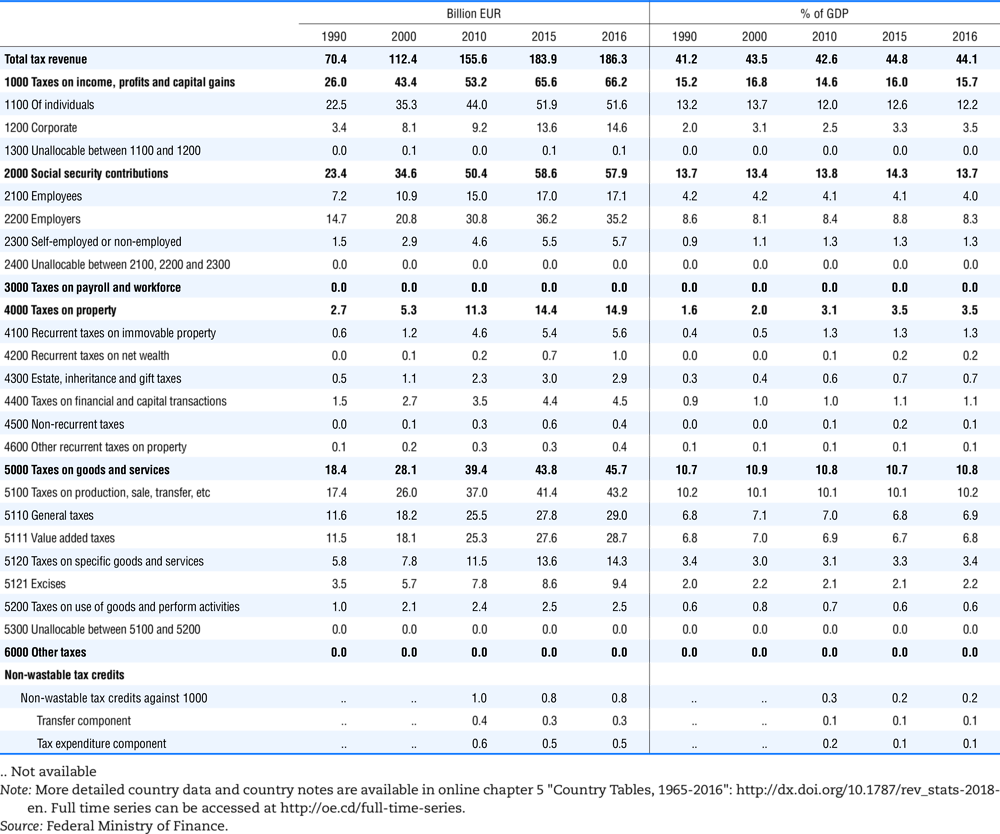
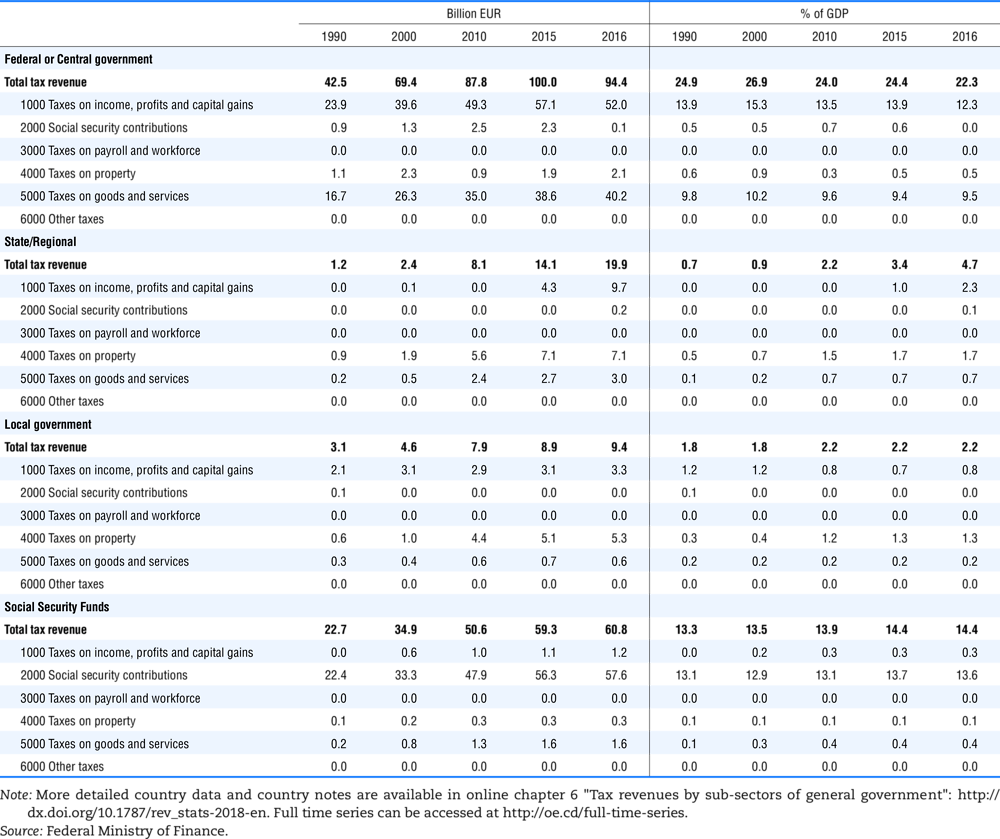
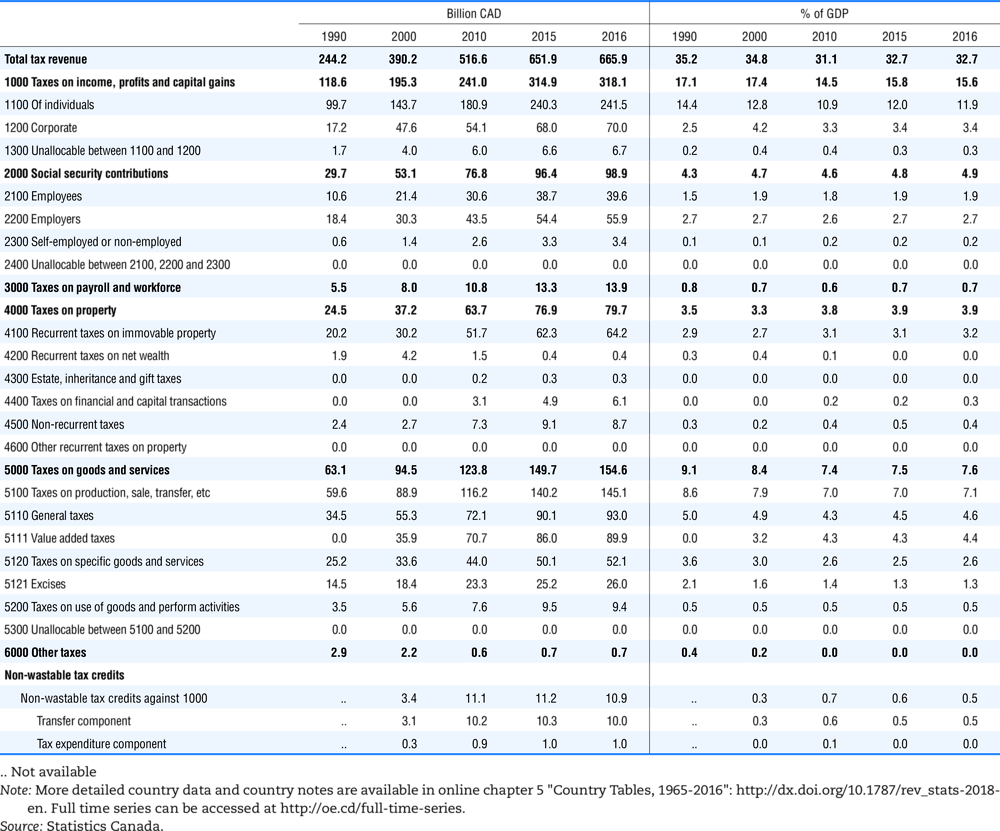
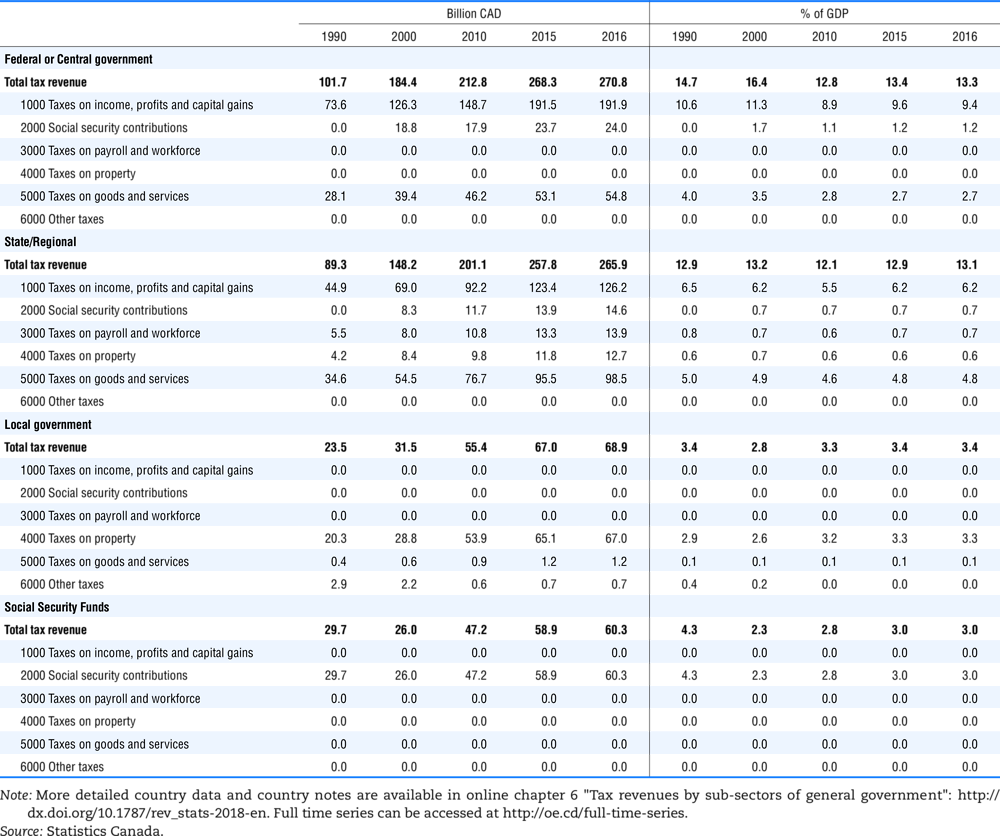
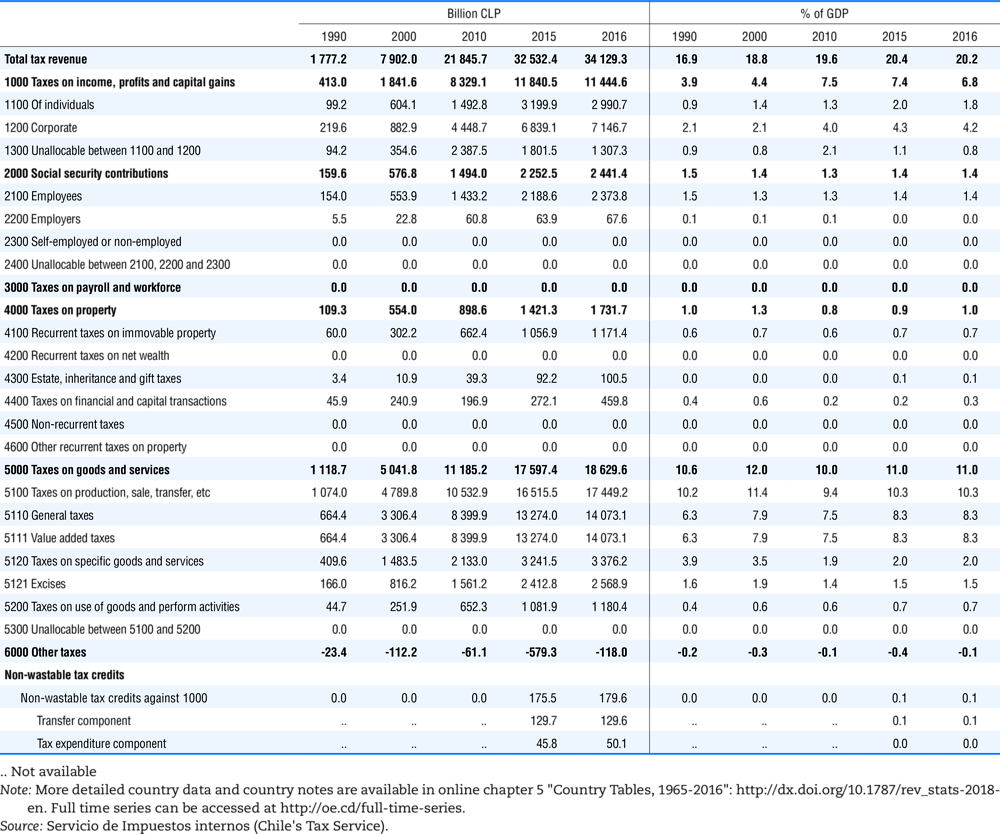
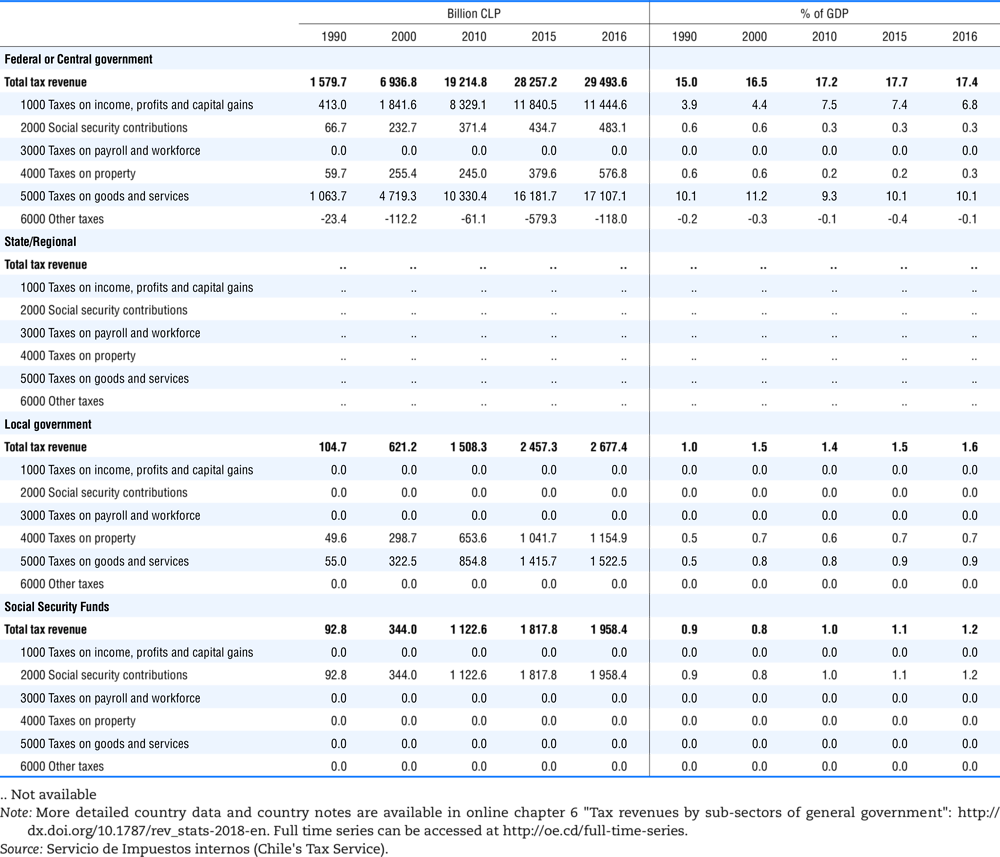
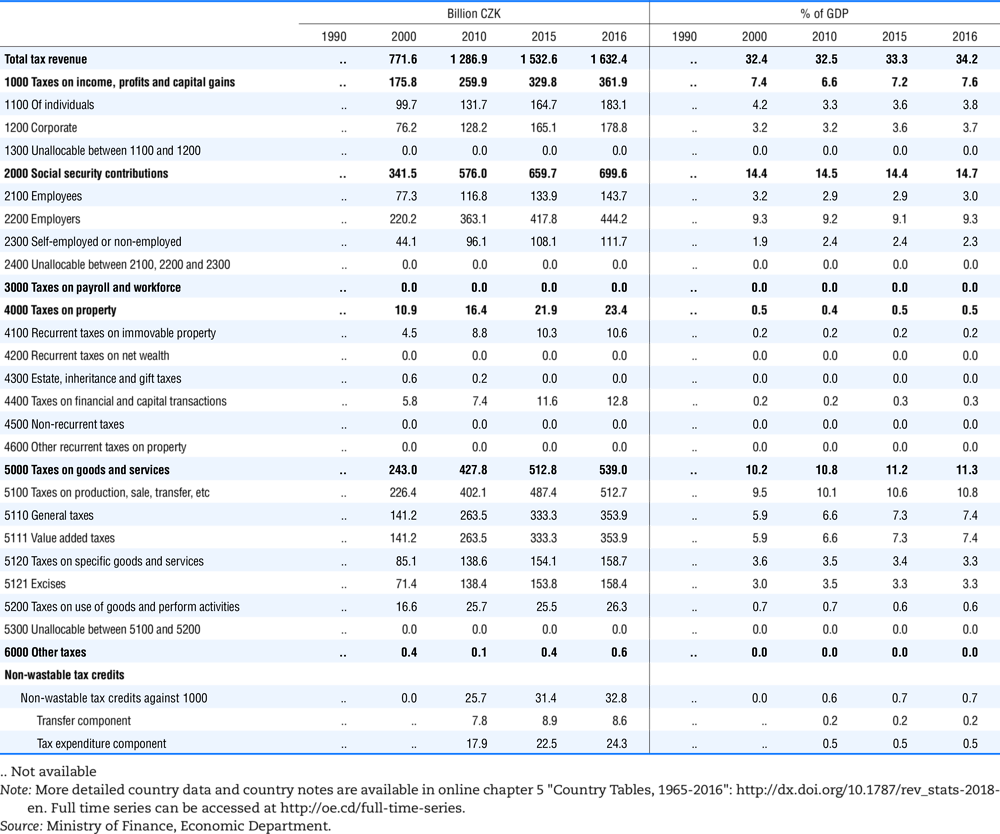
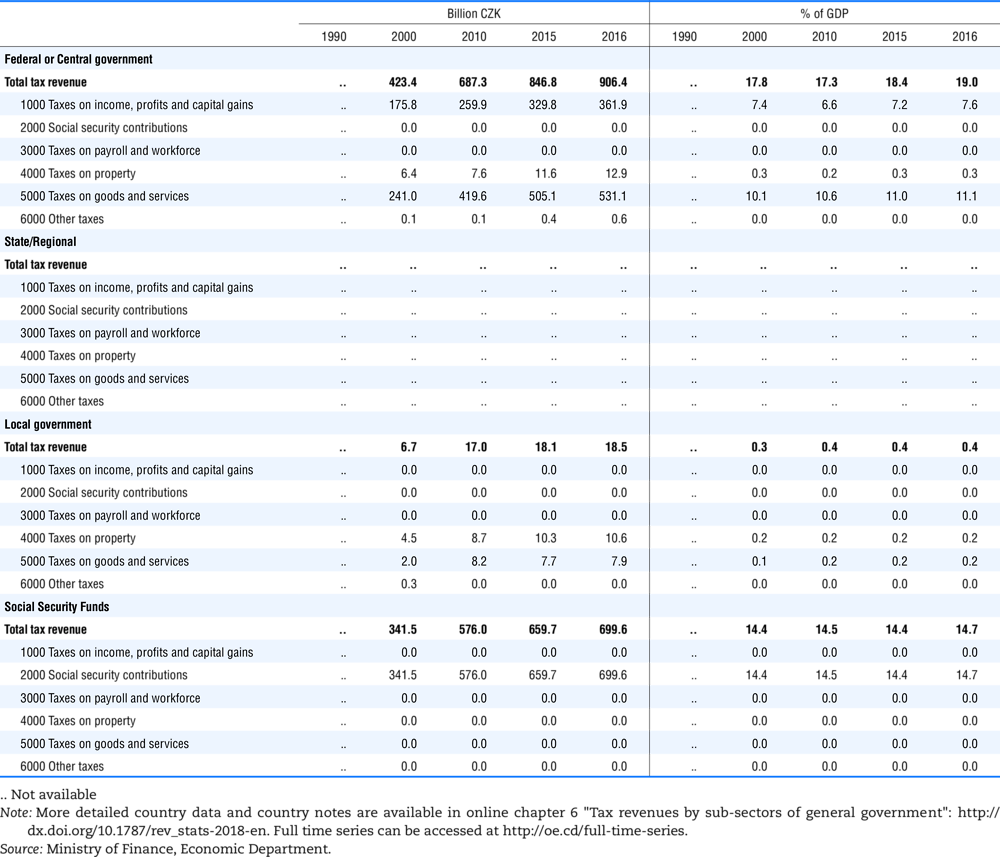
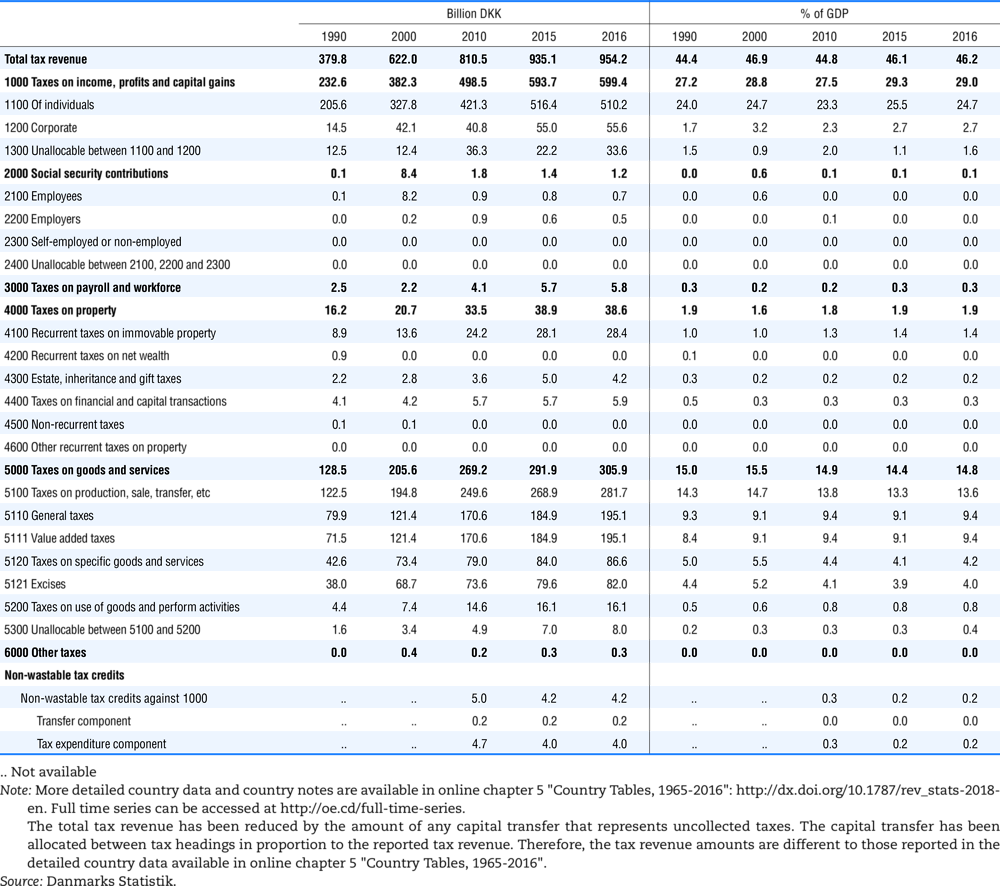
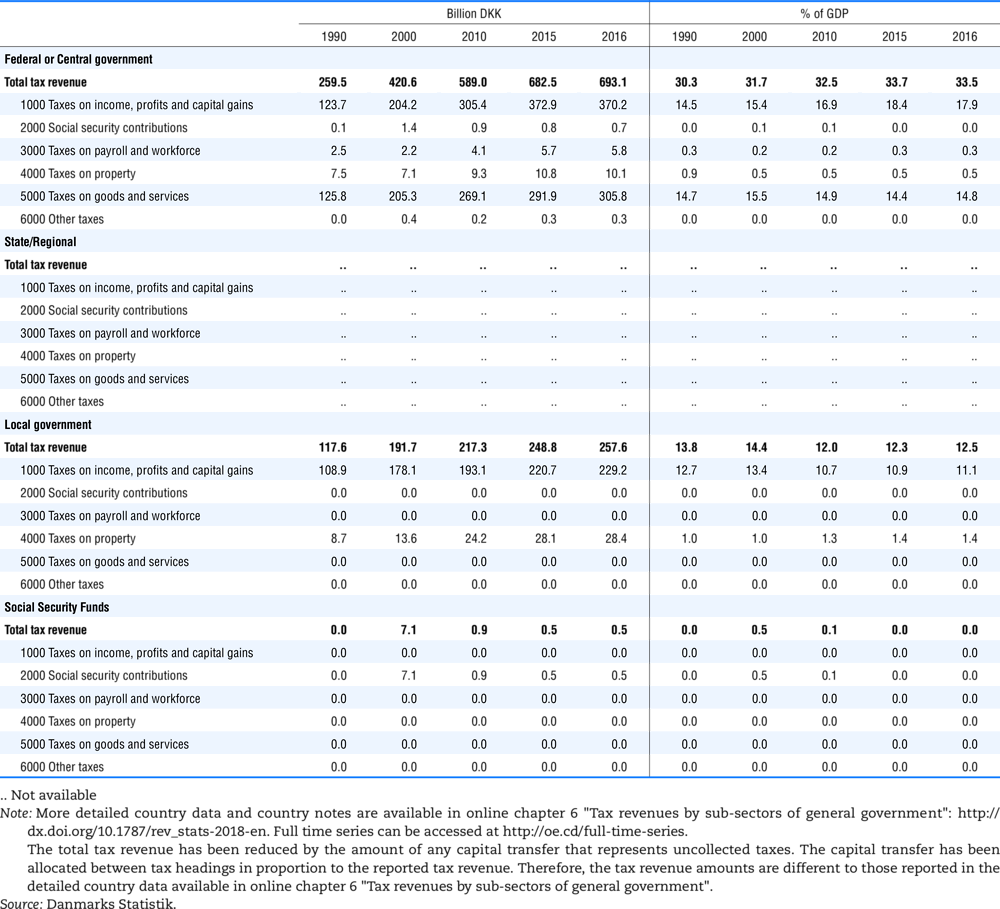
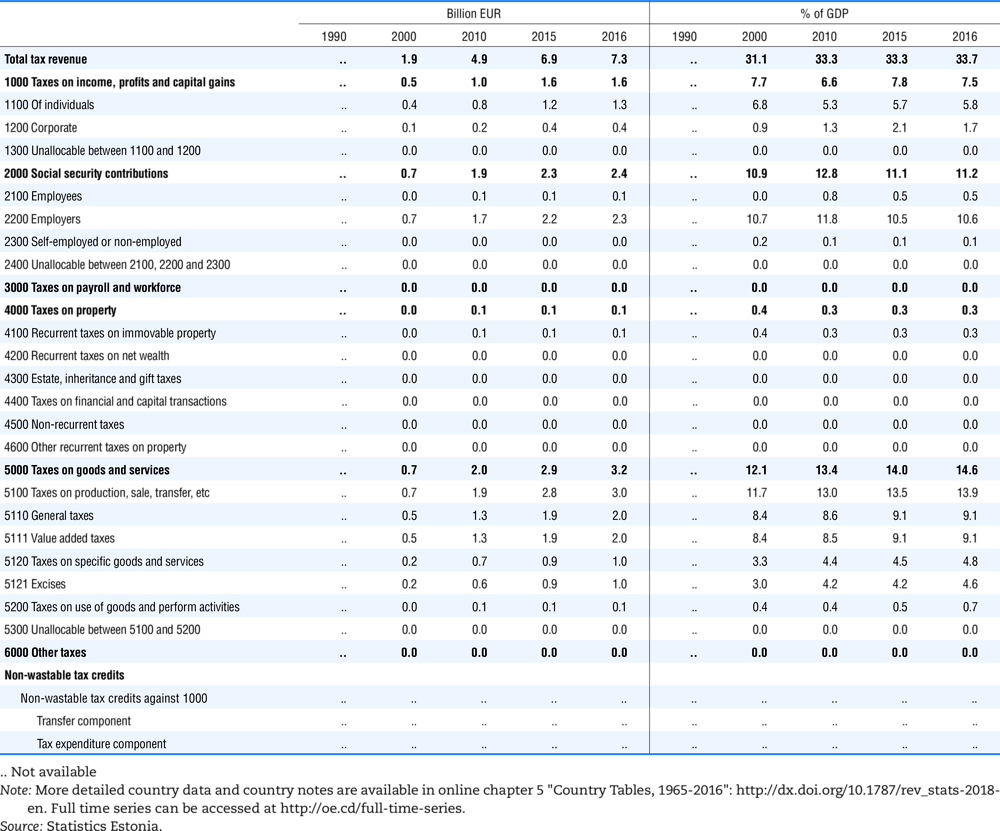
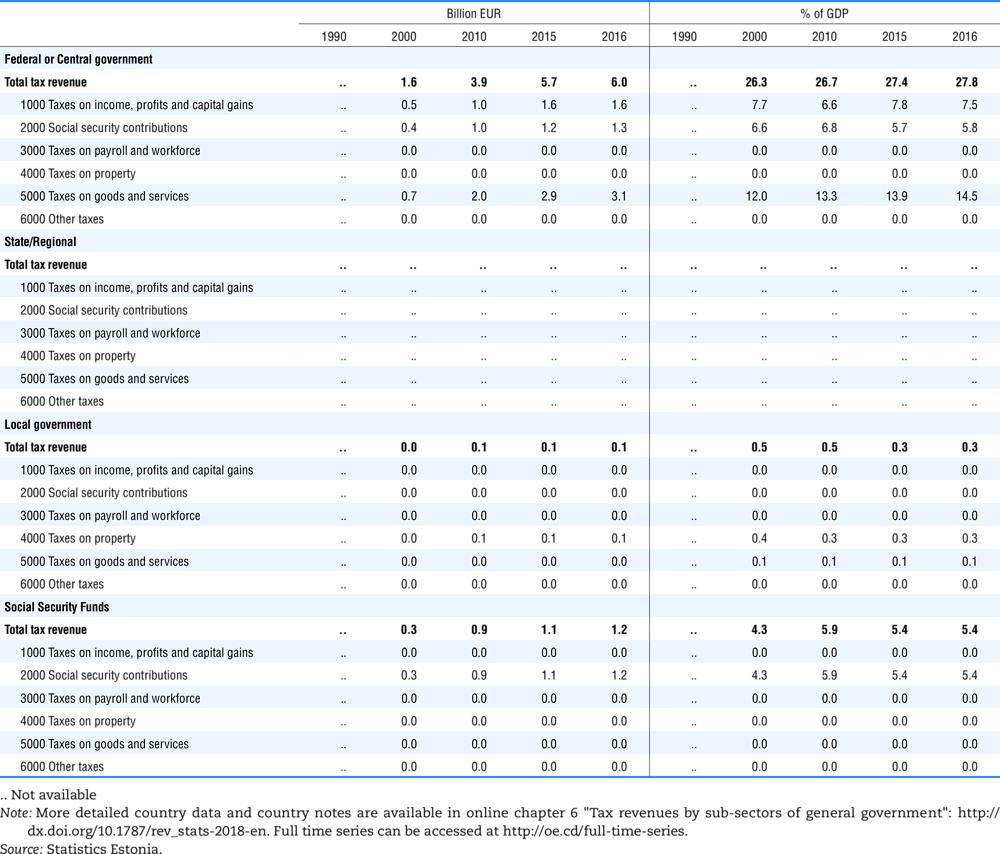
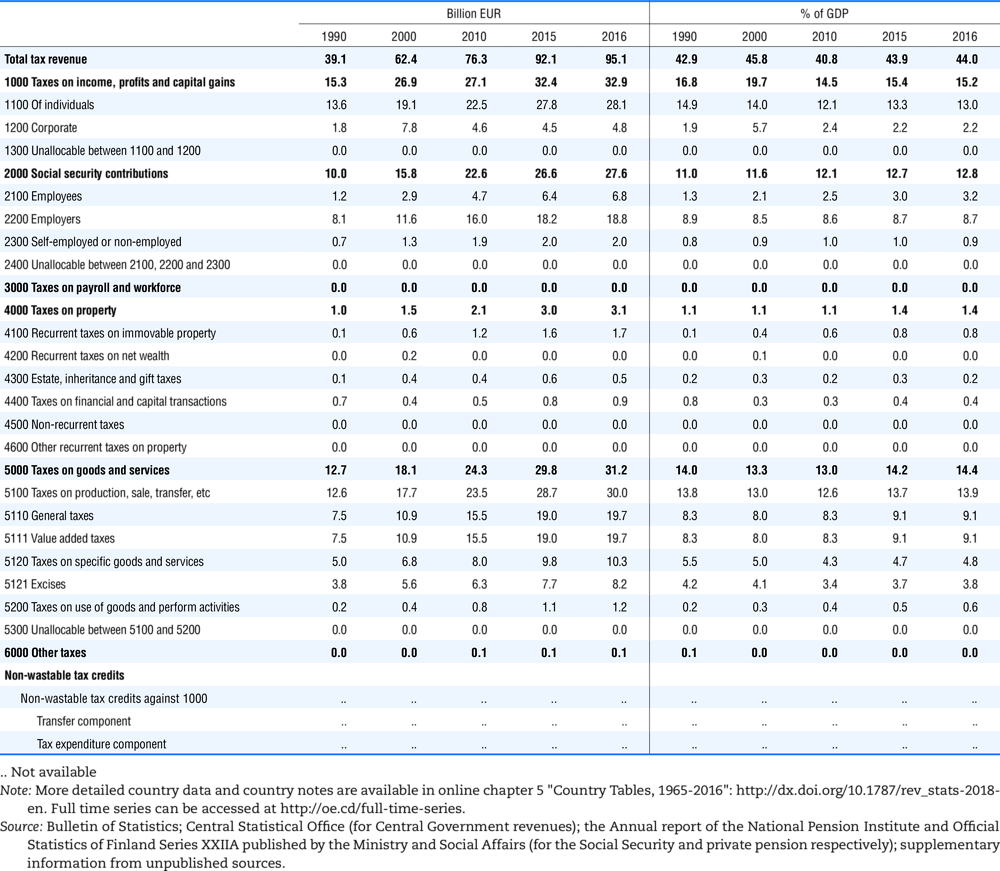
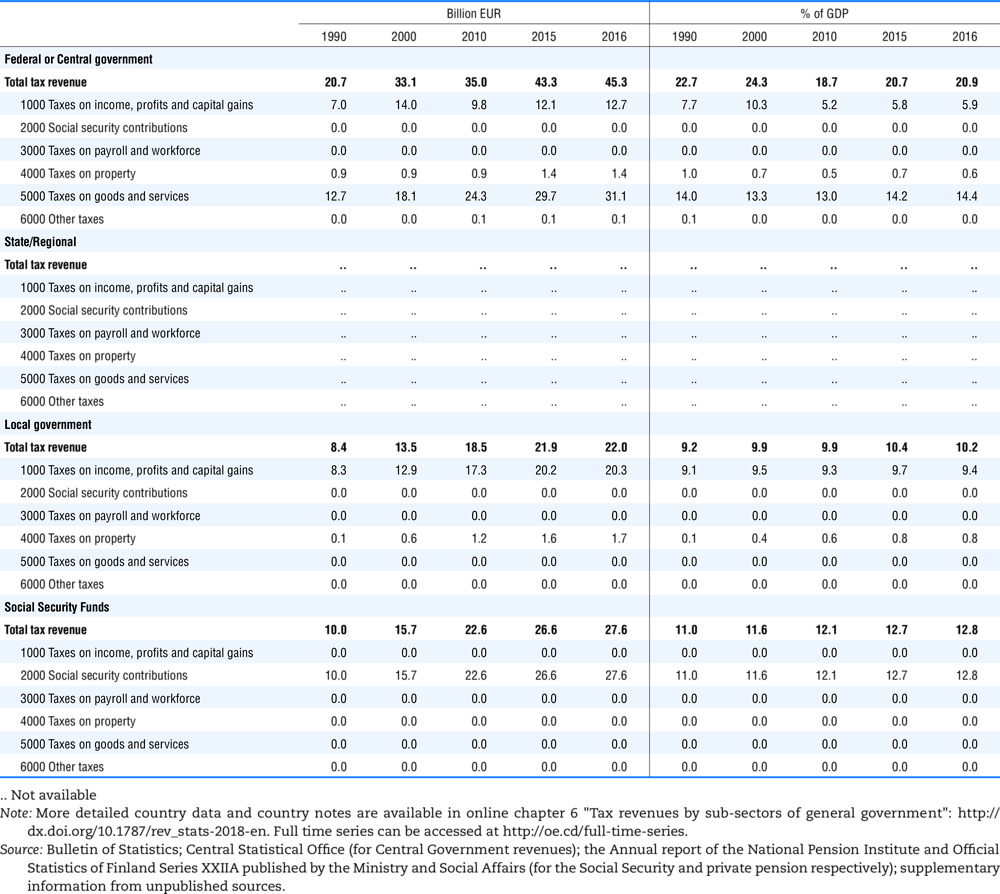
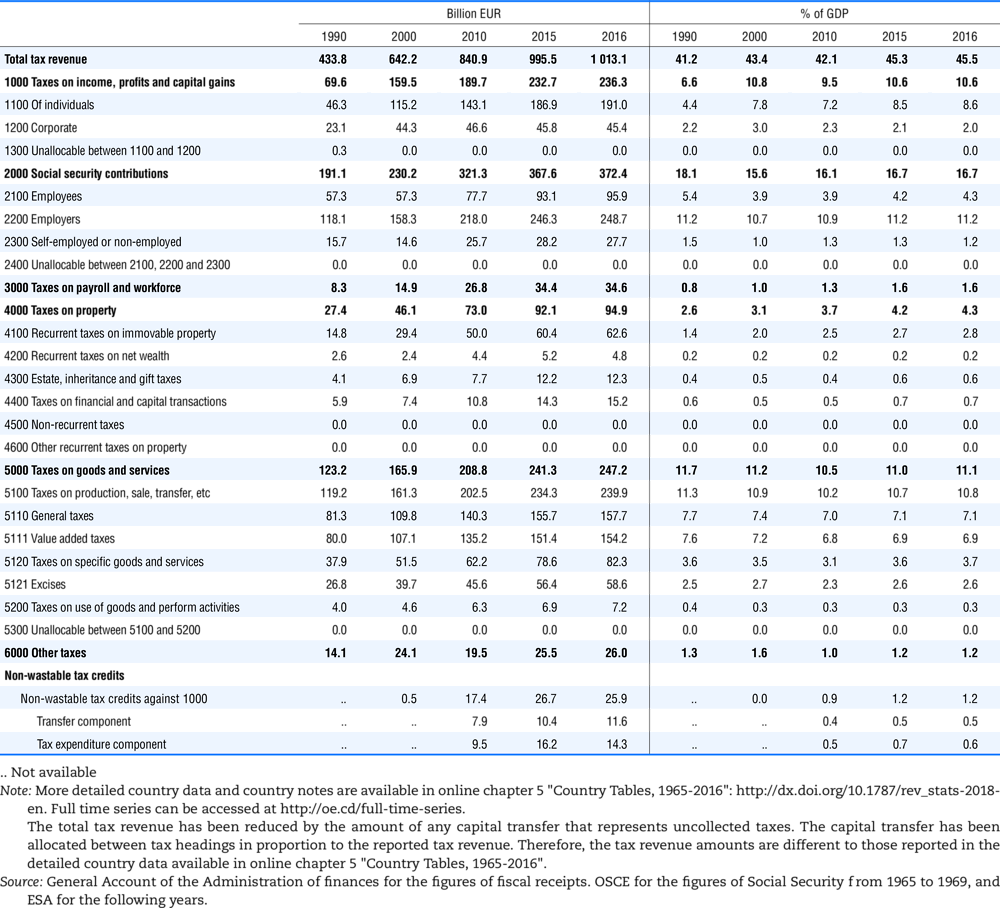
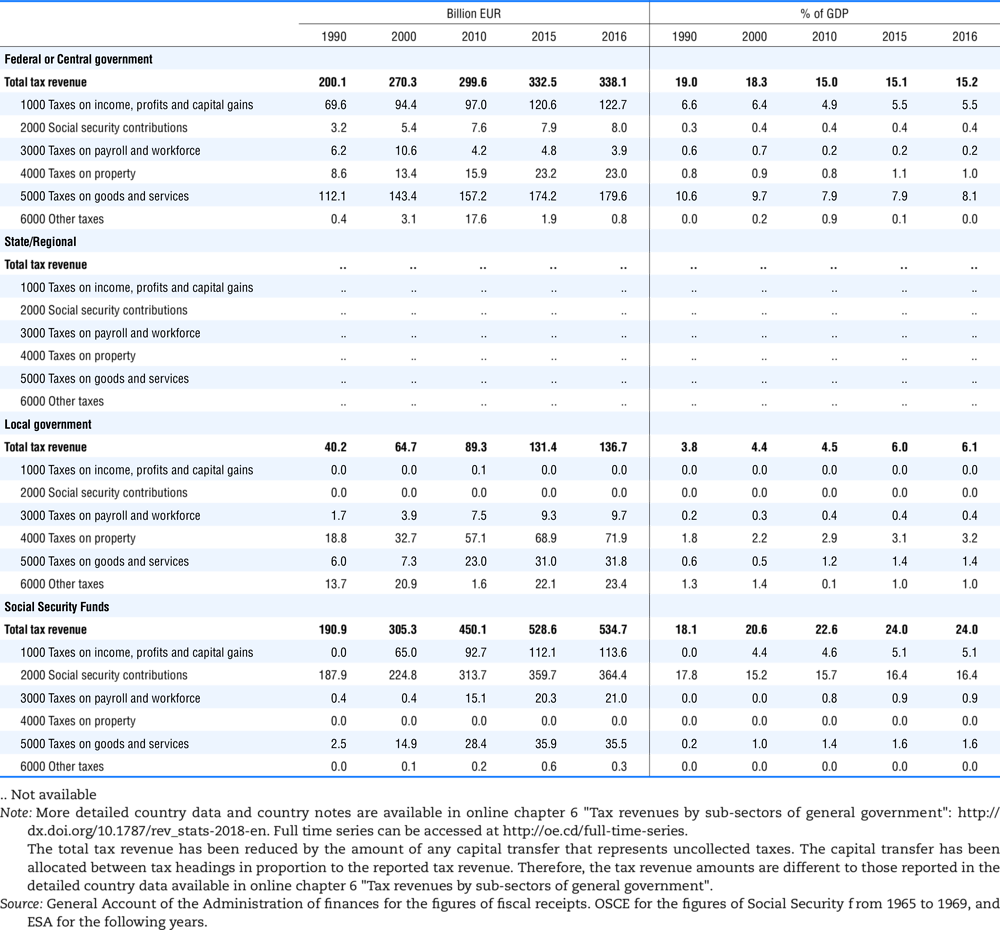
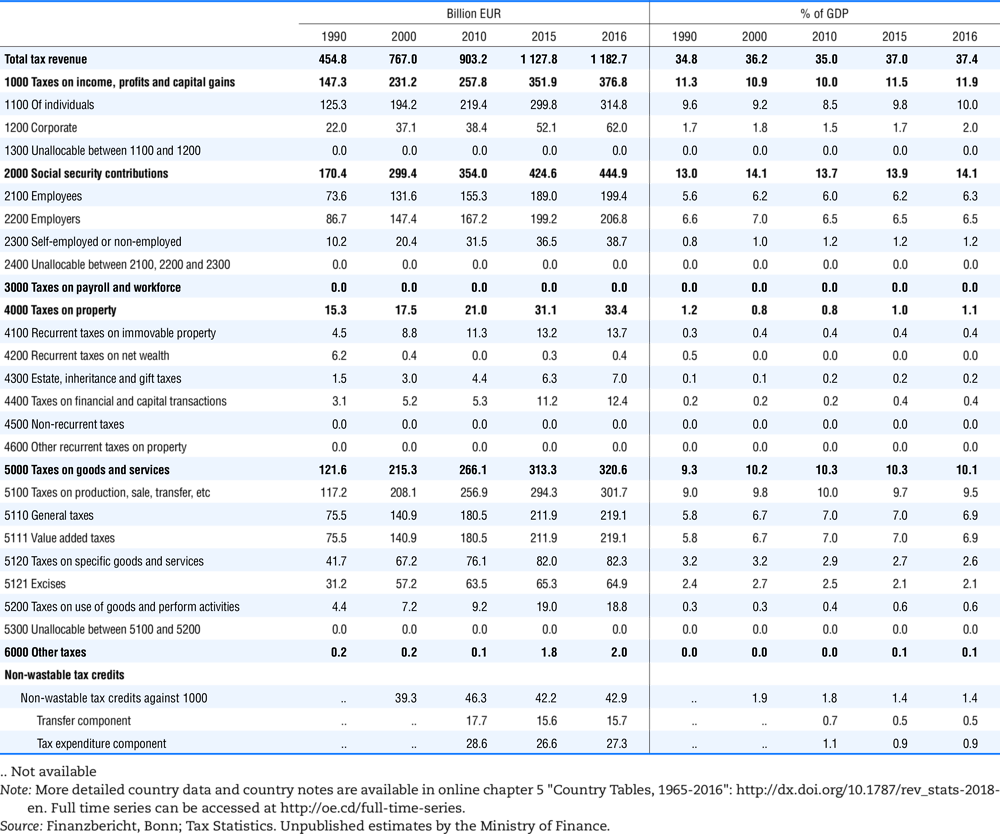
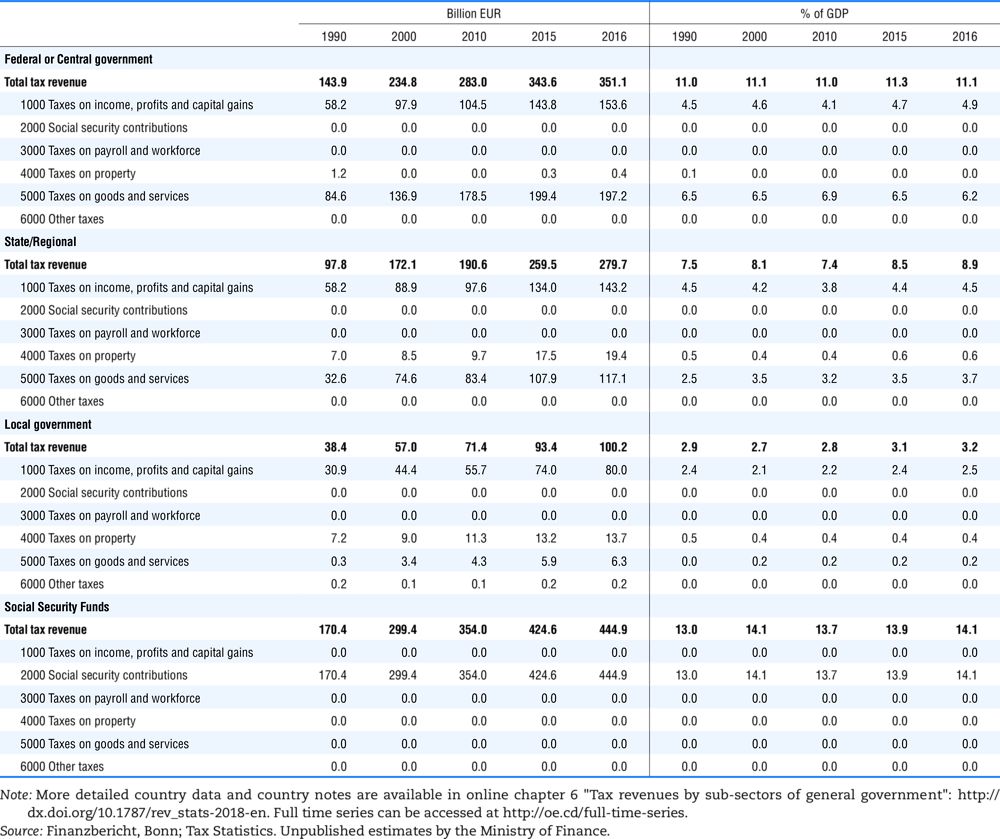
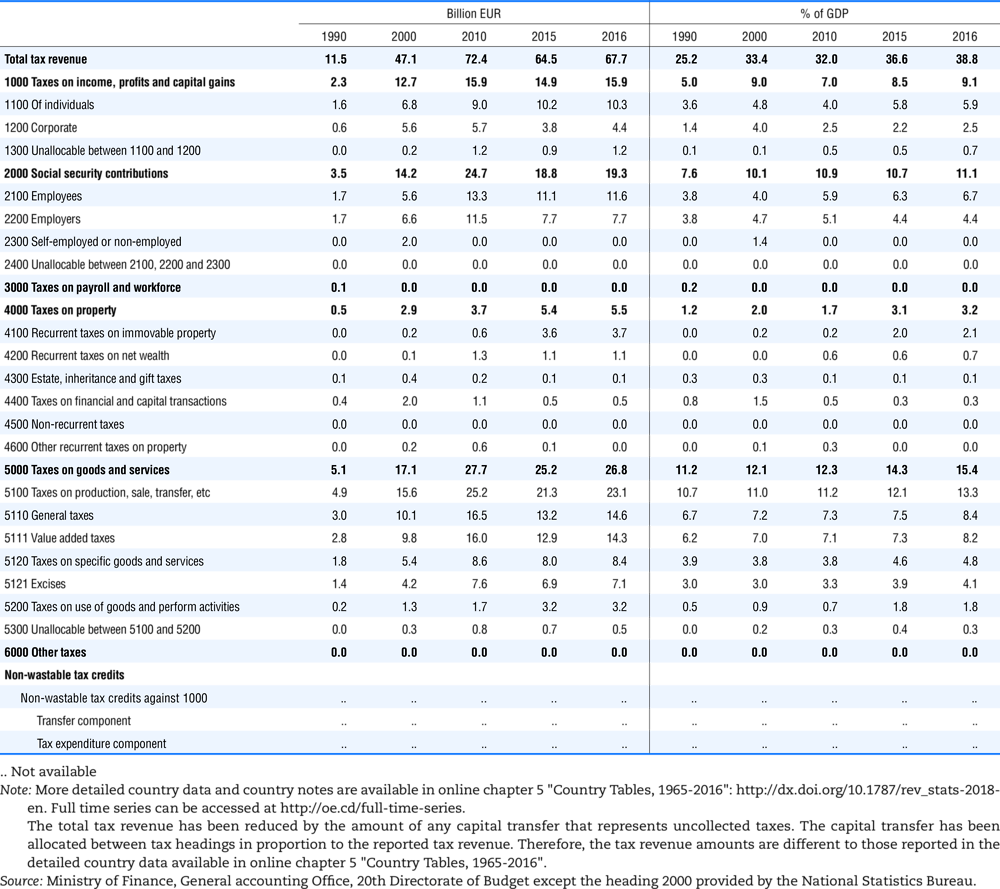
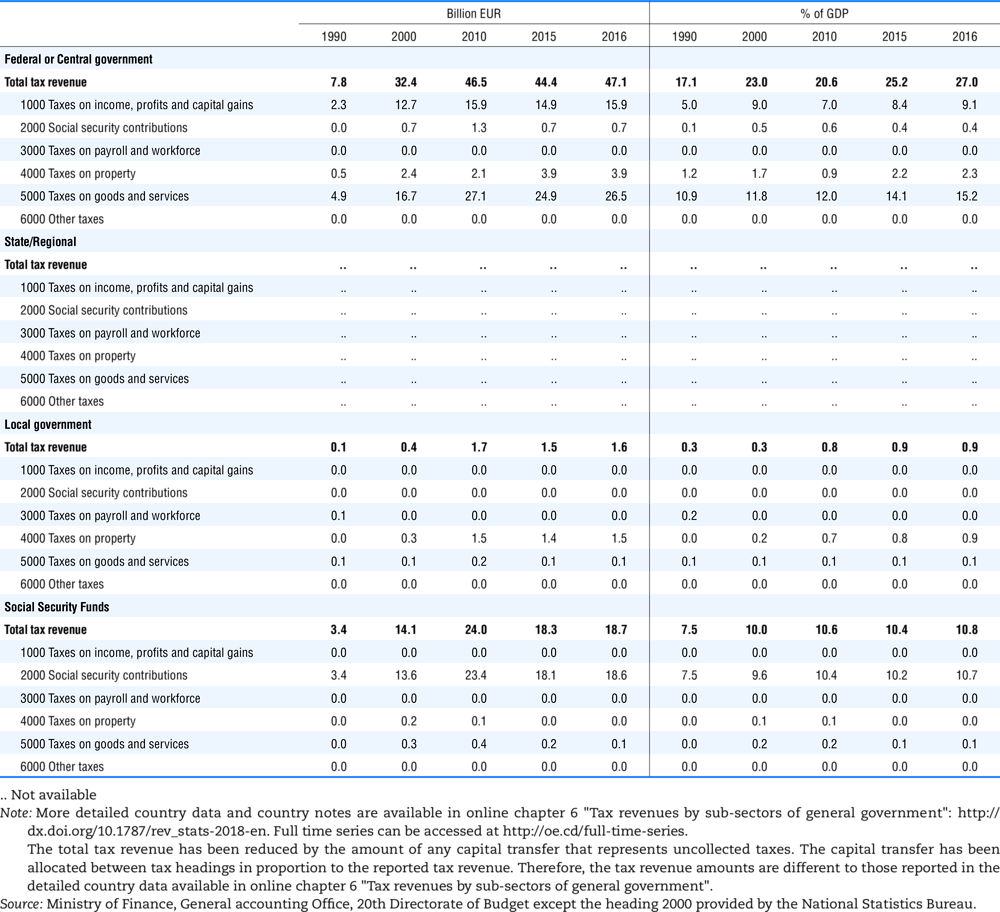
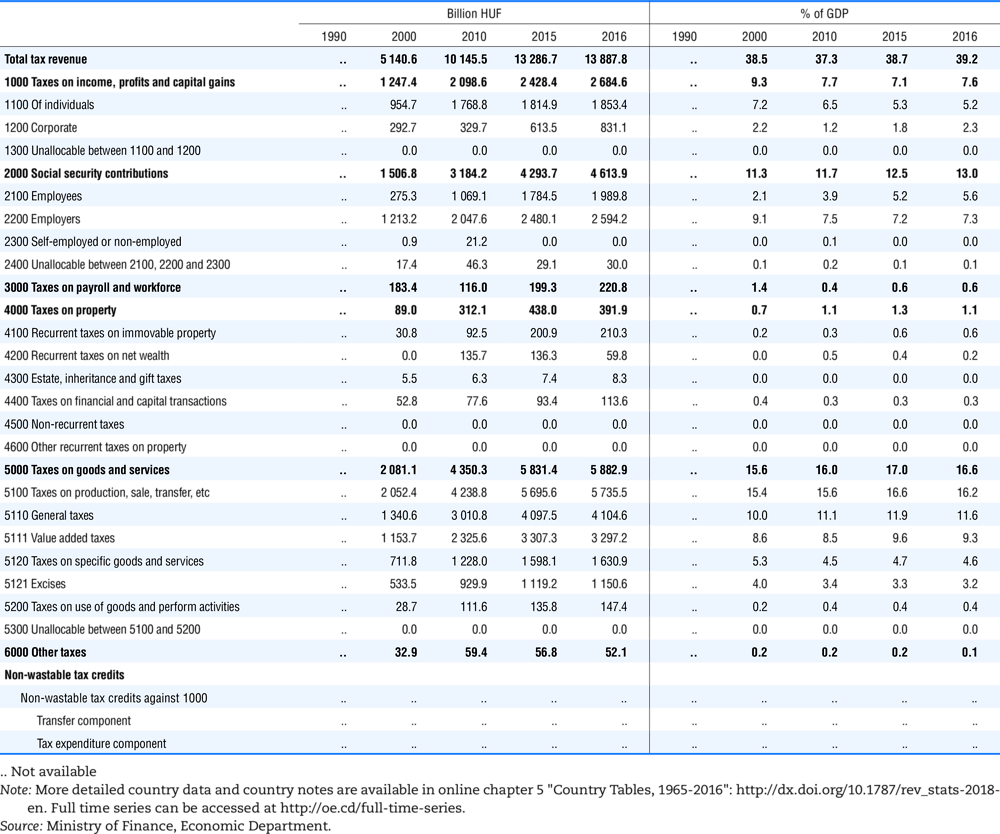
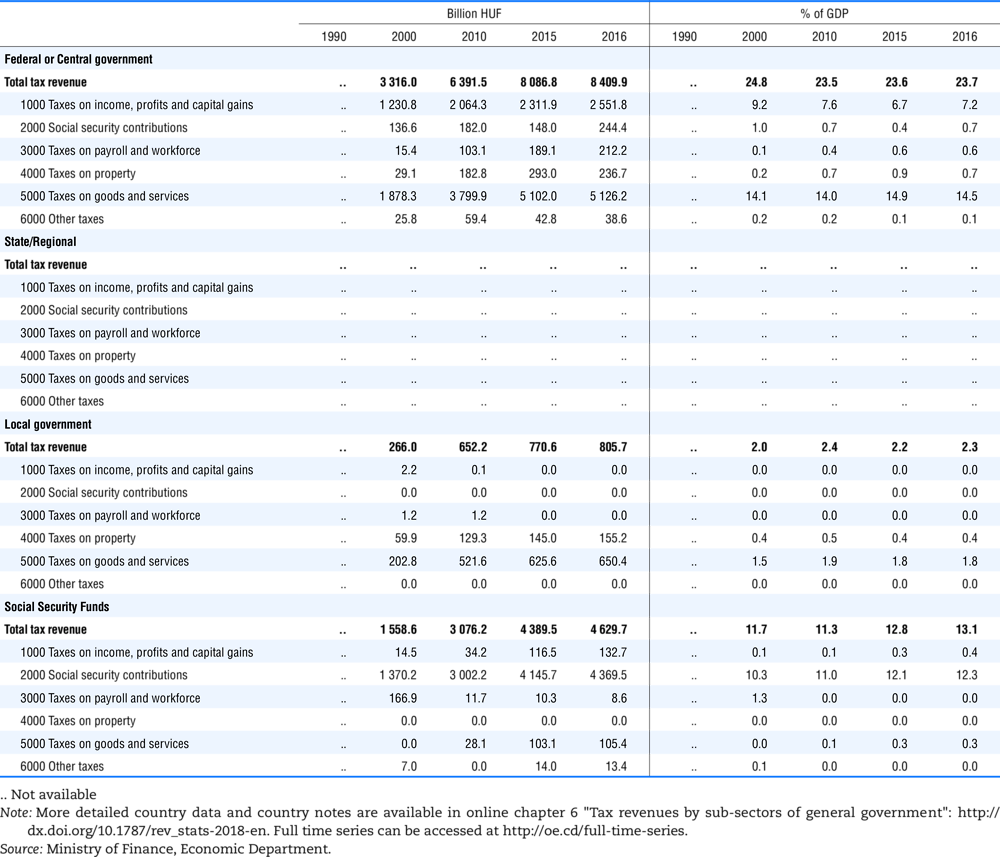
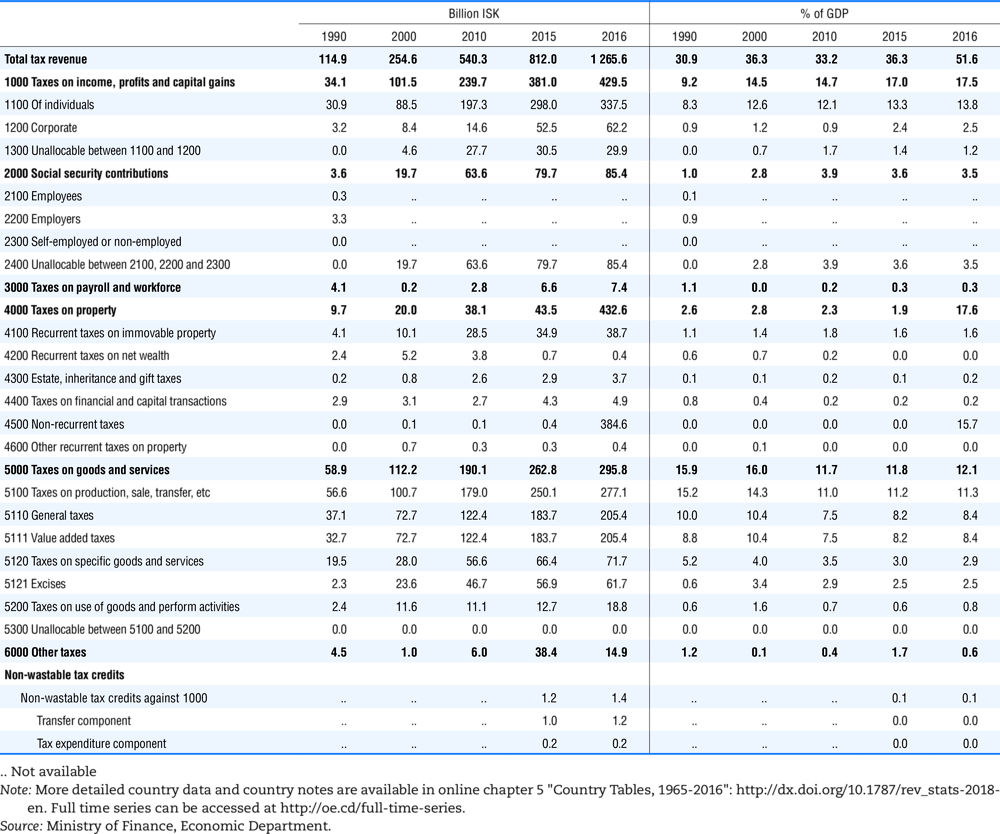
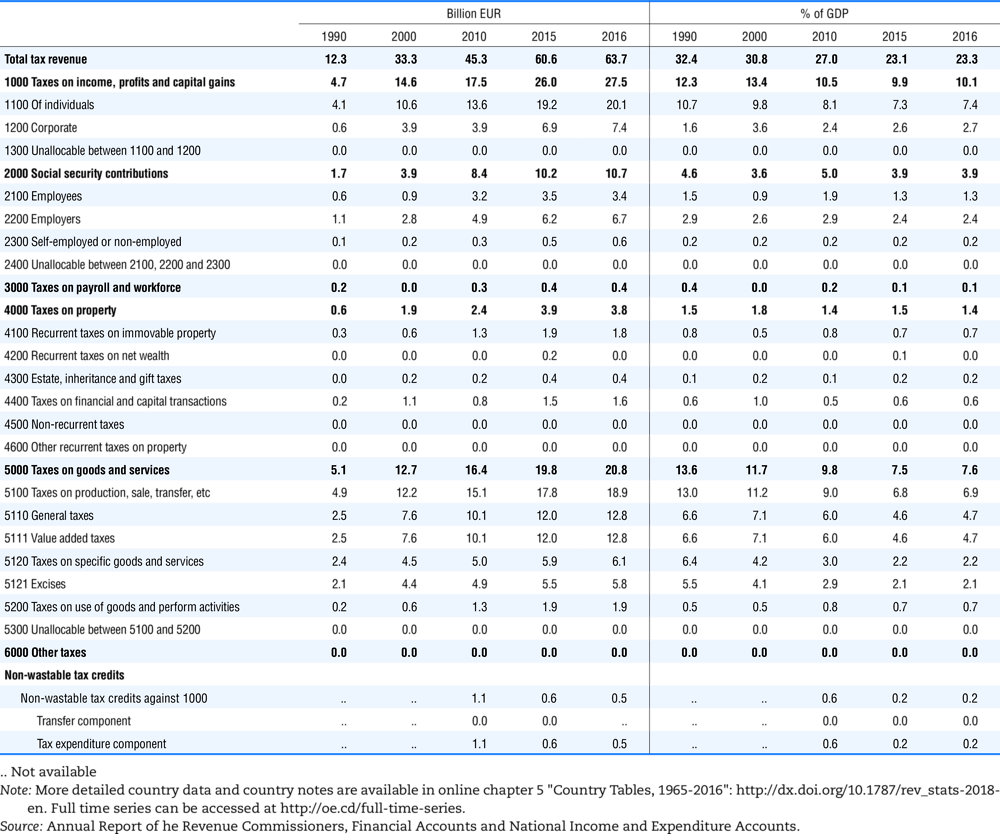
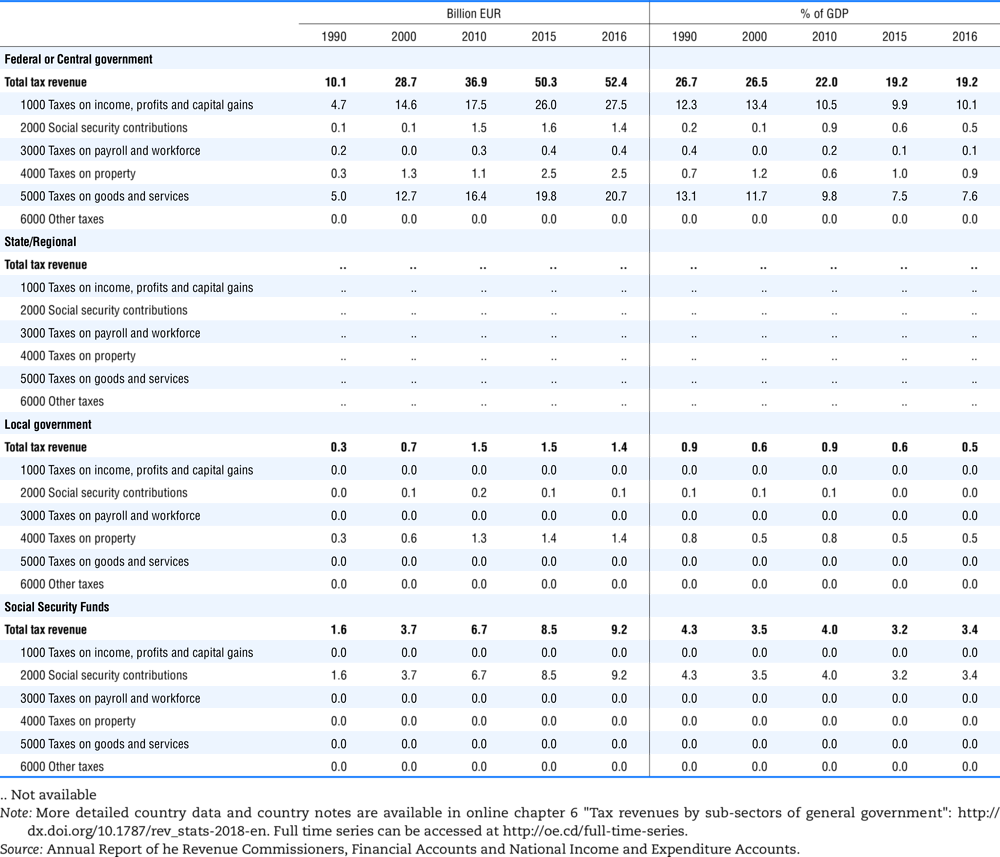
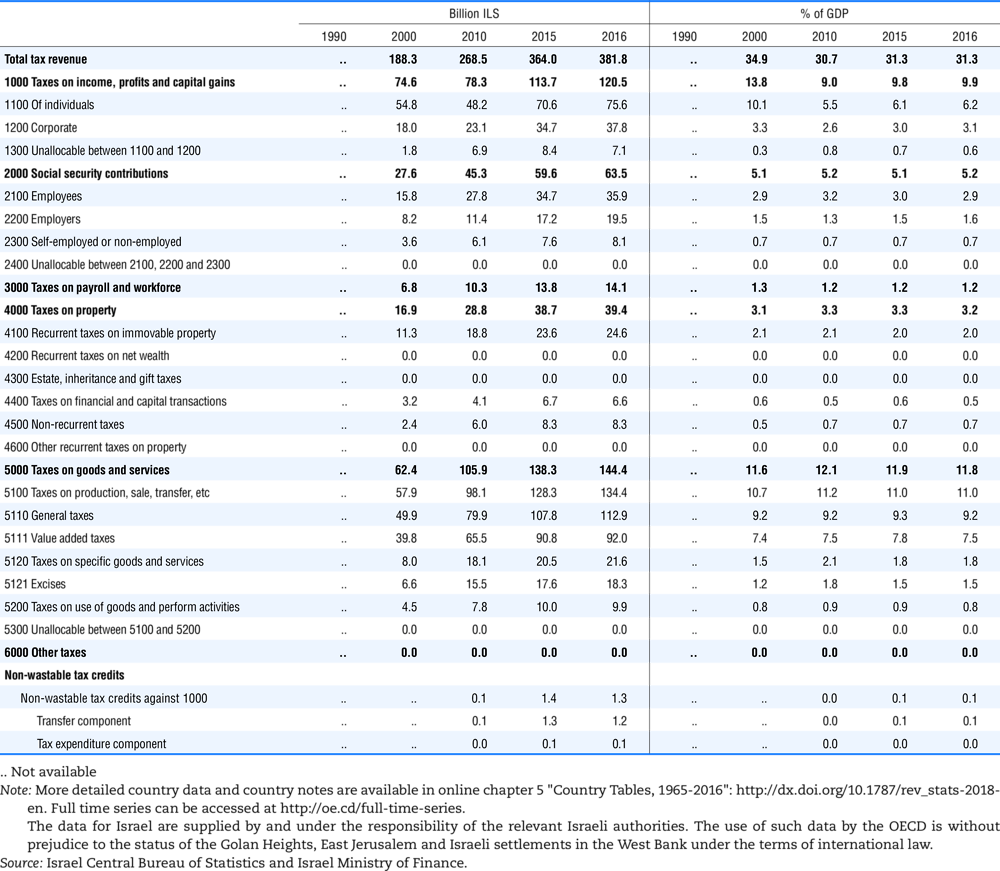
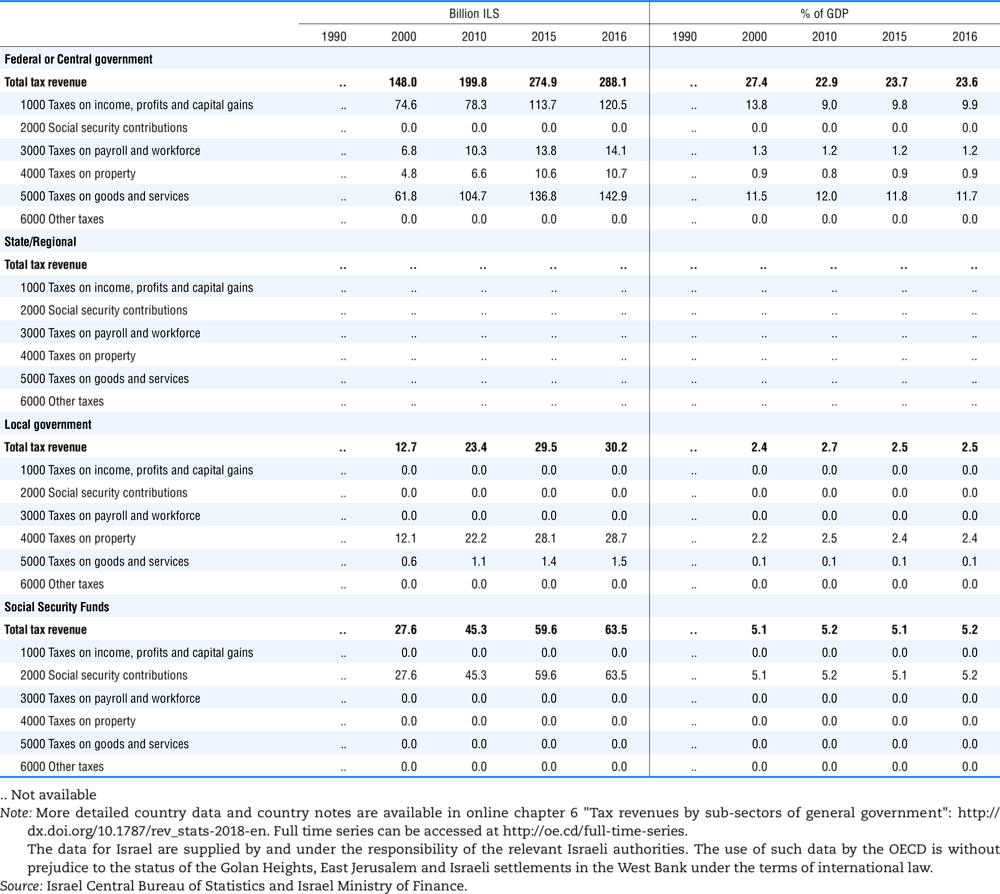
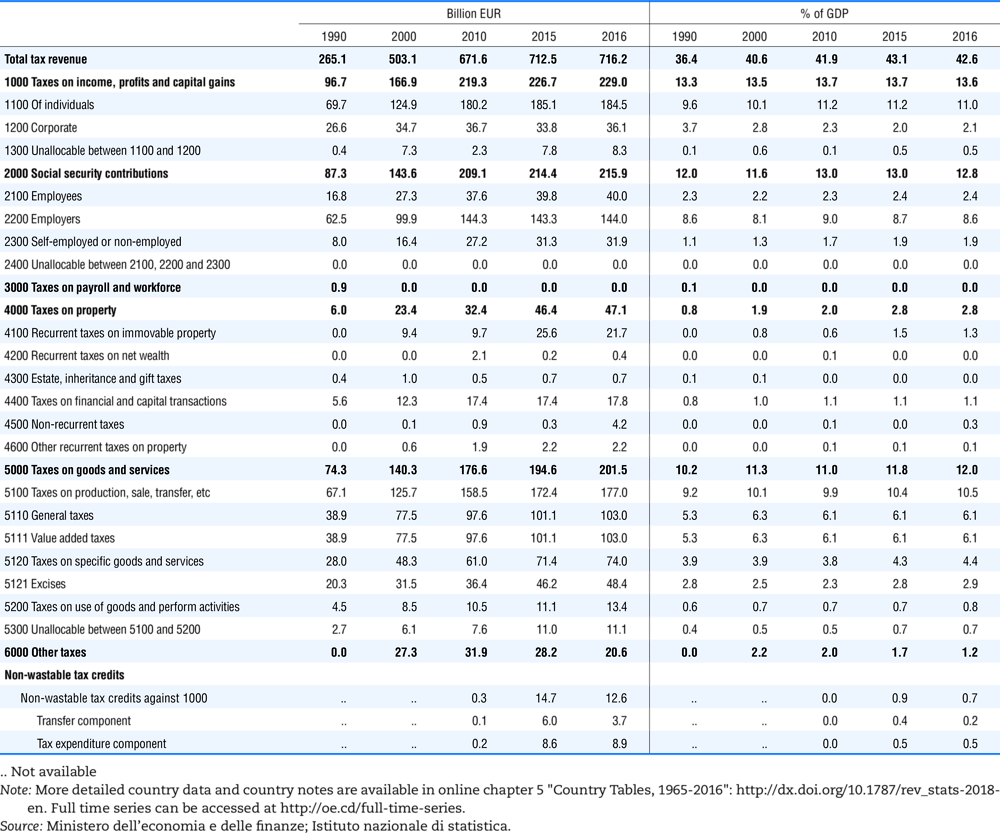
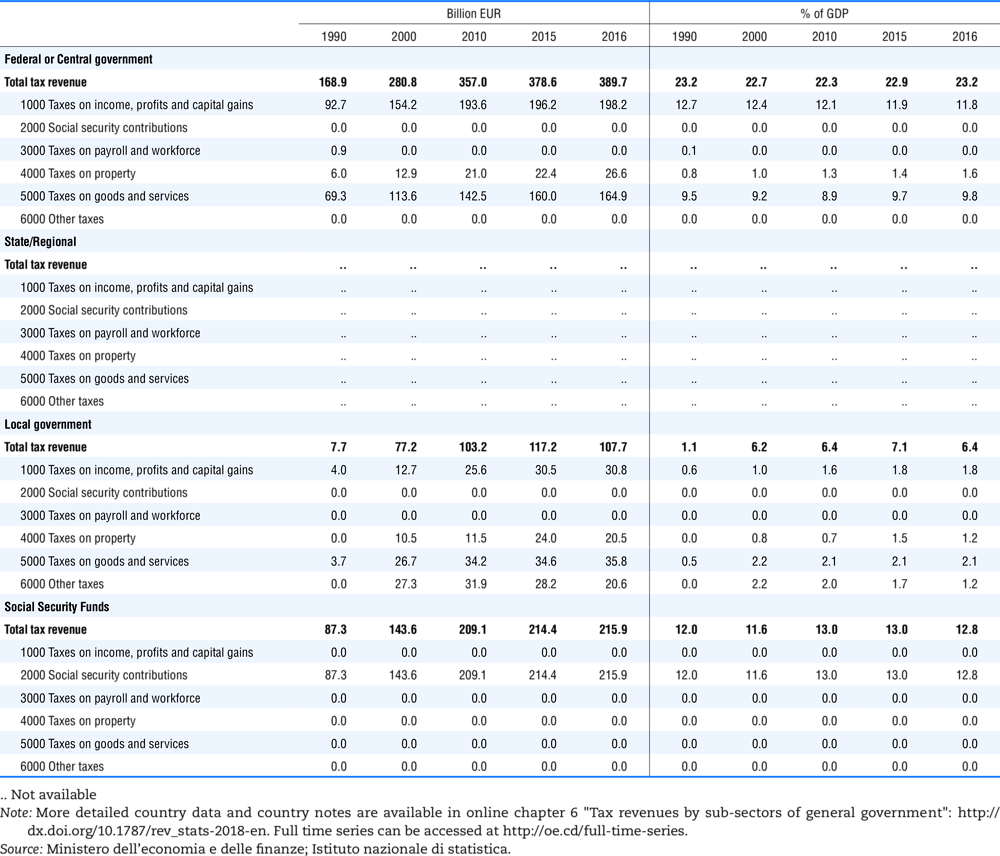
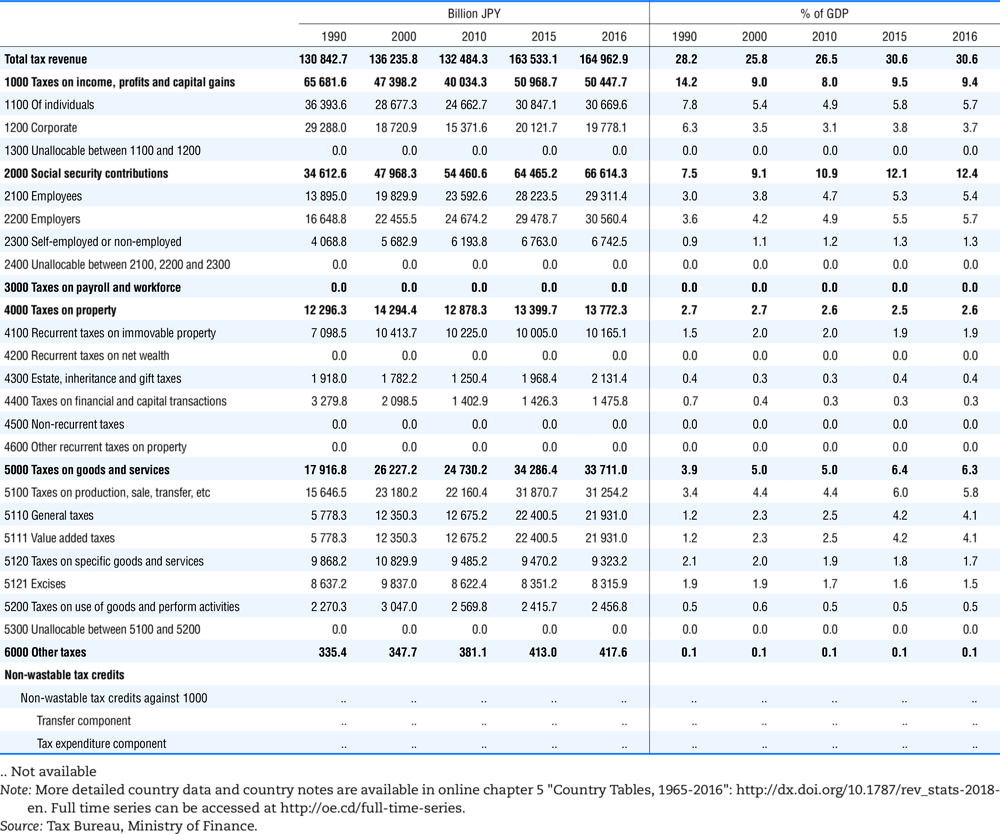
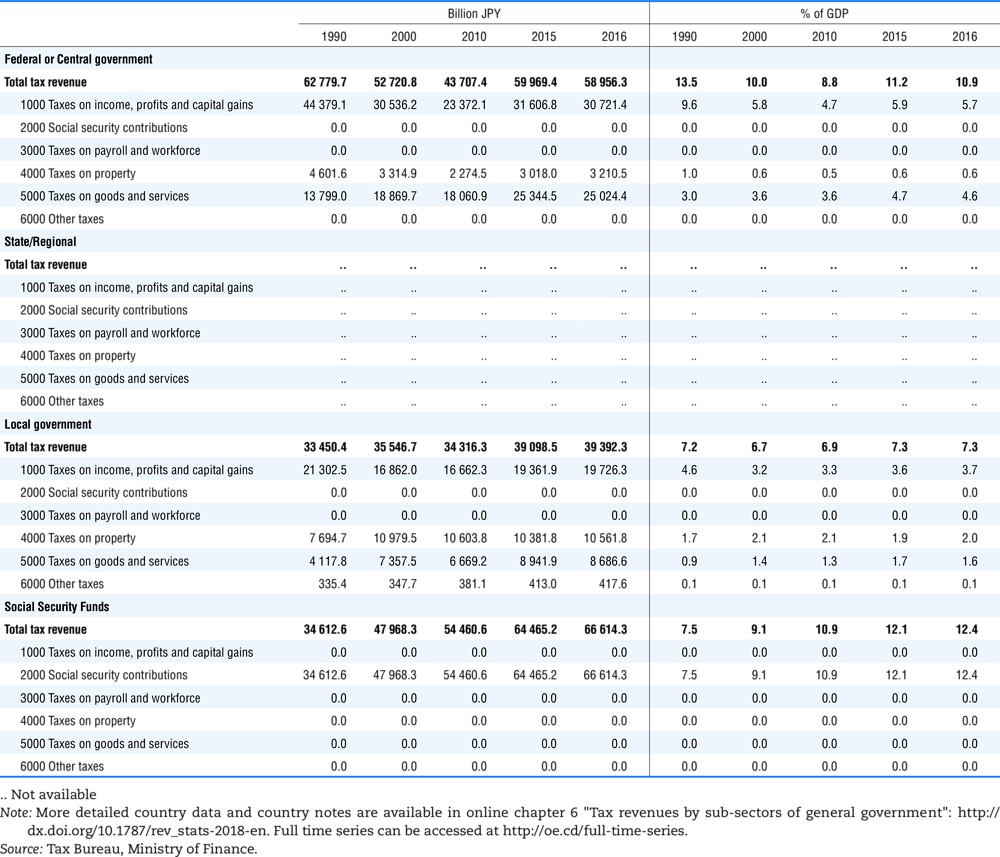
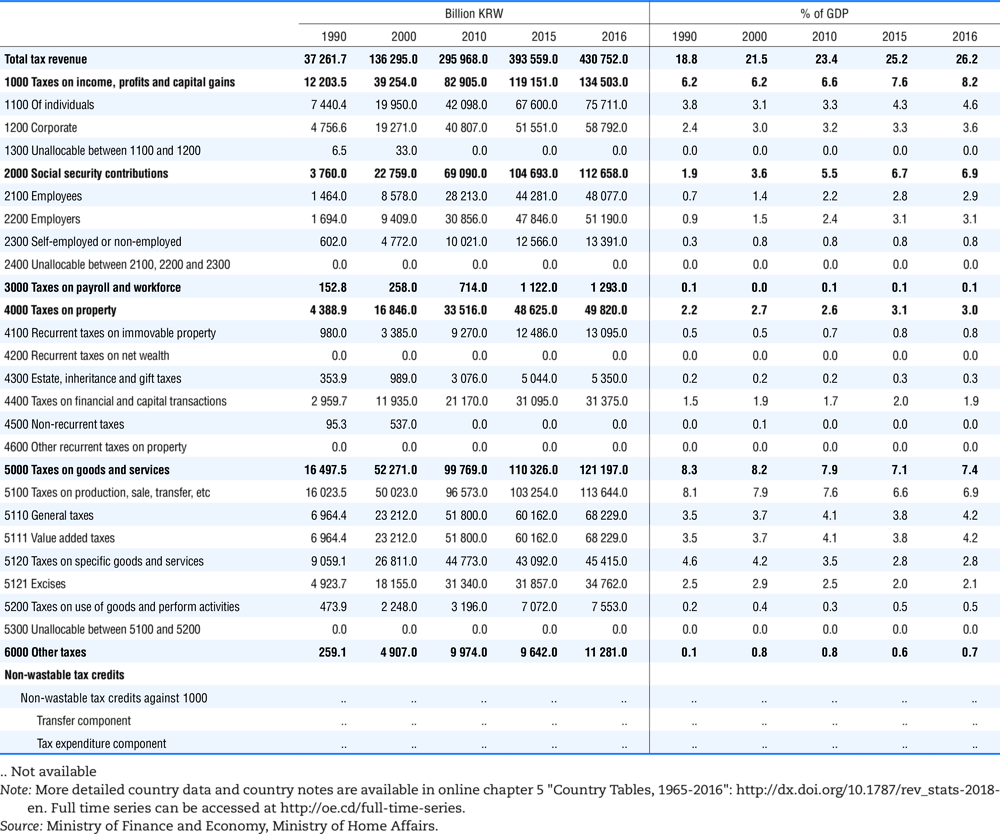
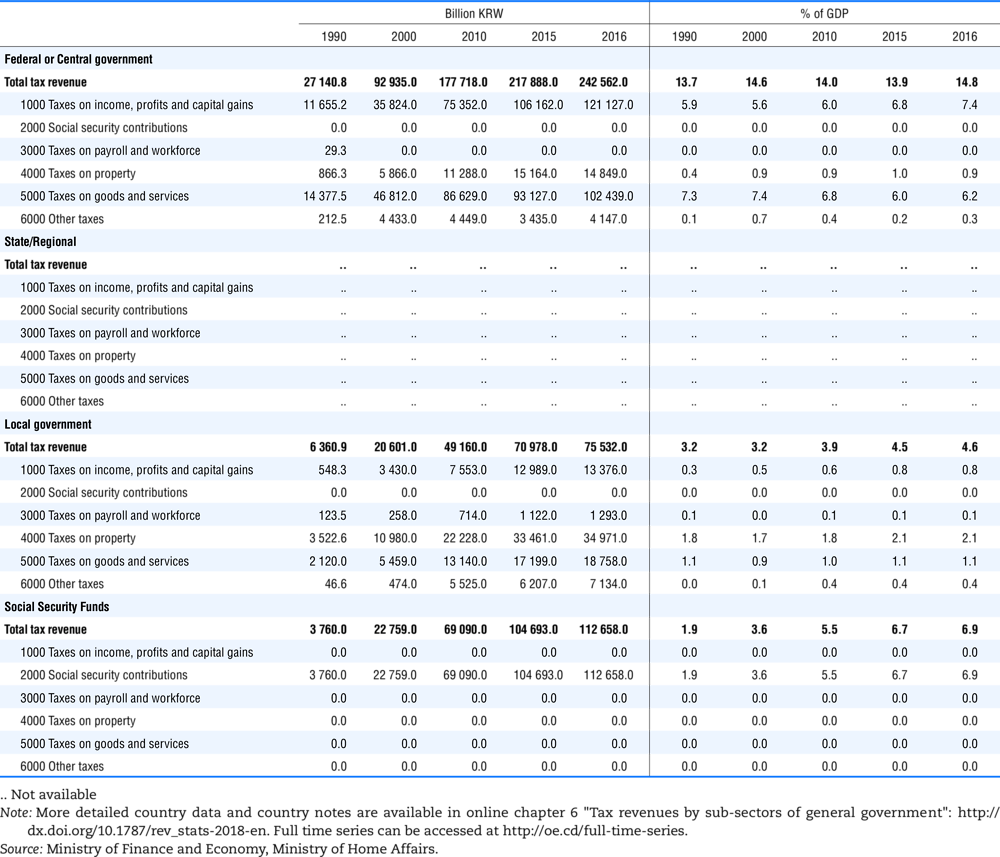
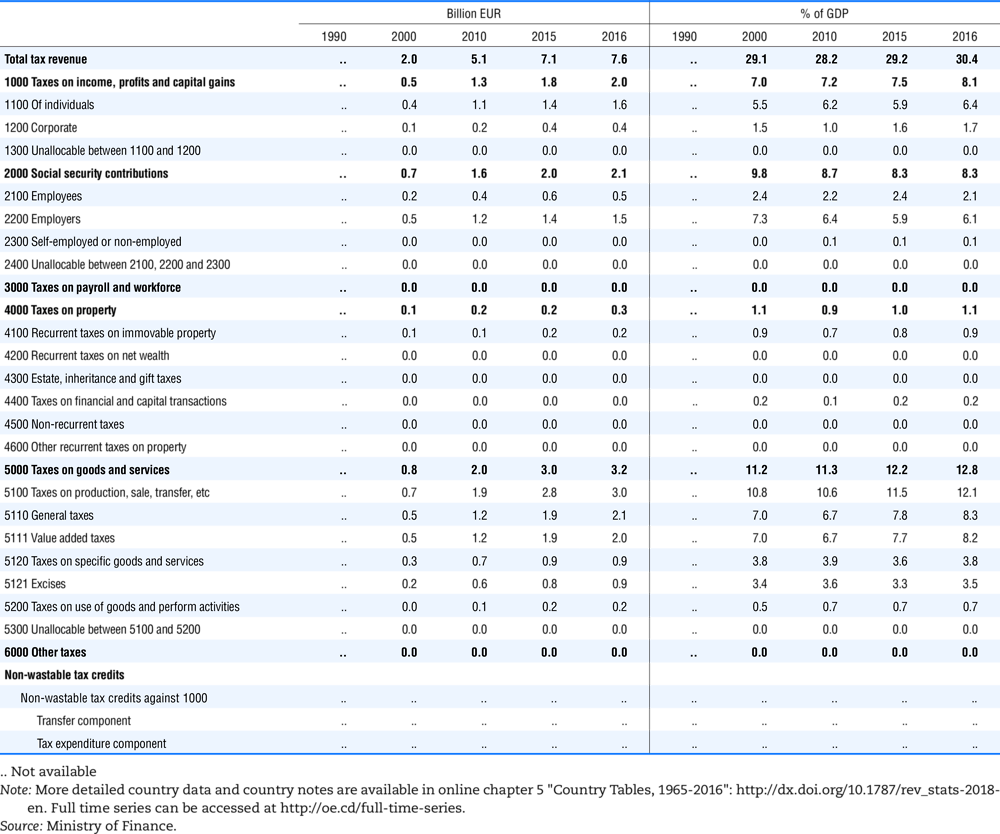
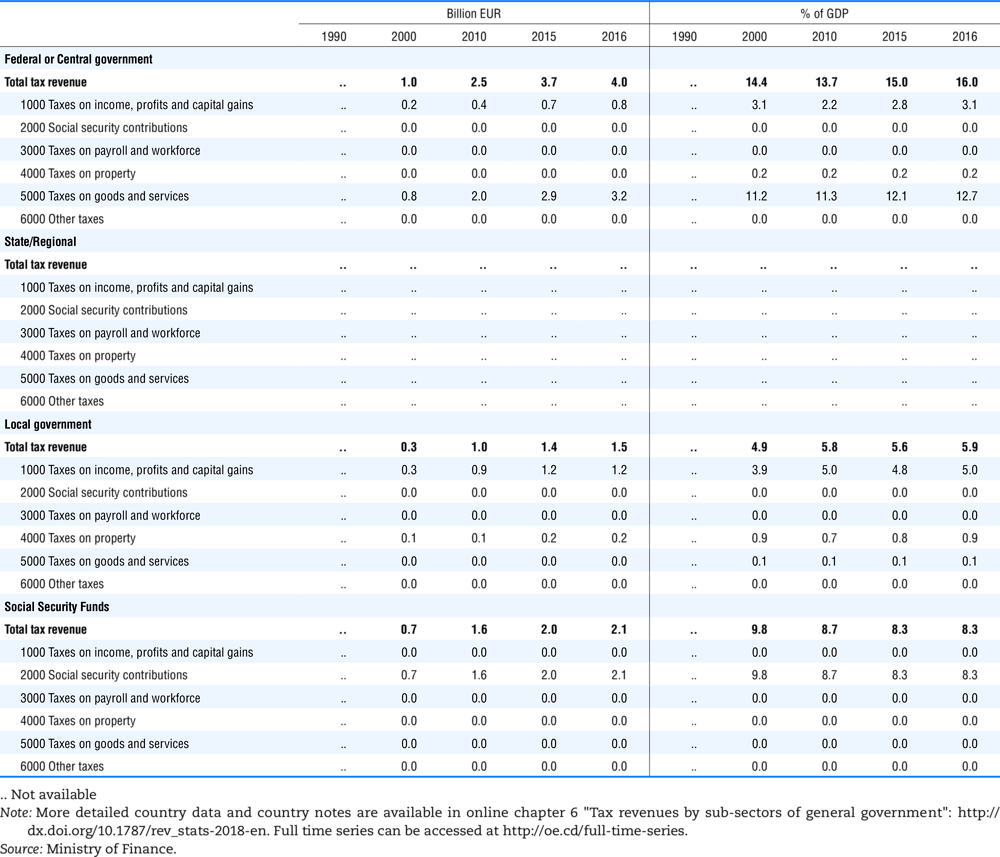
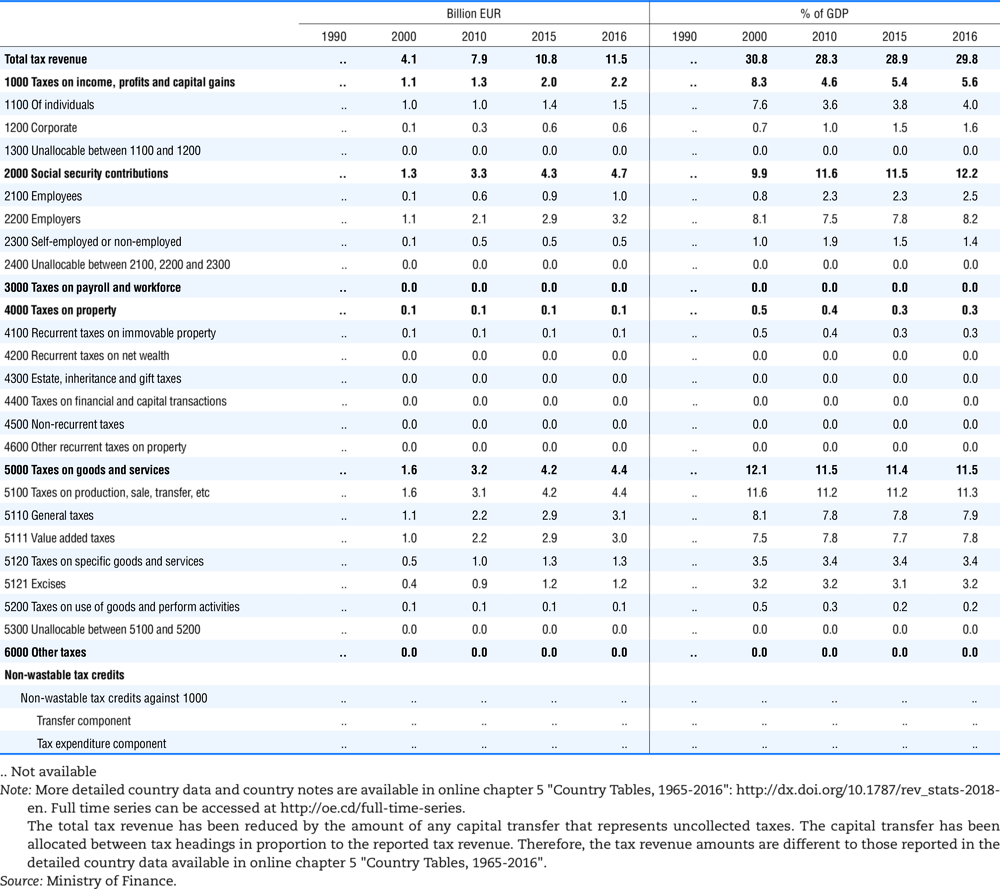
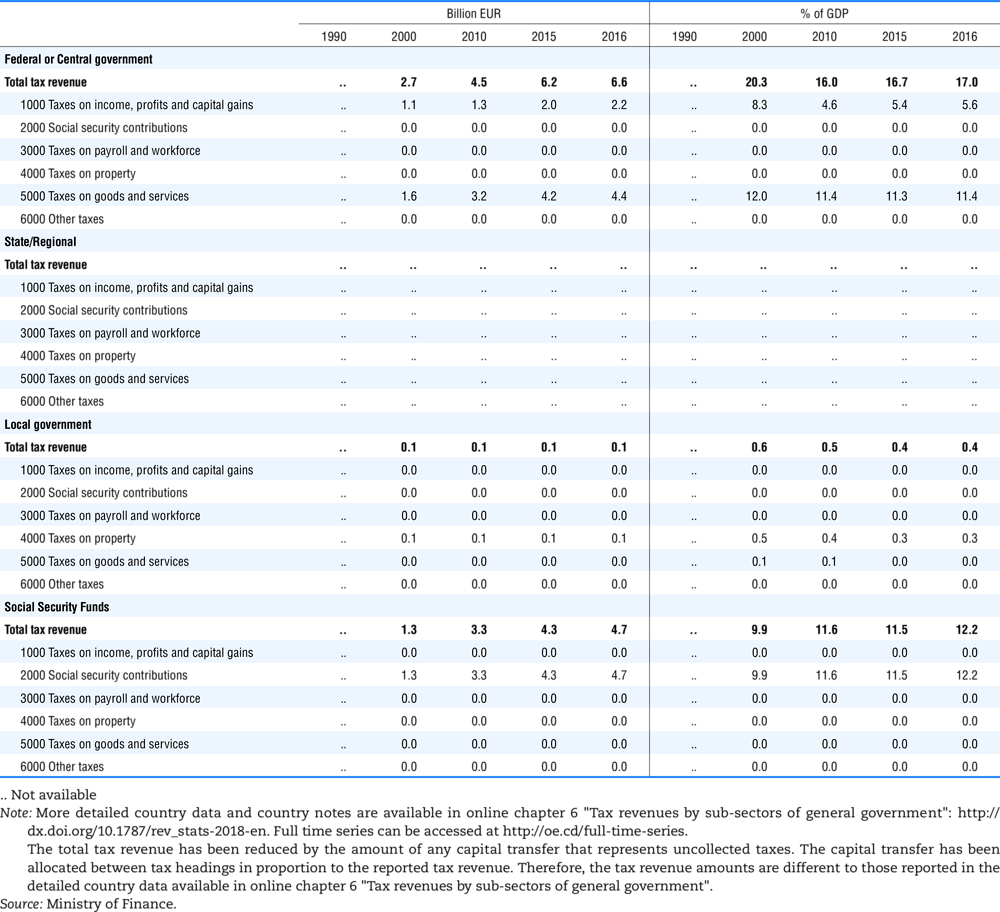
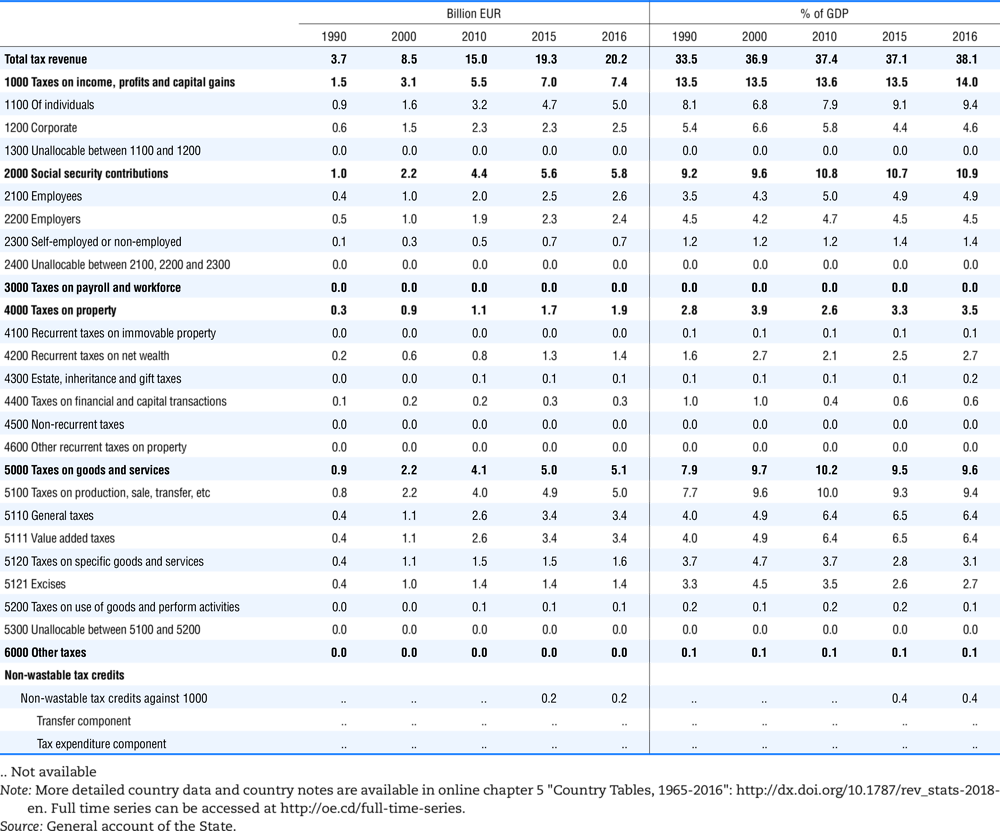
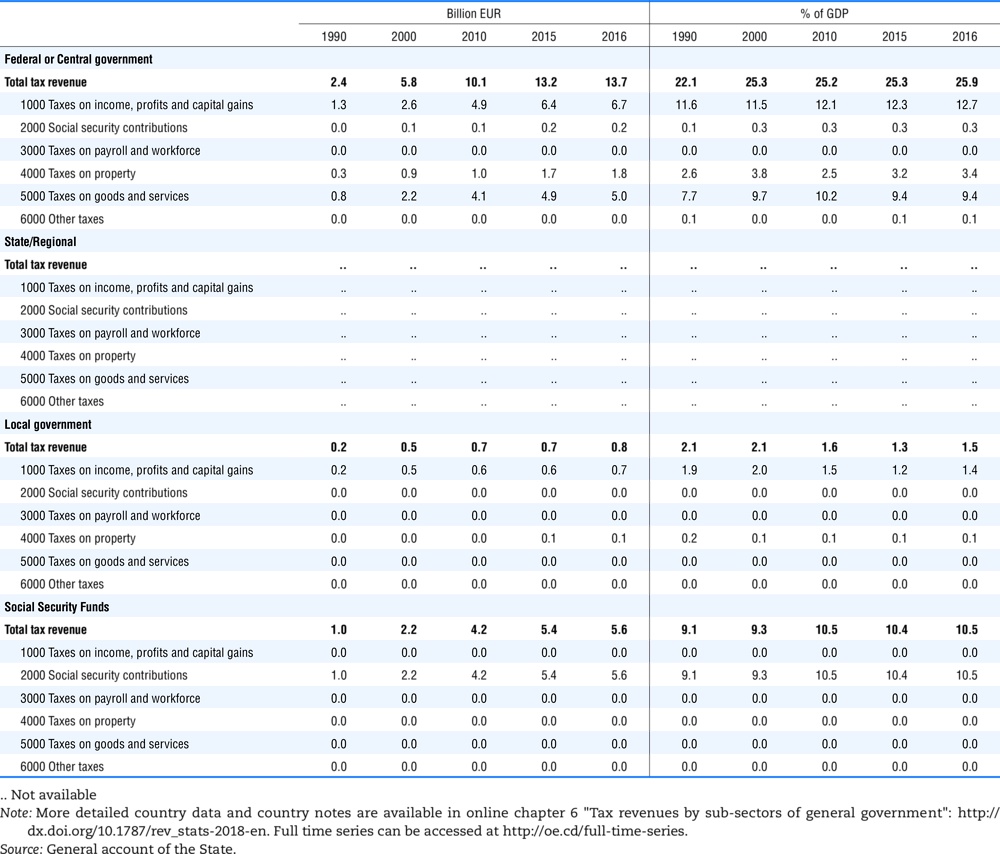
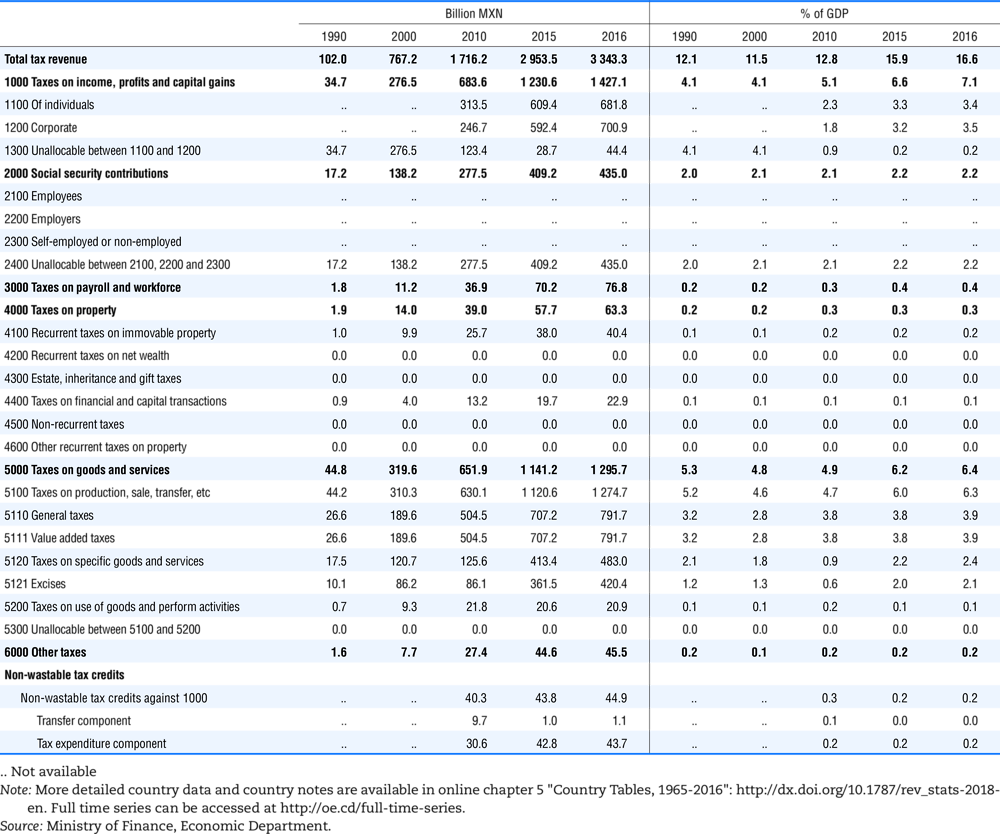
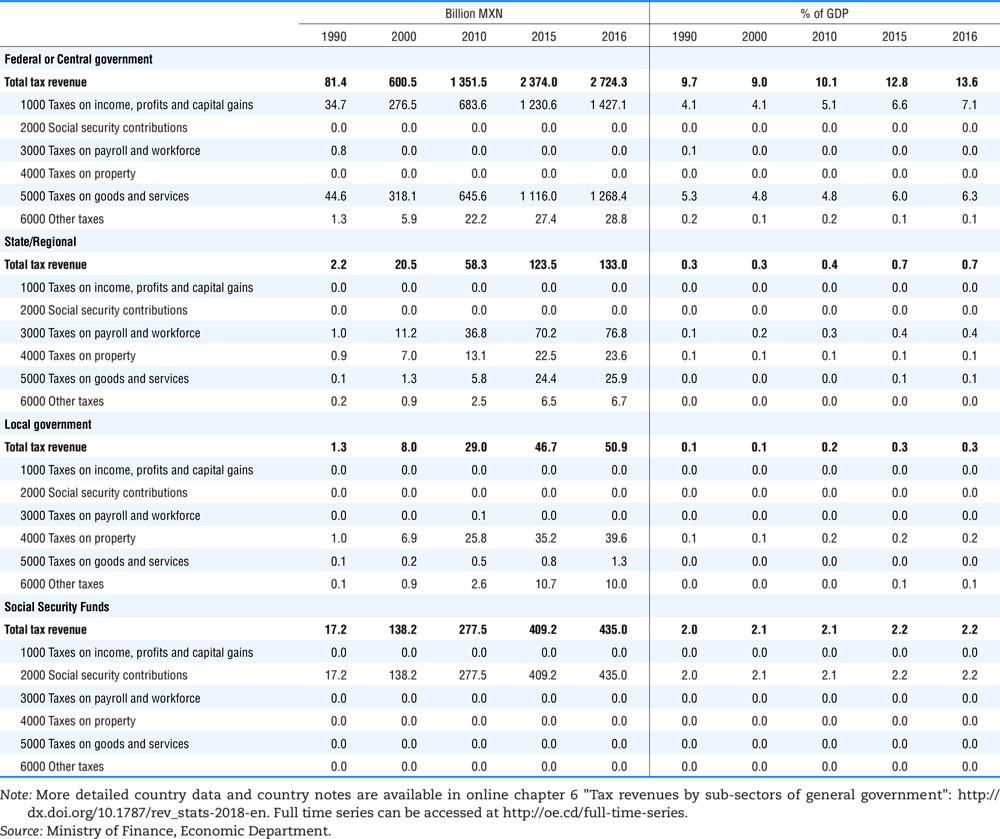
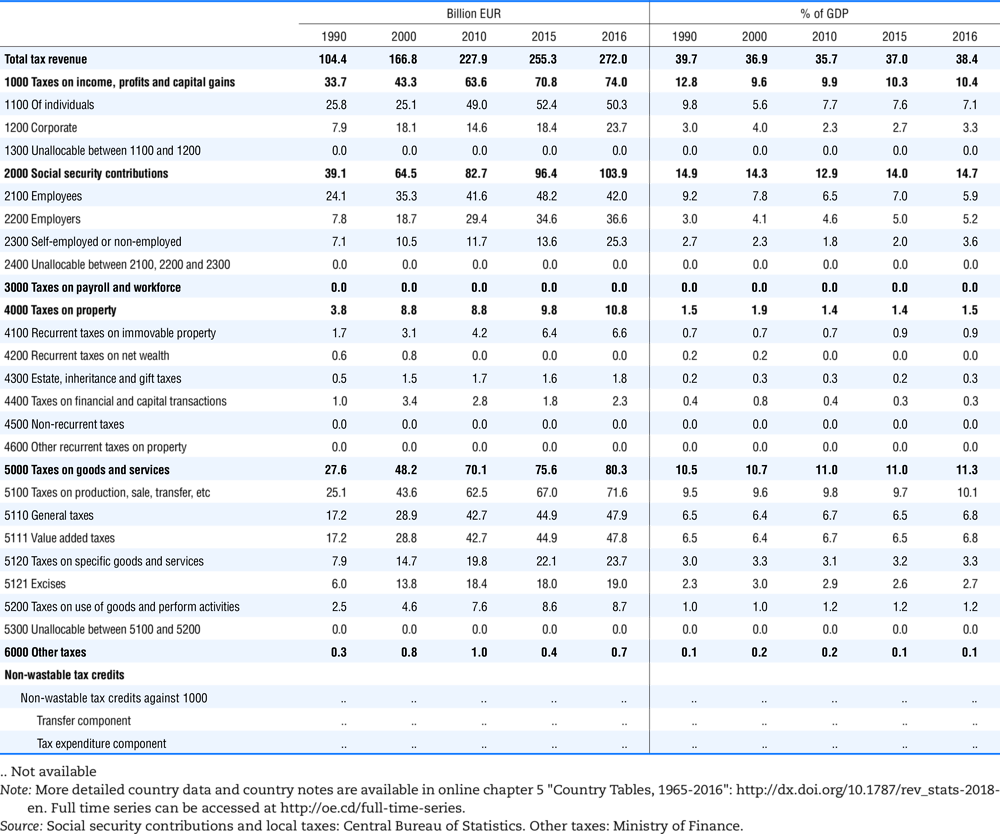
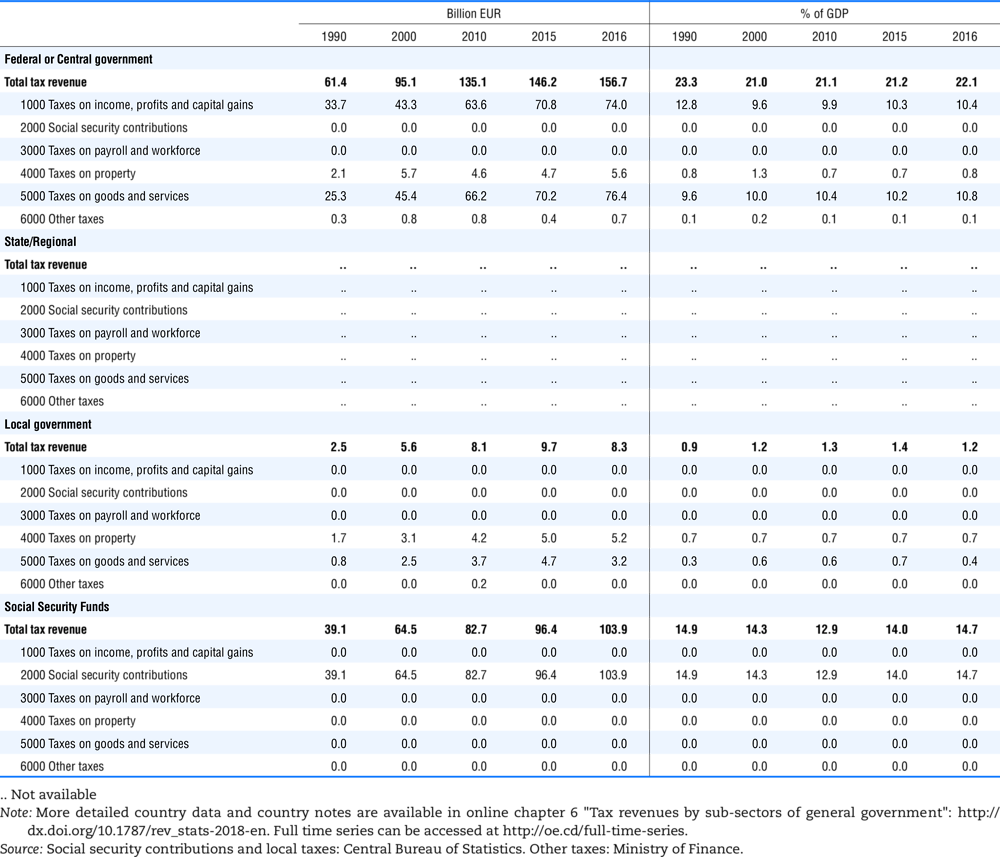
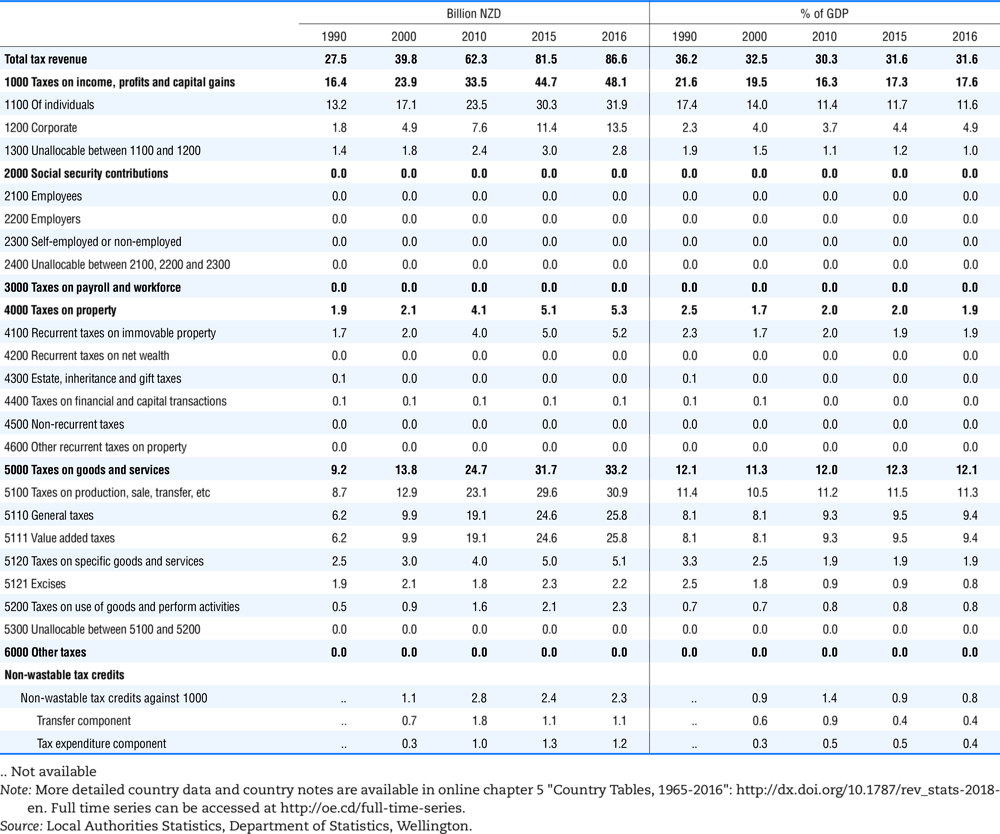
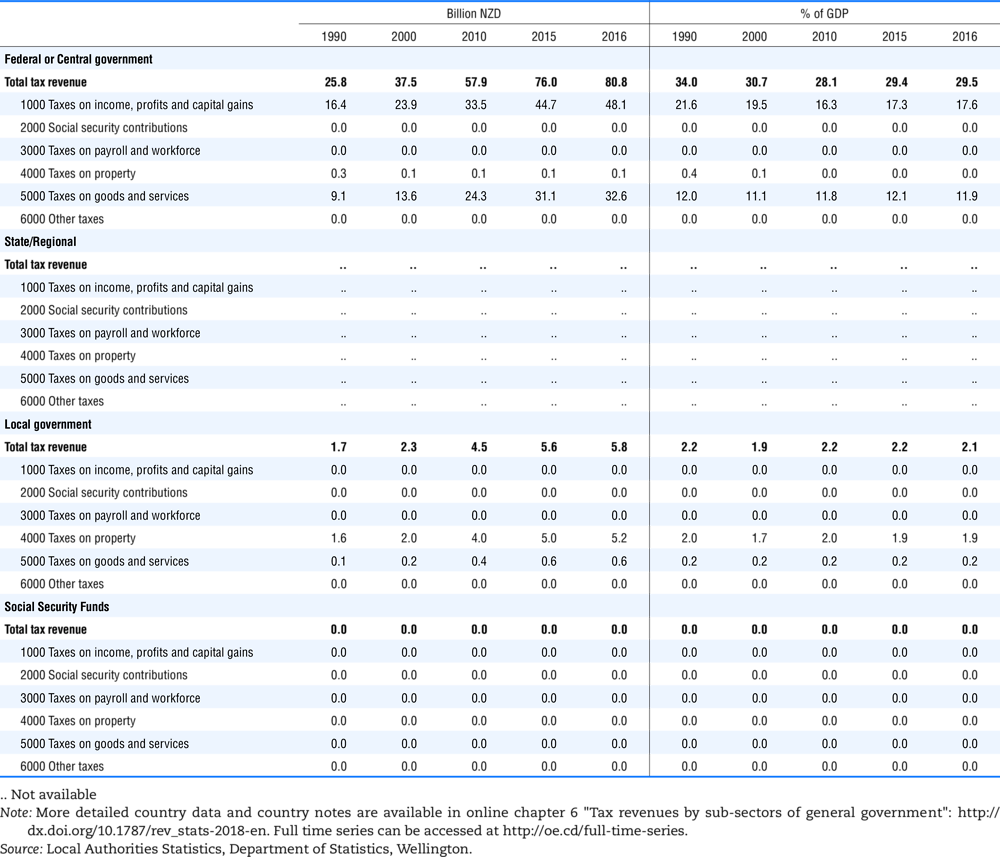
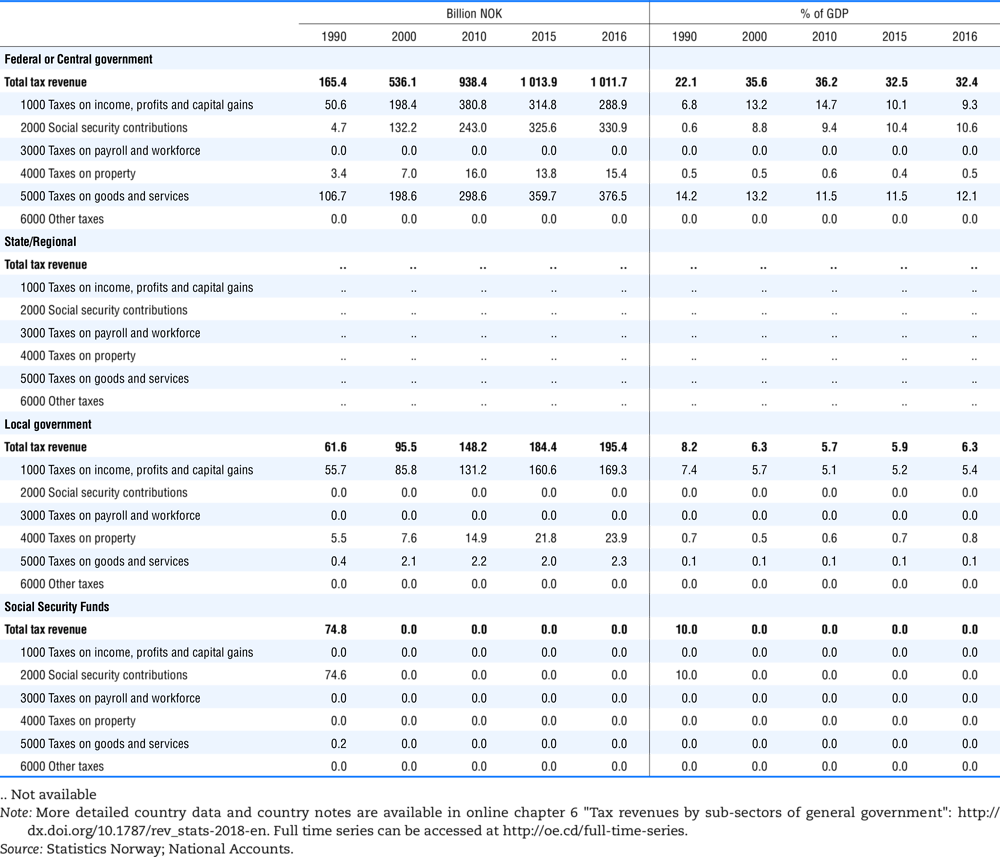
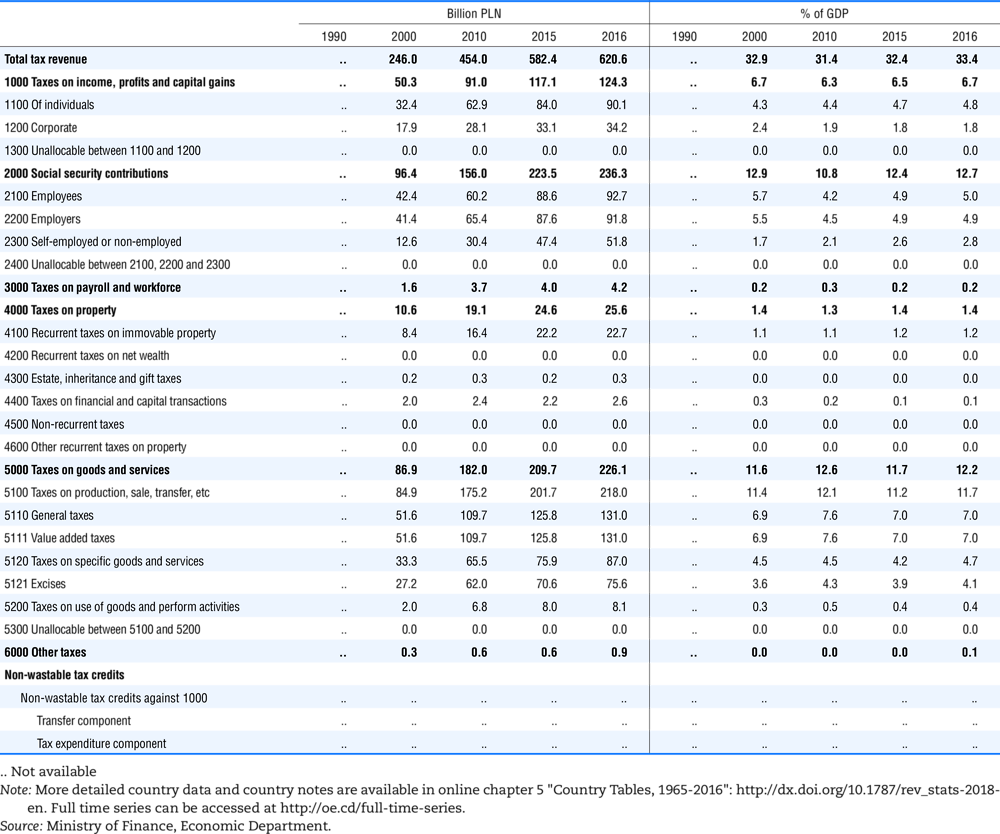
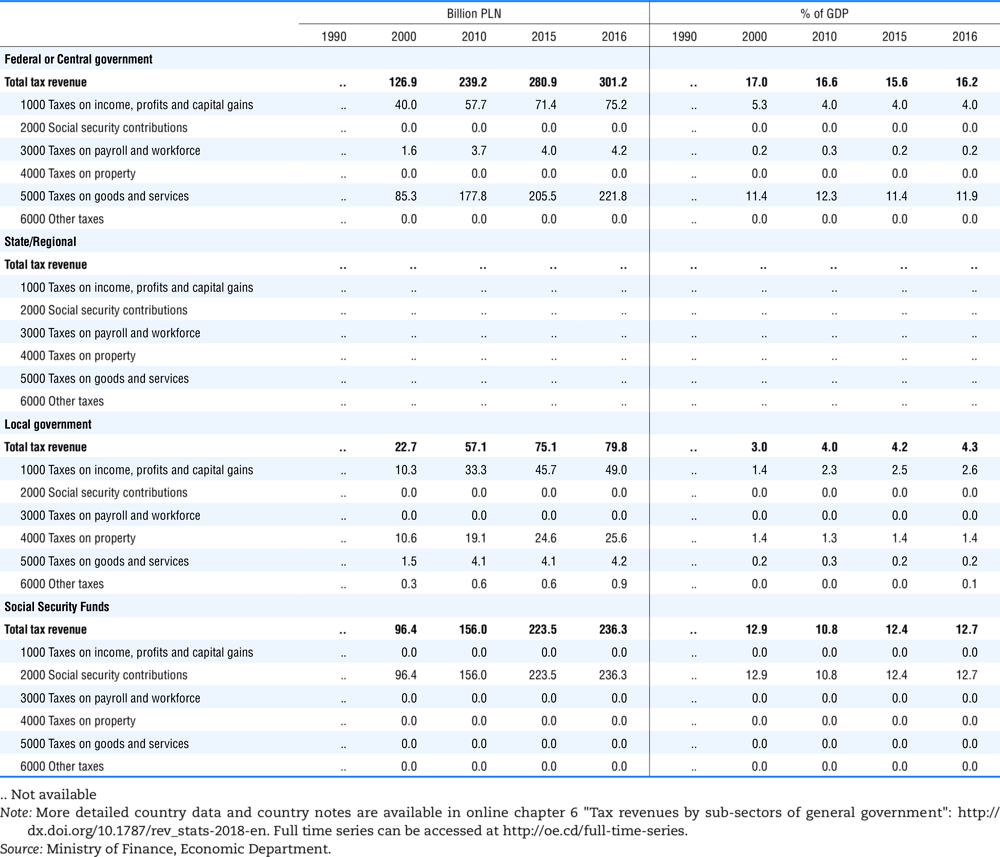
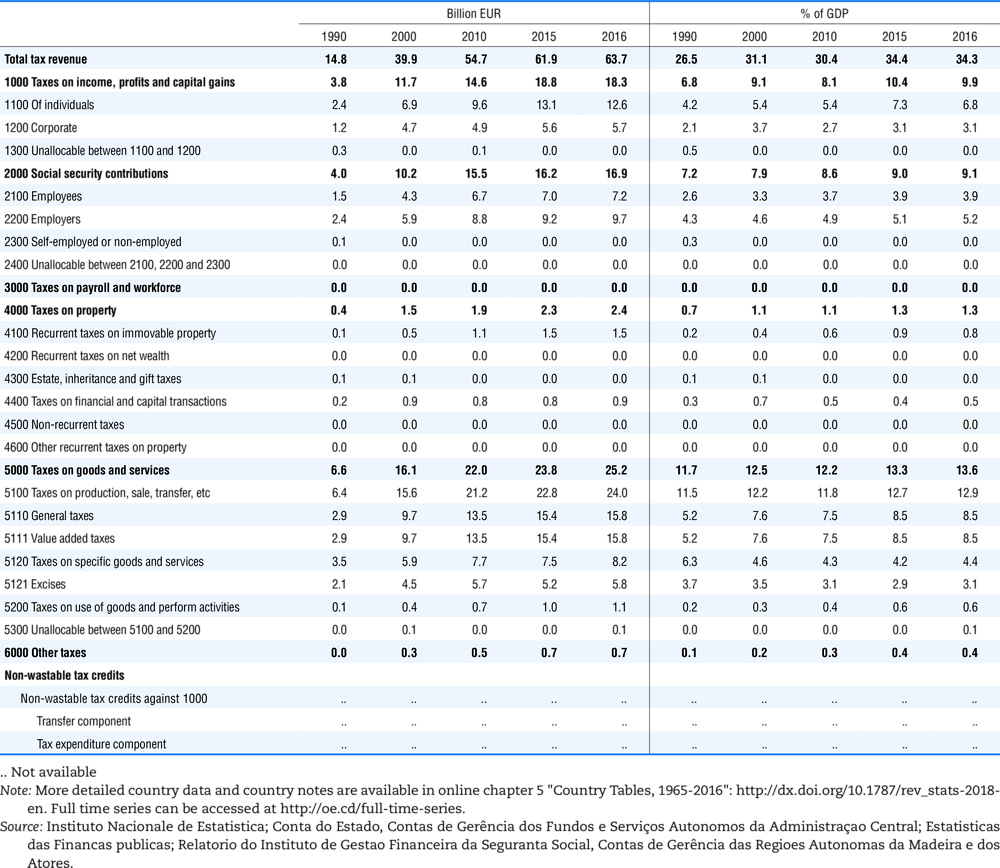
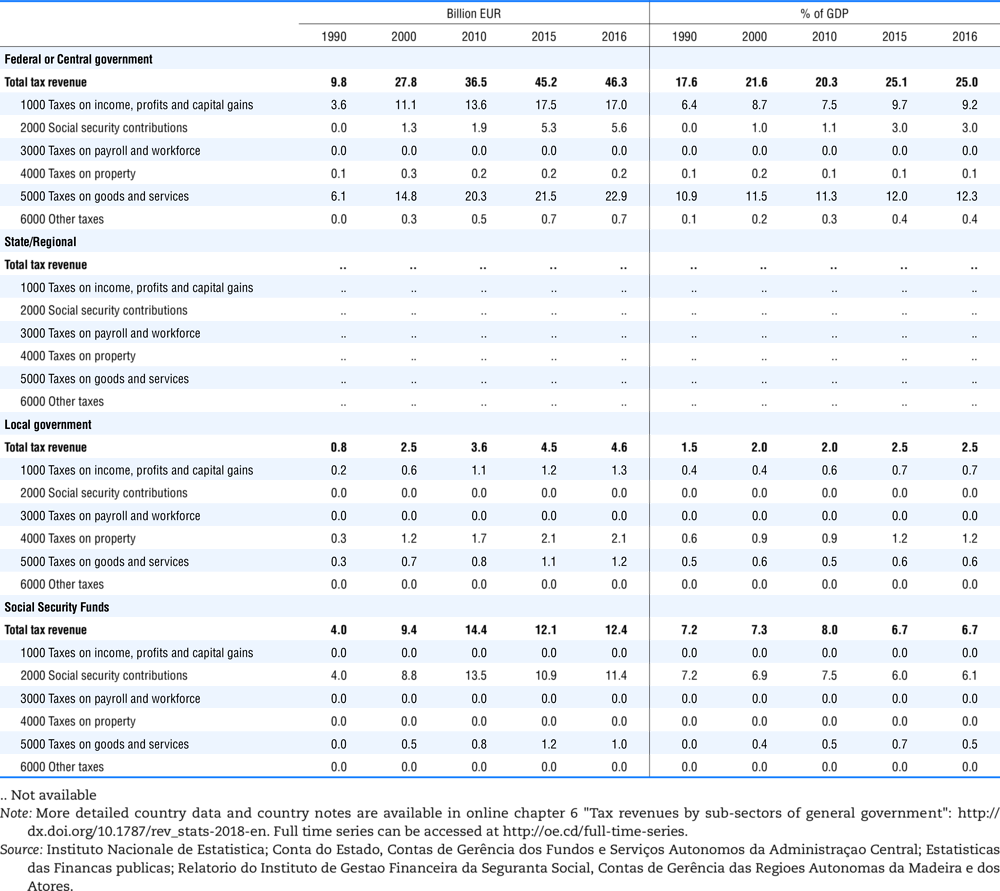
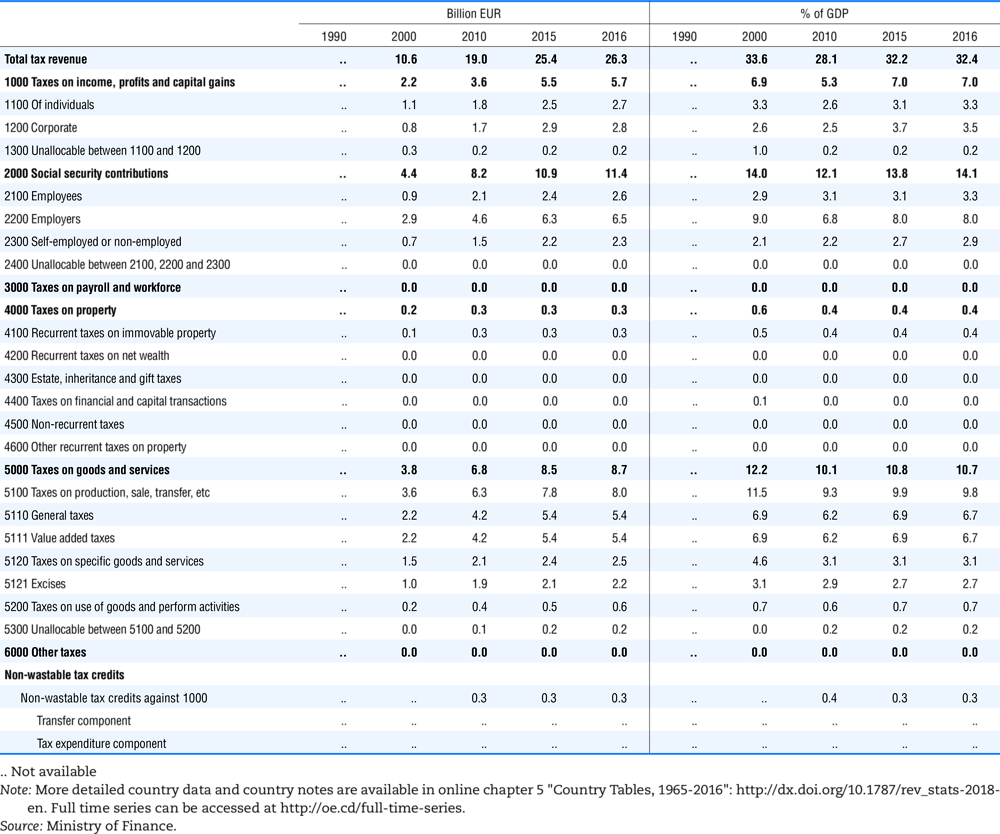
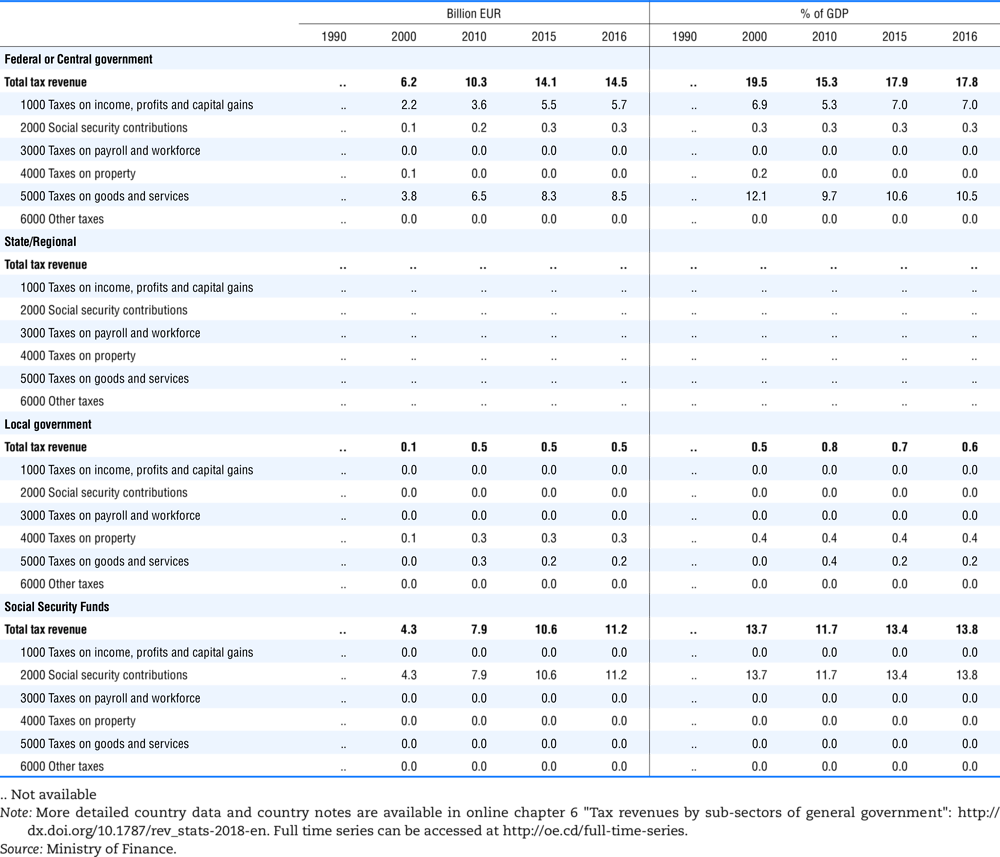
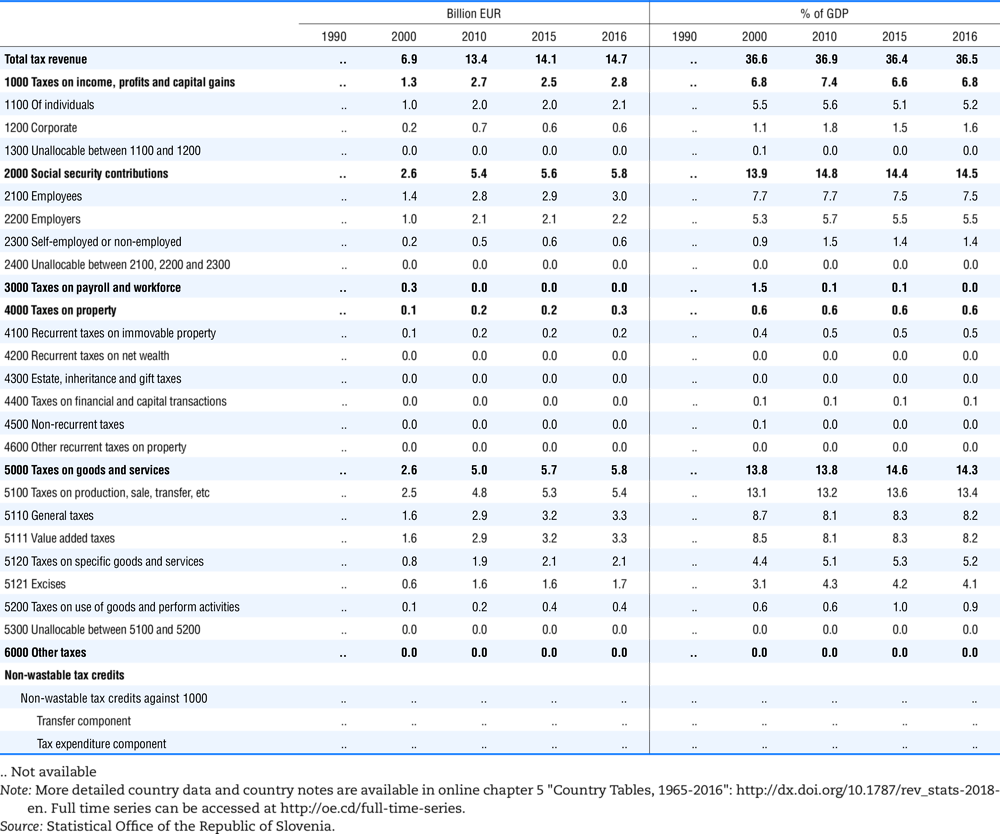
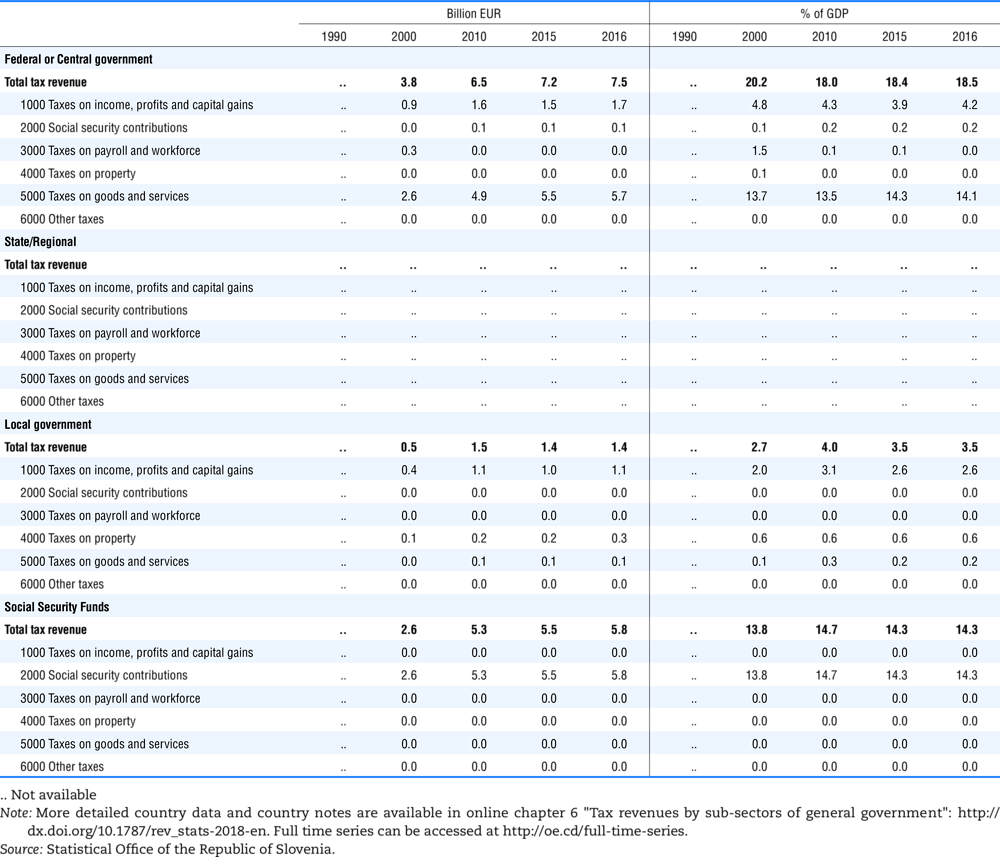
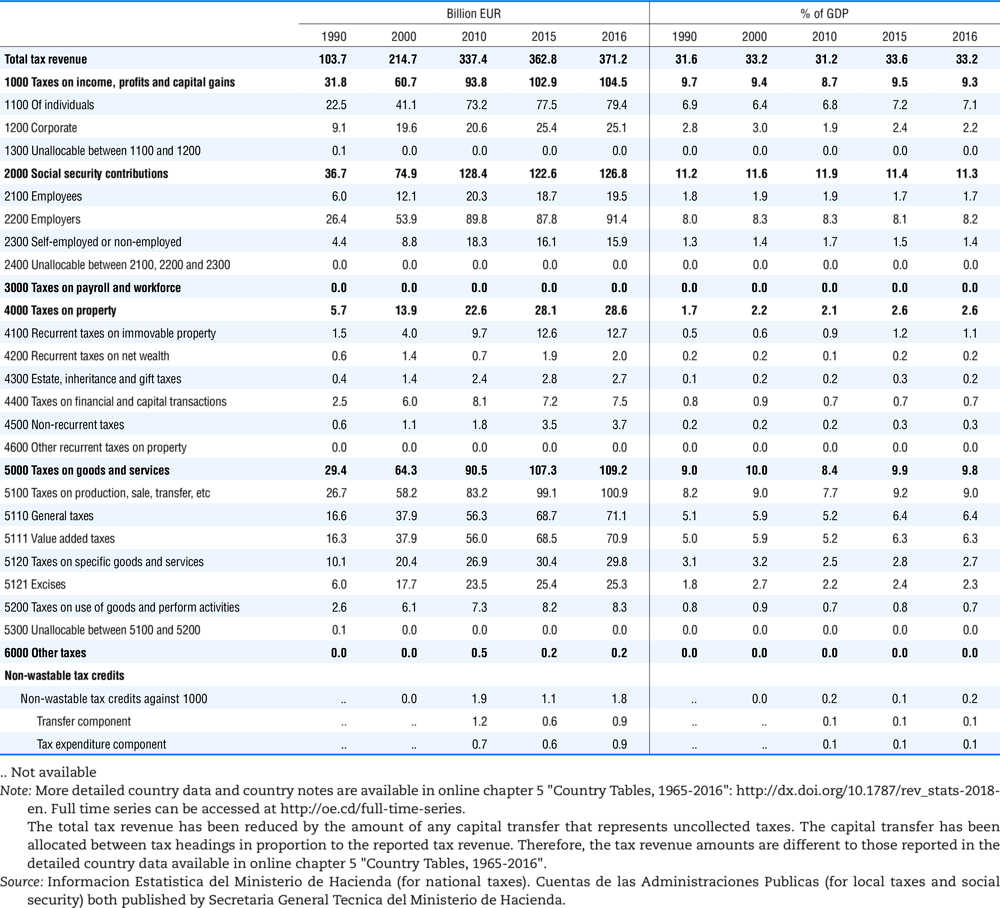
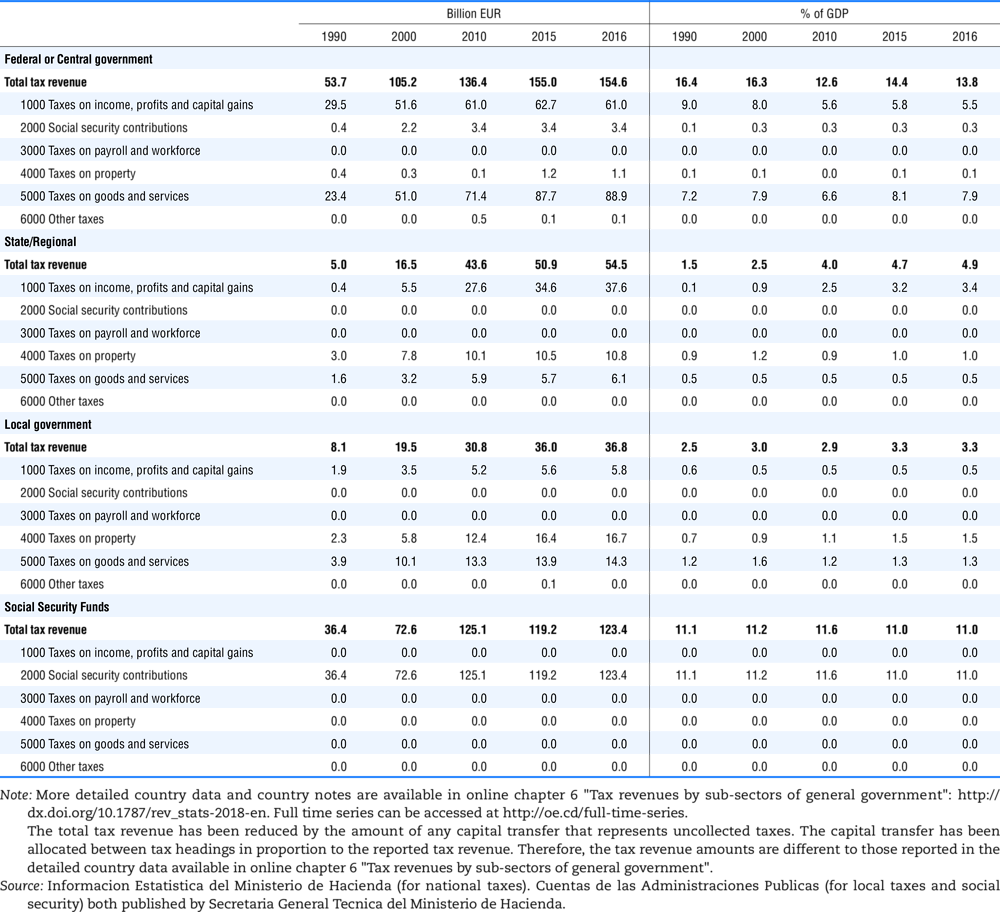
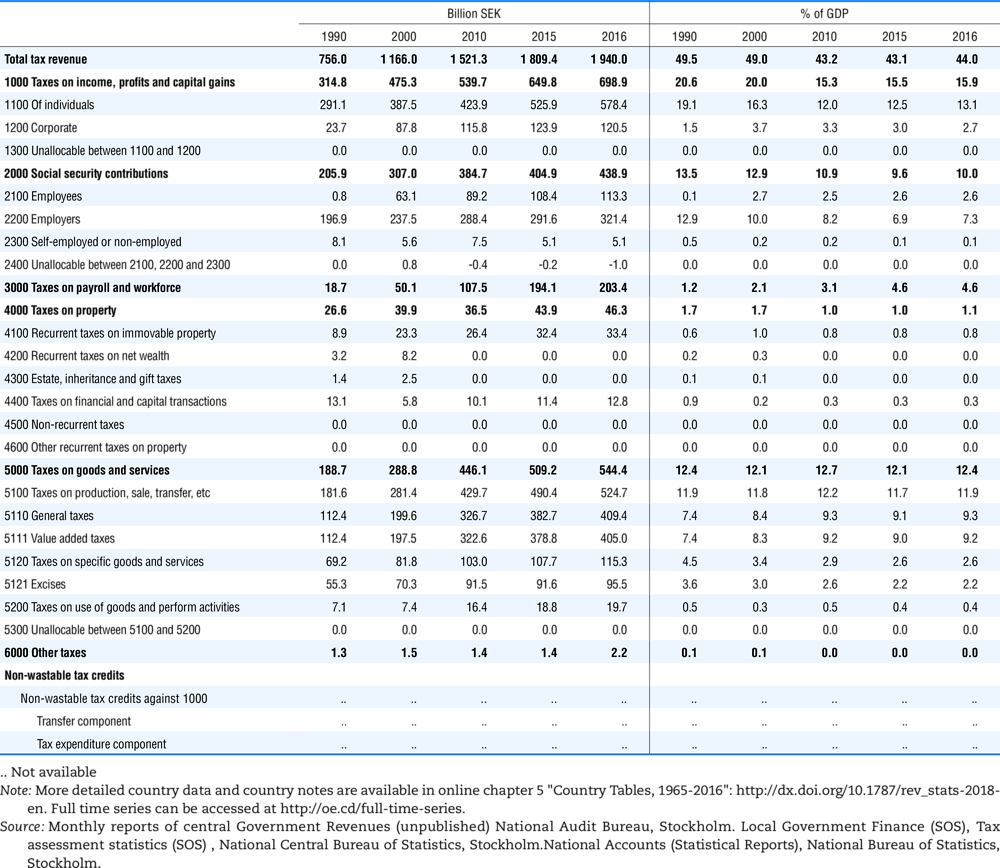
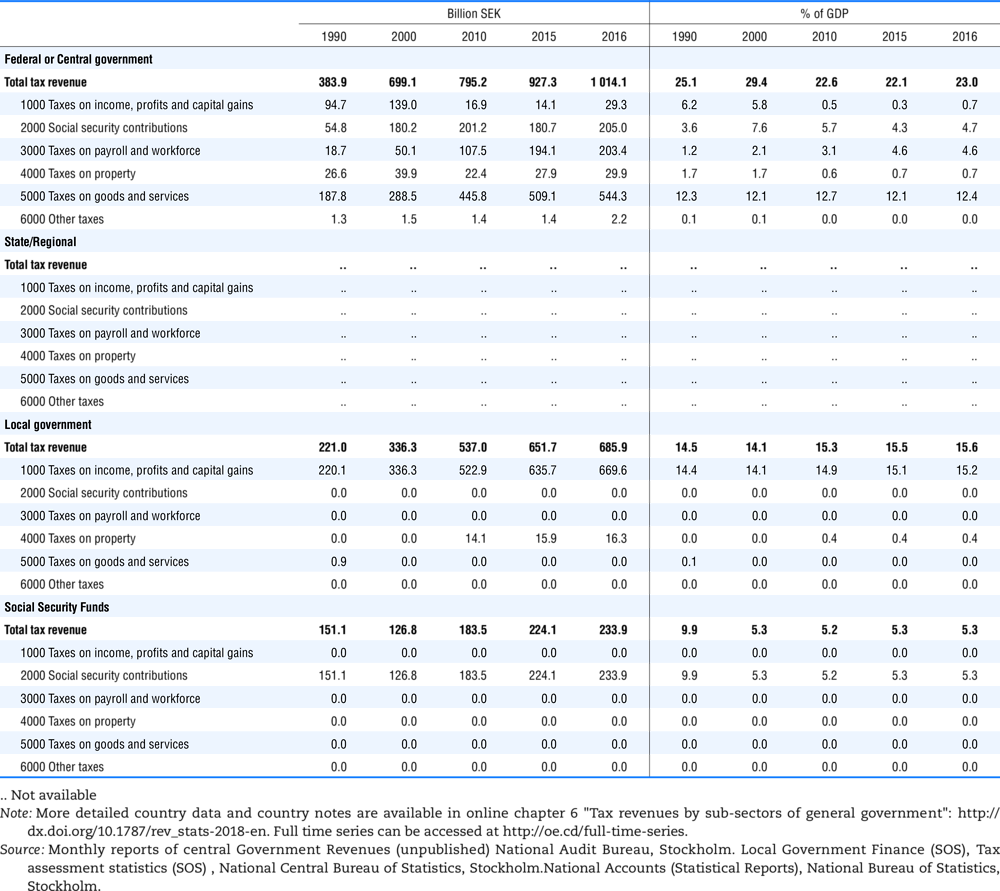
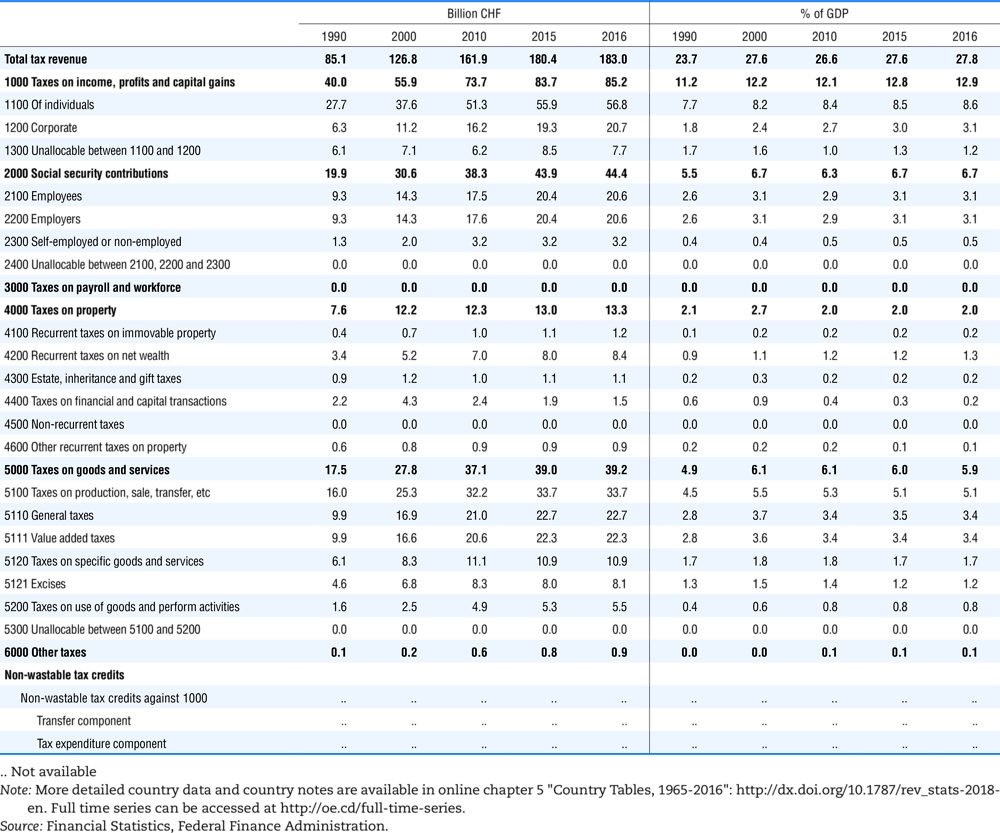
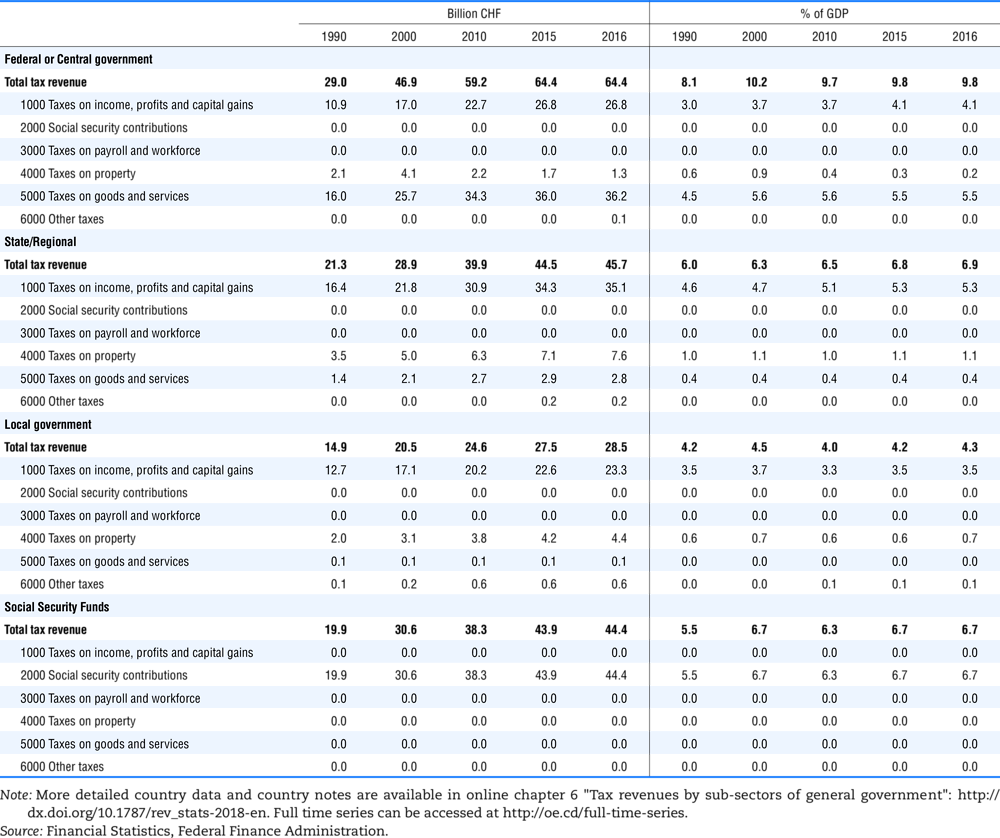
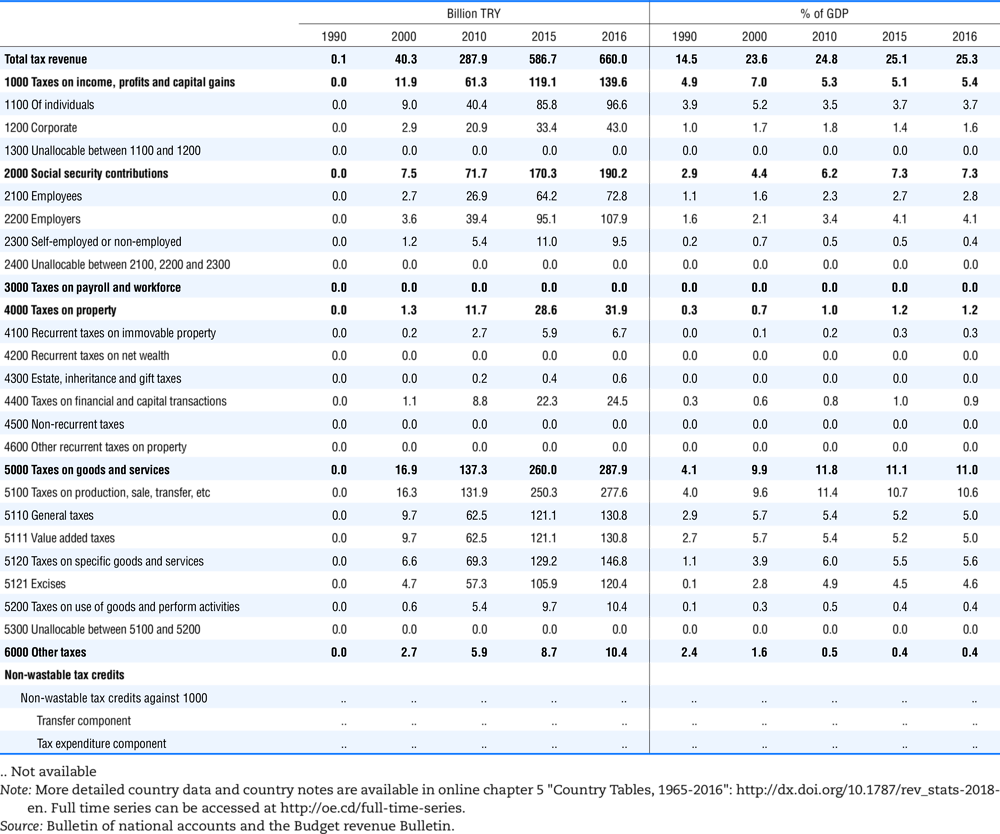
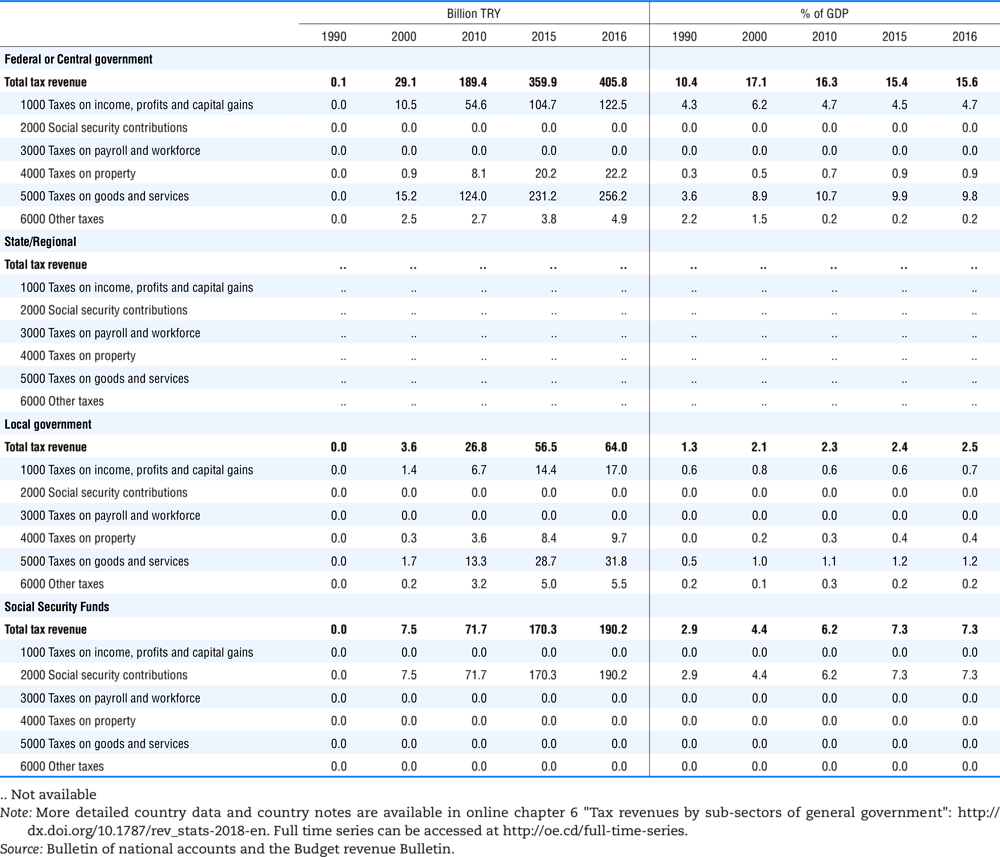
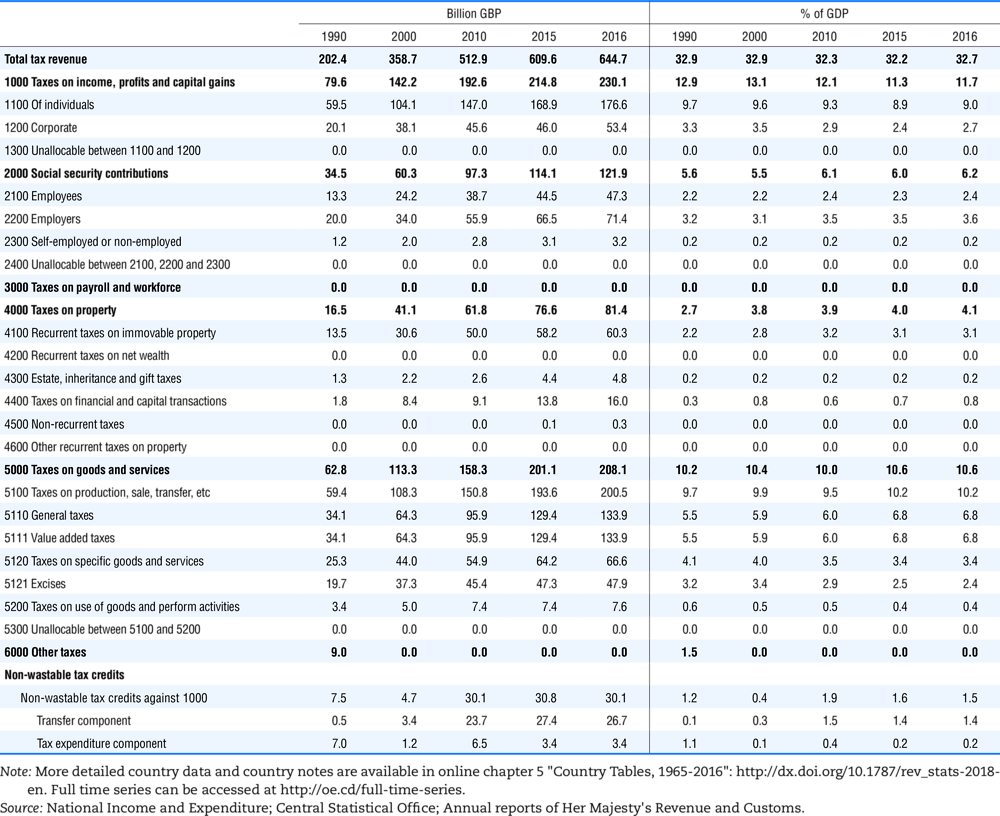
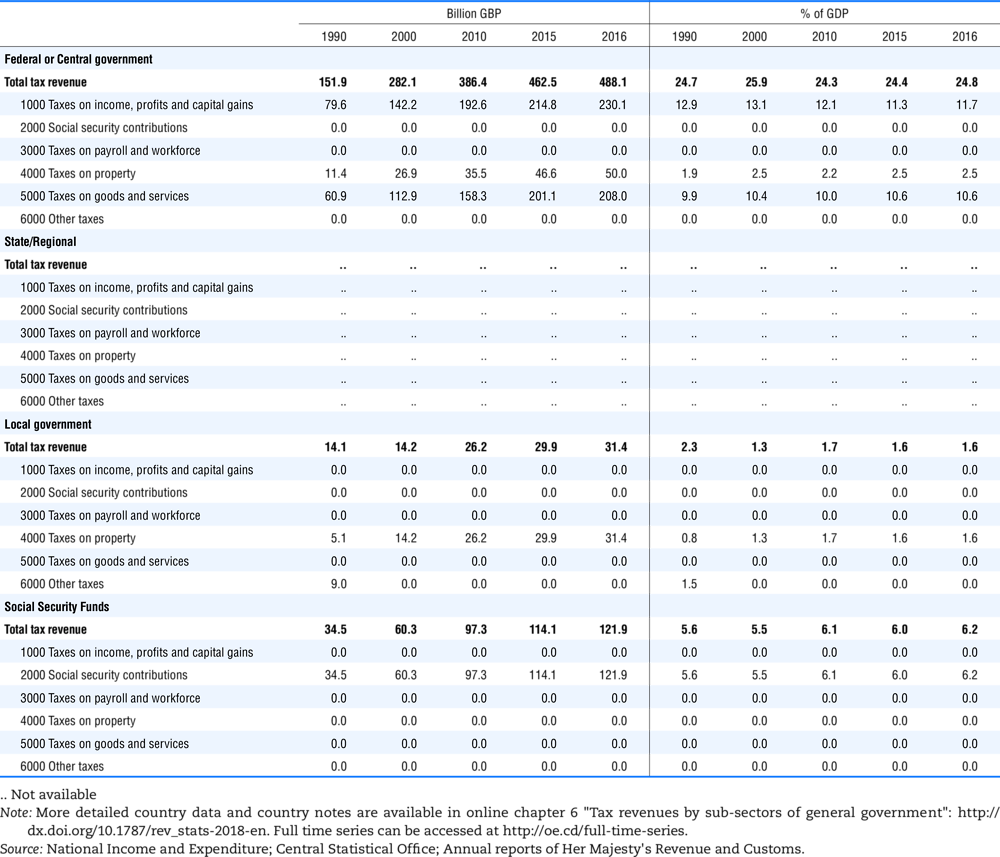
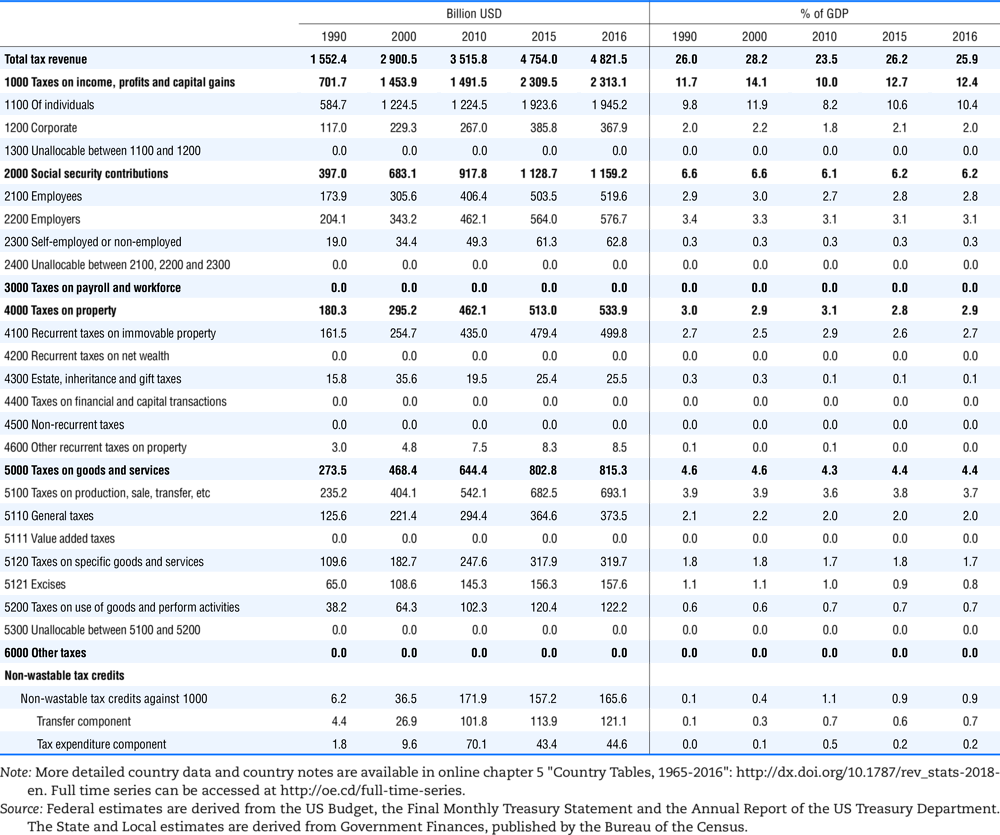
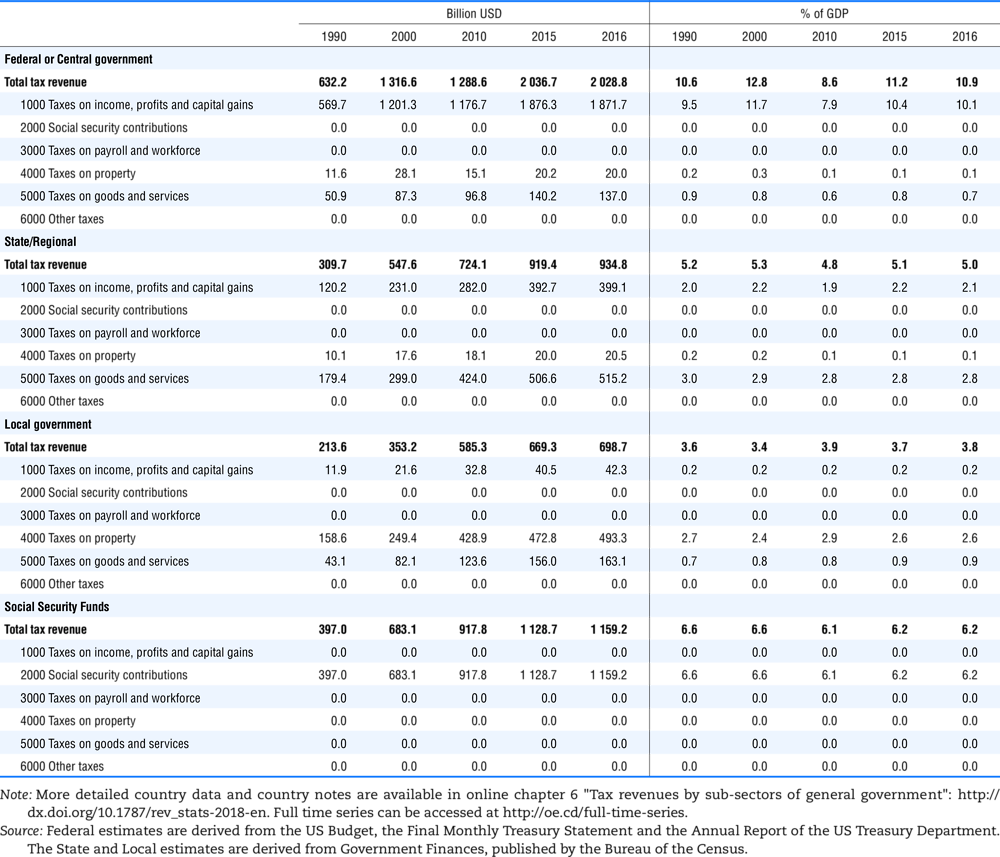
4.1. Tax revenue and % of GDP by selected tax category and by level of government

In all of the following tables the symbol (…) indicates not available/or not applicable. The main series in this chapter cover the years 1990 to 2016. Figures referring to 1965-1989, 1991-1999, 2001-2009 and 2011-2014 have been omitted because of lack of space. A complete series is, however, available on line. Data for 1955 and 1960 (for nineteen OECD countries) are provided in part V of the 1998 edition of this Report.

The Gross Domestic Product (GDP) figures are based on the 2008 System of National Accounts (SNA) for all OECD countries.

Box 4.1. Treatment of capital transfers

Some tables refer to the treatment of the capital transfers that some countries make to account for taxes that have been assessed but not collected. The capital transfer has been subtracted from the total tax revenue and this reduction has been allocated between tax headings in proportion to their tax revenues.

This applies to the following countries:

  • Denmark from 1971.

  • France from 1992.

  • Greece for 1999 and 2000.

  • Lithuania from 1999.

  • Spain from 1995.

Table 4.1. Australia, tax revenue and % of GDP by selected tax category
Australia, tax revenue and % of GDP by selected tax category

 StatLink https://doi.org/10.1787/888933859703

Table 4.2. Australia, tax revenue and % of GDP by level of government and main taxes
Australia, tax revenue and % of GDP by level of government and main taxes

 StatLink https://doi.org/10.1787/888933859722

Table 4.3. Austria, tax revenue and % of GDP by selected tax category
Austria, tax revenue and % of GDP by selected tax category

 StatLink https://doi.org/10.1787/888933859741

Table 4.4. Austria, tax revenue and % of GDP by level of government and main taxes
Austria, tax revenue and % of GDP by level of government and main taxes

 StatLink https://doi.org/10.1787/888933859760

Table 4.5. Belgium, tax revenue and % of GDP by selected tax category
Belgium, tax revenue and % of GDP by selected tax category

 StatLink https://doi.org/10.1787/888933859779

Table 4.6. Belgium, tax revenue and % of GDP by level of government and main taxes
Belgium, tax revenue and % of GDP by level of government and main taxes

 StatLink https://doi.org/10.1787/888933859798

Table 4.7. Canada, tax revenue and % of GDP by selected tax category
Canada, tax revenue and % of GDP by selected tax category

 StatLink https://doi.org/10.1787/888933859817

Table 4.8. Canada, tax revenue and % of GDP by level of government and main taxes
Canada, tax revenue and % of GDP by level of government and main taxes

 StatLink https://doi.org/10.1787/888933859836

Table 4.9. Chile, tax revenue and % of GDP by selected tax category
Chile, tax revenue and % of GDP by selected tax category

 StatLink https://doi.org/10.1787/888933859855

Table 4.10. Chile, tax revenue and % of GDP by level of government and main taxes
Chile, tax revenue and % of GDP by level of government and main taxes

 StatLink https://doi.org/10.1787/888933859874

Table 4.11. Czech Republic, tax revenue and % of GDP by selected tax category
Czech Republic, tax revenue and % of GDP by selected tax category

 StatLink https://doi.org/10.1787/888933859893

Table 4.12. Czech Republic, tax revenue and % of GDP by level of government and main taxes
Czech Republic, tax revenue and % of GDP by level of government and main taxes

 StatLink https://doi.org/10.1787/888933859912

Table 4.13. Denmark, tax revenue and % of GDP by selected tax category
Denmark, tax revenue and % of GDP by selected tax category

 StatLink https://doi.org/10.1787/888933859931

Table 4.14. Denmark, tax revenue and % of GDP by level of government and main taxes
Denmark, tax revenue and % of GDP by level of government and main taxes

 StatLink https://doi.org/10.1787/888933859950

Table 4.15. Estonia, tax revenue and % of GDP by selected tax category
Estonia, tax revenue and % of GDP by selected tax category

 StatLink https://doi.org/10.1787/888933859969

Table 4.16. Estonia, tax revenue and % of GDP by level of government and main taxes
Estonia, tax revenue and % of GDP by level of government and main taxes

 StatLink https://doi.org/10.1787/888933859988

Table 4.17. Finland, tax revenue and % of GDP by selected tax category
Finland, tax revenue and % of GDP by selected tax category

 StatLink https://doi.org/10.1787/888933860007

Table 4.18. Finland, tax revenue and % of GDP by level of government and main taxes
Finland, tax revenue and % of GDP by level of government and main taxes

 StatLink https://doi.org/10.1787/888933860026

Table 4.19. France, tax revenue and % of GDP by selected tax category
France, tax revenue and % of GDP by selected tax category

 StatLink https://doi.org/10.1787/888933860045

Table 4.20. France, tax revenue and % of GDP by level of government and main taxes
France, tax revenue and % of GDP by level of government and main taxes

 StatLink https://doi.org/10.1787/888933860064

Table 4.21. Germany, tax revenue and % of GDP by selected tax category
Germany, tax revenue and % of GDP by selected tax category

 StatLink https://doi.org/10.1787/888933860083

Table 4.22. Germany, tax revenue and % of GDP by level of government and main taxes
Germany, tax revenue and % of GDP by level of government and main taxes

 StatLink https://doi.org/10.1787/888933860102

Table 4.23. Greece, tax revenue and % of GDP by selected tax category
Greece, tax revenue and % of GDP by selected tax category

 StatLink https://doi.org/10.1787/888933860121

Table 4.24. Greece, tax revenue and % of GDP by level of government and main taxes
Greece, tax revenue and % of GDP by level of government and main taxes

 StatLink https://doi.org/10.1787/888933860140

Table 4.25. Hungary, tax revenue and % of GDP by selected tax category
Hungary, tax revenue and % of GDP by selected tax category

 StatLink https://doi.org/10.1787/888933860159

Table 4.26. Hungary, tax revenue and % of GDP by level of government and main taxes
Hungary, tax revenue and % of GDP by level of government and main taxes

 StatLink https://doi.org/10.1787/888933860178

Table 4.27. Iceland, tax revenue and % of GDP by selected tax category
Iceland, tax revenue and % of GDP by selected tax category

 StatLink https://doi.org/10.1787/888933860197

Table 4.28. Iceland, tax revenue and % of GDP by level of government and main taxes
Iceland, tax revenue and % of GDP by level of government and main taxes

 StatLink https://doi.org/10.1787/888933860216

Table 4.29. Ireland, tax revenue and % of GDP by selected tax category
Ireland, tax revenue and % of GDP by selected tax category

 StatLink https://doi.org/10.1787/888933860235

Table 4.30. Ireland, tax revenue and % of GDP by level of government and main taxes
Ireland, tax revenue and % of GDP by level of government and main taxes

 StatLink https://doi.org/10.1787/888933860254

Table 4.31. Israel, tax revenue and % of GDP by selected tax category
Israel, tax revenue and % of GDP by selected tax category

 StatLink https://doi.org/10.1787/888933860273

Table 4.32. Israel, tax revenue and % of GDP by level of government and main taxes
Israel, tax revenue and % of GDP by level of government and main taxes

 StatLink https://doi.org/10.1787/888933860292

Table 4.33. Italy, tax revenue and % of GDP by selected tax category
Italy, tax revenue and % of GDP by selected tax category

 StatLink https://doi.org/10.1787/888933860311

Table 4.34. Italy, tax revenue and % of GDP by level of government and main taxes
Italy, tax revenue and % of GDP by level of government and main taxes

 StatLink https://doi.org/10.1787/888933860330

Table 4.35. Japan, tax revenue and % of GDP by selected tax category
Japan, tax revenue and % of GDP by selected tax category

 StatLink https://doi.org/10.1787/888933860349

Table 4.36. Japan, tax revenue and % of GDP by level of government and main taxes
Japan, tax revenue and % of GDP by level of government and main taxes

 StatLink https://doi.org/10.1787/888933860368

Table 4.37. Korea, tax revenue and % of GDP by selected tax category
Korea, tax revenue and % of GDP by selected tax category

 StatLink https://doi.org/10.1787/888933860387

Table 4.38. Korea, tax revenue and % of GDP by level of government and main taxes
Korea, tax revenue and % of GDP by level of government and main taxes

 StatLink https://doi.org/10.1787/888933860406

Table 4.39. Latvia, tax revenue and % of GDP by selected tax category
Latvia, tax revenue and % of GDP by selected tax category

 StatLink https://doi.org/10.1787/888933860425

Table 4.40. Latvia, tax revenue and % of GDP by level of government and main taxes
Latvia, tax revenue and % of GDP by level of government and main taxes

 StatLink https://doi.org/10.1787/888933860444

Table 4.41. Lithuania, tax revenue and % of GDP by selected tax category
Lithuania, tax revenue and % of GDP by selected tax category

 StatLink https://doi.org/10.1787/888933860463

Table 4.42. Lithuania, tax revenue and % of GDP by level of government and main taxes
Lithuania, tax revenue and % of GDP by level of government and main taxes

 StatLink https://doi.org/10.1787/888933860482

Table 4.43. Luxembourg, tax revenue and % of GDP by selected tax category
Luxembourg, tax revenue and % of GDP by selected tax category

 StatLink https://doi.org/10.1787/888933860501

Table 4.44. Luxembourg, tax revenue and % of GDP by level of government and main taxes
Luxembourg, tax revenue and % of GDP by level of government and main taxes

 StatLink https://doi.org/10.1787/888933860520

Table 4.45. Mexico, tax revenue and % of GDP by selected tax category
Mexico, tax revenue and % of GDP by selected tax category

 StatLink https://doi.org/10.1787/888933860539

Table 4.46. Mexico, tax revenue and % of GDP by level of government and main taxes
Mexico, tax revenue and % of GDP by level of government and main taxes

 StatLink https://doi.org/10.1787/888933860558

Table 4.47. Netherlands, tax revenue and % of GDP by selected tax category
Netherlands, tax revenue and % of GDP by selected tax category

 StatLink https://doi.org/10.1787/888933860577

Table 4.48. Netherlands, tax revenue and % of GDP by level of government and main taxes
Netherlands, tax revenue and % of GDP by level of government and main taxes

 StatLink https://doi.org/10.1787/888933860596

Table 4.49. New Zealand, tax revenue and % of GDP by selected tax category
New Zealand, tax revenue and % of GDP by selected tax category

 StatLink https://doi.org/10.1787/888933860615

Table 4.50. New Zealand, tax revenue and % of GDP by level of government and main taxes
New Zealand, tax revenue and % of GDP by level of government and main taxes

 StatLink https://doi.org/10.1787/888933860634

Table 4.51. Norway, tax revenue and % of GDP by selected tax category
Norway, tax revenue and % of GDP by selected tax category

 StatLink https://doi.org/10.1787/888933860653

Table 4.52. Norway, tax revenue and % of GDP by level of government and main taxes
Norway, tax revenue and % of GDP by level of government and main taxes

 StatLink https://doi.org/10.1787/888933860672

Table 4.53. Poland, tax revenue and % of GDP by selected tax category
Poland, tax revenue and % of GDP by selected tax category

 StatLink https://doi.org/10.1787/888933860691

Table 4.54. Poland, tax revenue and % of GDP by level of government and main taxes
Poland, tax revenue and % of GDP by level of government and main taxes

 StatLink https://doi.org/10.1787/888933860710

Table 4.55. Portugal, tax revenue and % of GDP by selected tax category
Portugal, tax revenue and % of GDP by selected tax category

 StatLink https://doi.org/10.1787/888933860729

Table 4.56. Portugal, tax revenue and % of GDP by level of government and main taxes
Portugal, tax revenue and % of GDP by level of government and main taxes

 StatLink https://doi.org/10.1787/888933860748

Table 4.57. Slovak Republic, tax revenue and % of GDP by selected tax category
Slovak Republic, tax revenue and % of GDP by selected tax category

 StatLink https://doi.org/10.1787/888933860767

Table 4.58. Slovak Republic, tax revenue and % of GDP by level of government and main taxes
Slovak Republic, tax revenue and % of GDP by level of government and main taxes

 StatLink https://doi.org/10.1787/888933860786

Table 4.59. Slovenia, tax revenue and % of GDP by selected tax category
Slovenia, tax revenue and % of GDP by selected tax category

 StatLink https://doi.org/10.1787/888933860805

Table 4.60. Slovenia, tax revenue and % of GDP by level of government and main taxes
Slovenia, tax revenue and % of GDP by level of government and main taxes

 StatLink https://doi.org/10.1787/888933860824

Table 4.61. Spain, tax revenue and % of GDP by selected tax category
Spain, tax revenue and % of GDP by selected tax category

 StatLink https://doi.org/10.1787/888933860843

Table 4.62. Spain, tax revenue and % of GDP by level of government and main taxes
Spain, tax revenue and % of GDP by level of government and main taxes

 StatLink https://doi.org/10.1787/888933860862

Table 4.63. Sweden, tax revenue and % of GDP by selected tax category
Sweden, tax revenue and % of GDP by selected tax category

 StatLink https://doi.org/10.1787/888933860881

Table 4.64. Sweden, tax revenue and % of GDP by level of government and main taxes
Sweden, tax revenue and % of GDP by level of government and main taxes

 StatLink https://doi.org/10.1787/888933860900

Table 4.65. Switzerland, tax revenue and % of GDP by selected tax category
Switzerland, tax revenue and % of GDP by selected tax category

 StatLink https://doi.org/10.1787/888933860919

Table 4.66. Switzerland, tax revenue and % of GDP by level of government and main taxes
Switzerland, tax revenue and % of GDP by level of government and main taxes

 StatLink https://doi.org/10.1787/888933860938

Table 4.67. Turkey, tax revenue and % of GDP by selected tax category
Turkey, tax revenue and % of GDP by selected tax category

 StatLink https://doi.org/10.1787/888933860957

Table 4.68. Turkey, tax revenue and % of GDP by level of government and main taxes
Turkey, tax revenue and % of GDP by level of government and main taxes

 StatLink https://doi.org/10.1787/888933860976

Table 4.69. United Kingdom, tax revenue and % of GDP by selected tax category
United Kingdom, tax revenue and % of GDP by selected tax category

 StatLink https://doi.org/10.1787/888933860995

Table 4.70. United Kingdom, tax revenue and % of GDP by level of government and main taxes
United Kingdom, tax revenue and % of GDP by level of government and main taxes

 StatLink https://doi.org/10.1787/888933861014

Table 4.71. United States, tax revenue and % of GDP by selected tax category
United States, tax revenue and % of GDP by selected tax category

 StatLink https://doi.org/10.1787/888933861033

Table 4.72. United States, tax revenue and % of GDP by level of government and main taxes
United States, tax revenue and % of GDP by level of government and main taxes

 StatLink https://doi.org/10.1787/888933861052

4.2. Memorandum tables

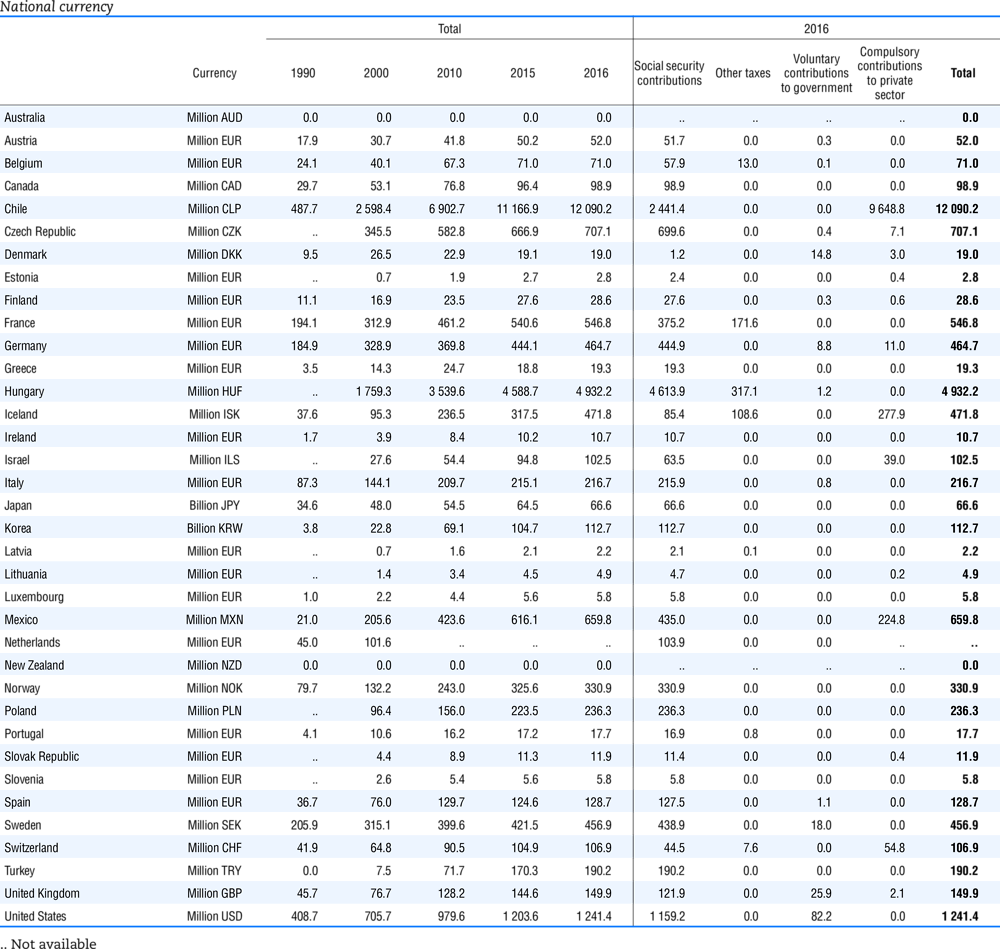
Table 4.73 shows different sources for financing social benefits, beyond compulsory social security contributions reported in section 4.1. In addition, this table shows also data on other taxes, on voluntary contributions to government and on compulsory contributions to private sector.

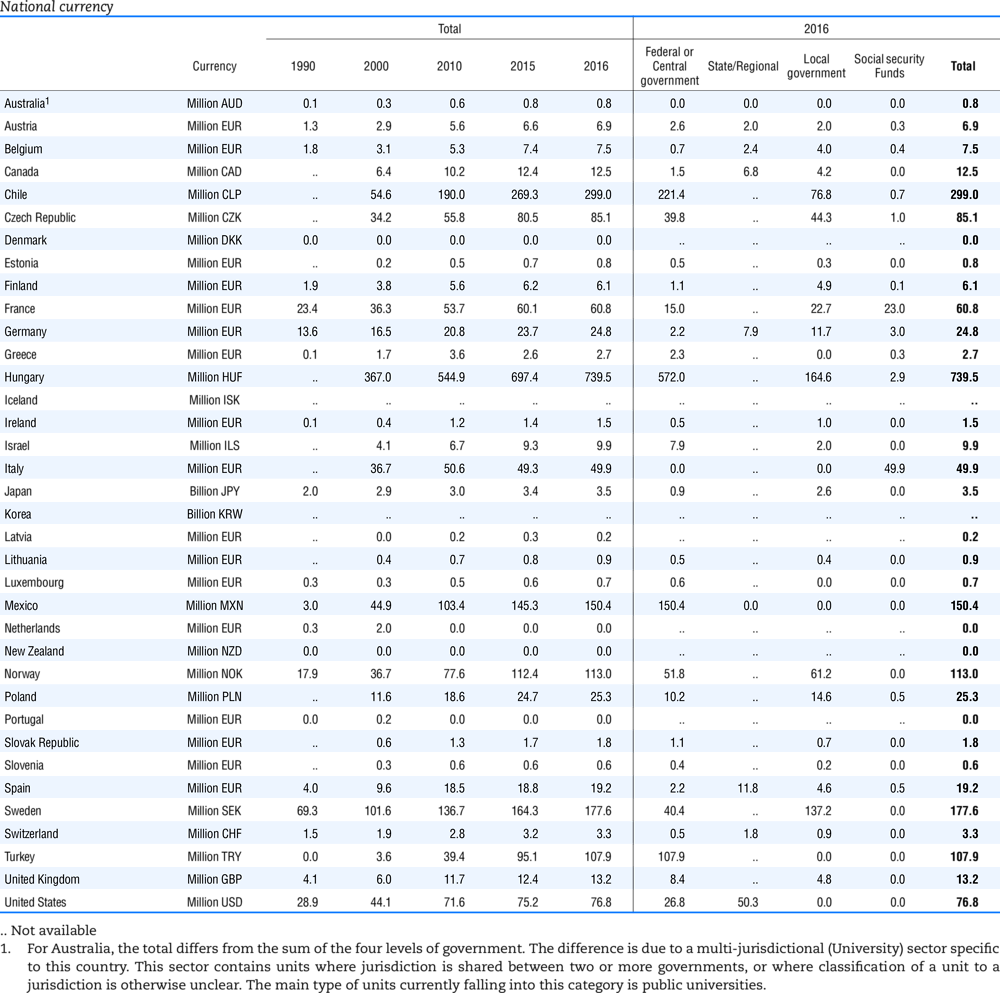
Table 4.74 shows social security contributions and payroll taxes paid by government. During the revision of the Interpretative Guide in 1984, the question arose of how to treat taxes paid by government. The two most prominent examples of such taxes are social security contributions and payroll taxes paid by government in respect of its employees. After a long discussion it was decided that the data shown in this publication should continue to include taxes paid by government (see §5 of the Interpretative Guide in annex A).

Whilst it was recognised that for certain purposes (e.g. to show the cash flow to the government sector from the private sector) it would be appropriate to eliminate taxes paid by one sector of government to another or tax payments between different units of the same sector of government, the view was taken that to record tax flows in the context of the economy as a whole required that taxes paid by government should be included in the data. This treatment ensures that the different resource flows of an economy, including the calculation of the output of government, are measured consistently in after-tax units. Nevertheless, it was decided that data on identifiable taxes paid by government should be separately identified in a memorandum item and this is the purpose of the country tables which follow.

The data that are reproduced in the following tables refer to actual compulsory payments made by general government in respect of their employees. Fictive, voluntary and imputed contributions are excluded from these data. The definitions of social security contributions, payroll taxes and general government are those set out in §35 to §41, §42 and §3 to §4 of the Interpretative Guide. Information on the other taxes paid by government (namely property taxes and consumption taxes) is not available in most countries, although it is believed that in all countries taxes based upon payroll are the most important taxes paid by government. In many cases, the data are estimates and are not always constructed on a basis consistent with that used in the main tables.

Table 4.73. Financing of social security benefits
Financing of social security benefits

 StatLink https://doi.org/10.1787/888933861071

Table 4.74. Social security contributions and payroll taxes paid by government
Social security contributions and payroll taxes paid by government

 StatLink https://doi.org/10.1787/888933861090

End of the section – Back to iLibrary publication page