Chapter 3. Tax Levels and Tax Structures, 1965-2017

Chapter 3 provides an overview of tax levels and tax structures in OECD countries from 1965-2017.


In all of the following tables the symbol (…) indicates not available/or not applicable. The main series in this chapter cover the years 1965 to 2016. A selection of years are shown in this chapter because of lack of space. The complete series is available on line. Data for 1955 and 1960 (for nineteen OECD countries) are provided in part V of the 1998 edition of this Report.

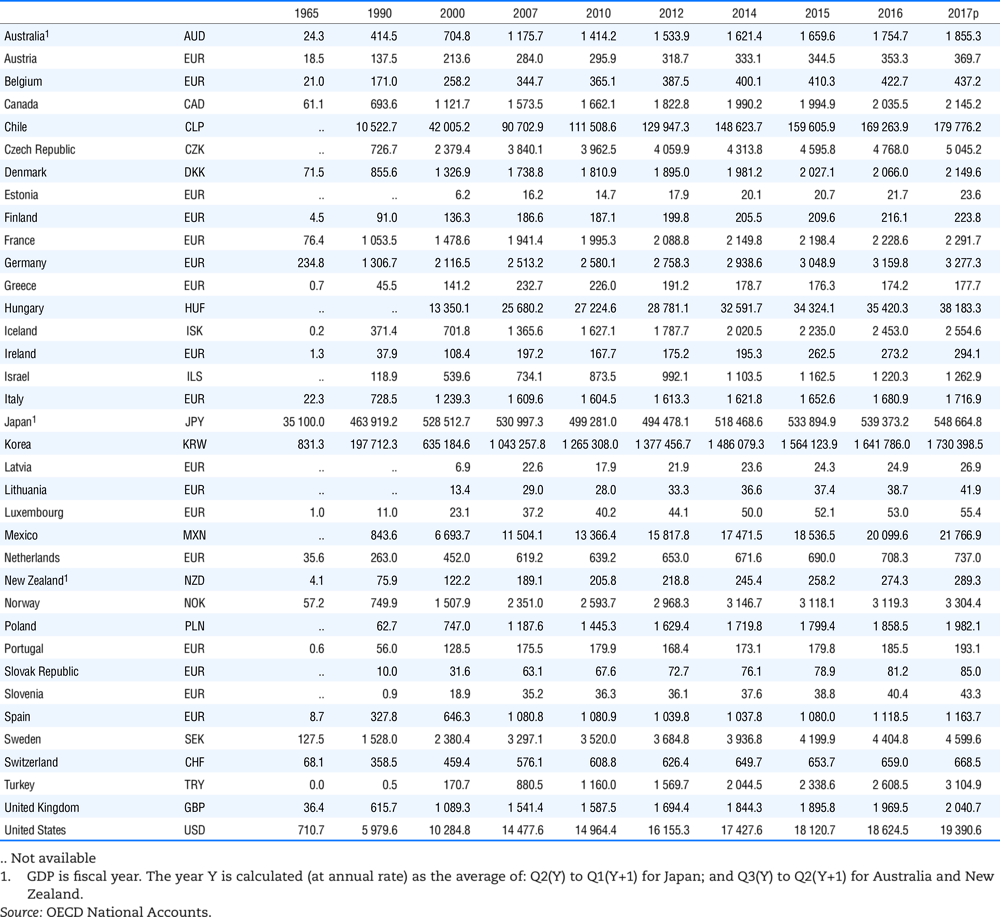
The Gross Domestic Product (GDP) figures are based on the 2008 System of National Accounts (SNA) for all OECD countries.

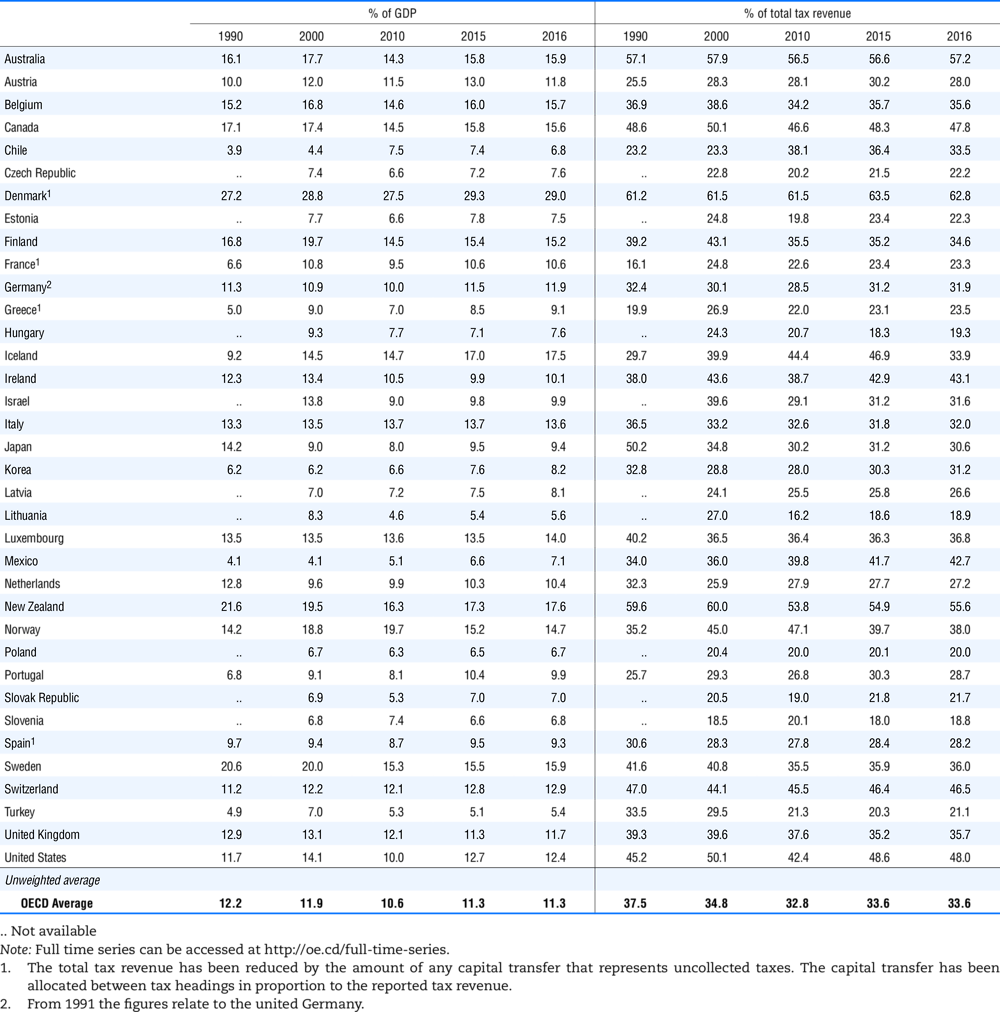
In this chapter, the OECD average for 2016 in all tables has been calculated excluding the one-off revenues from stability contributions in Iceland.

Box 3.1. Treatment of capital transfers

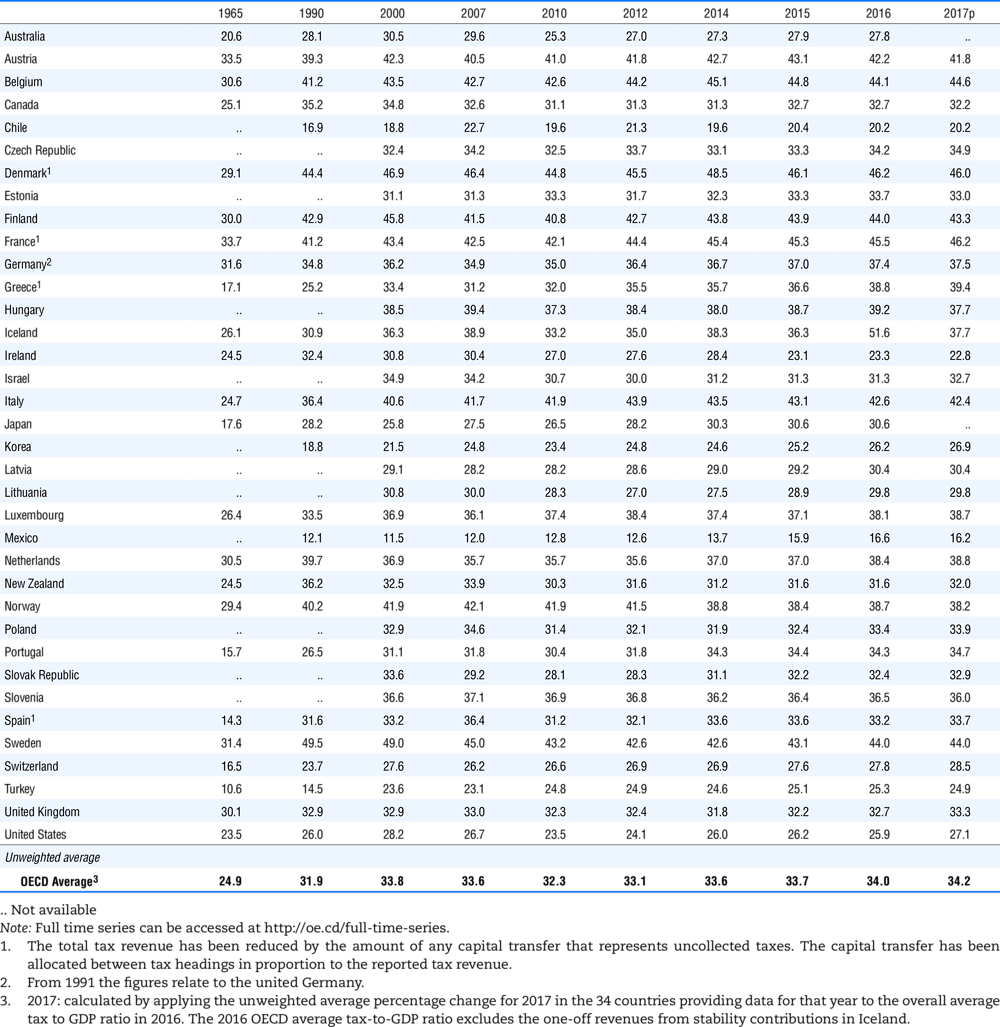
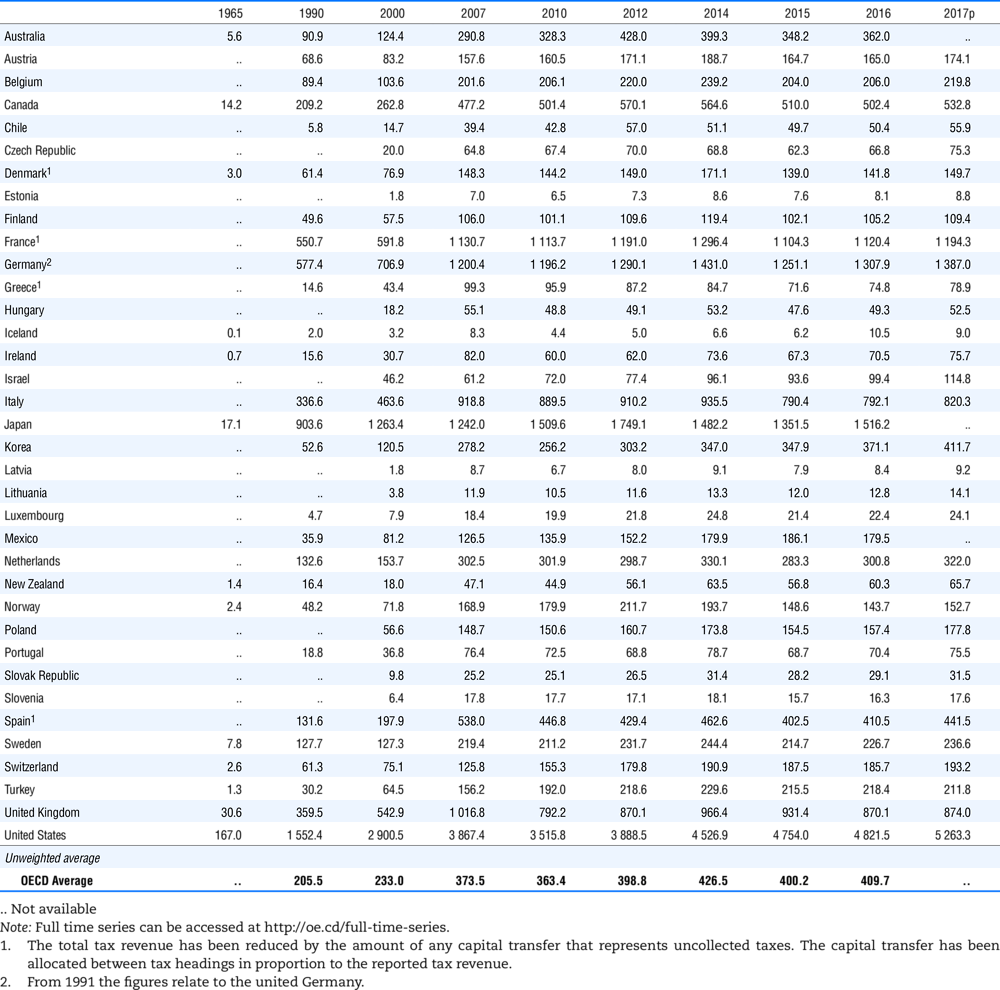
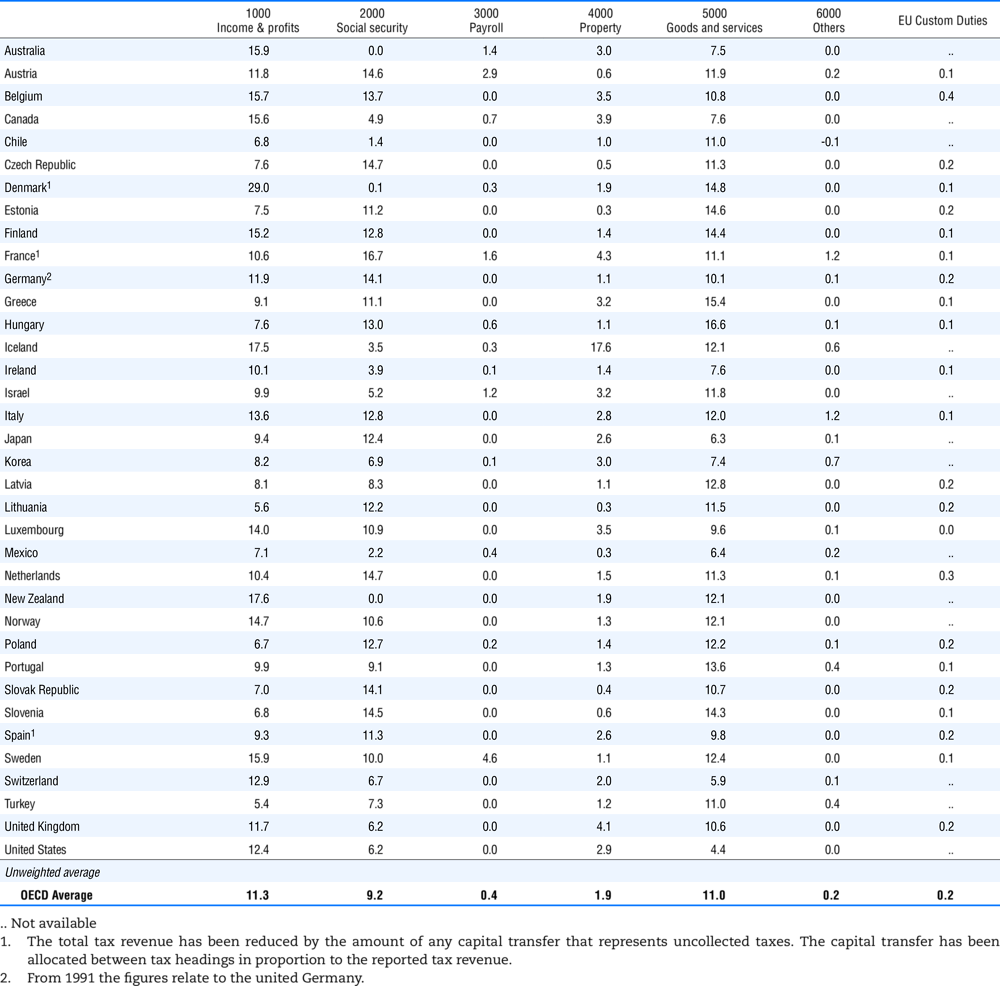
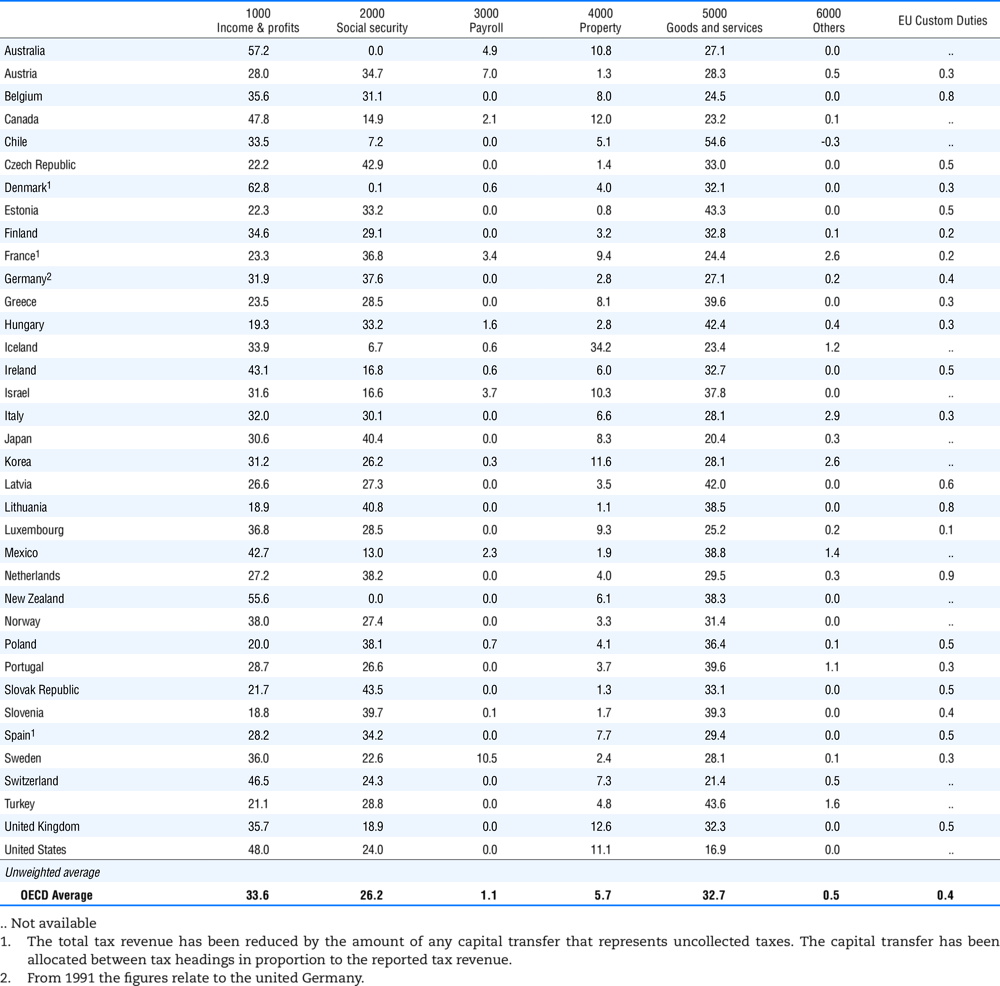
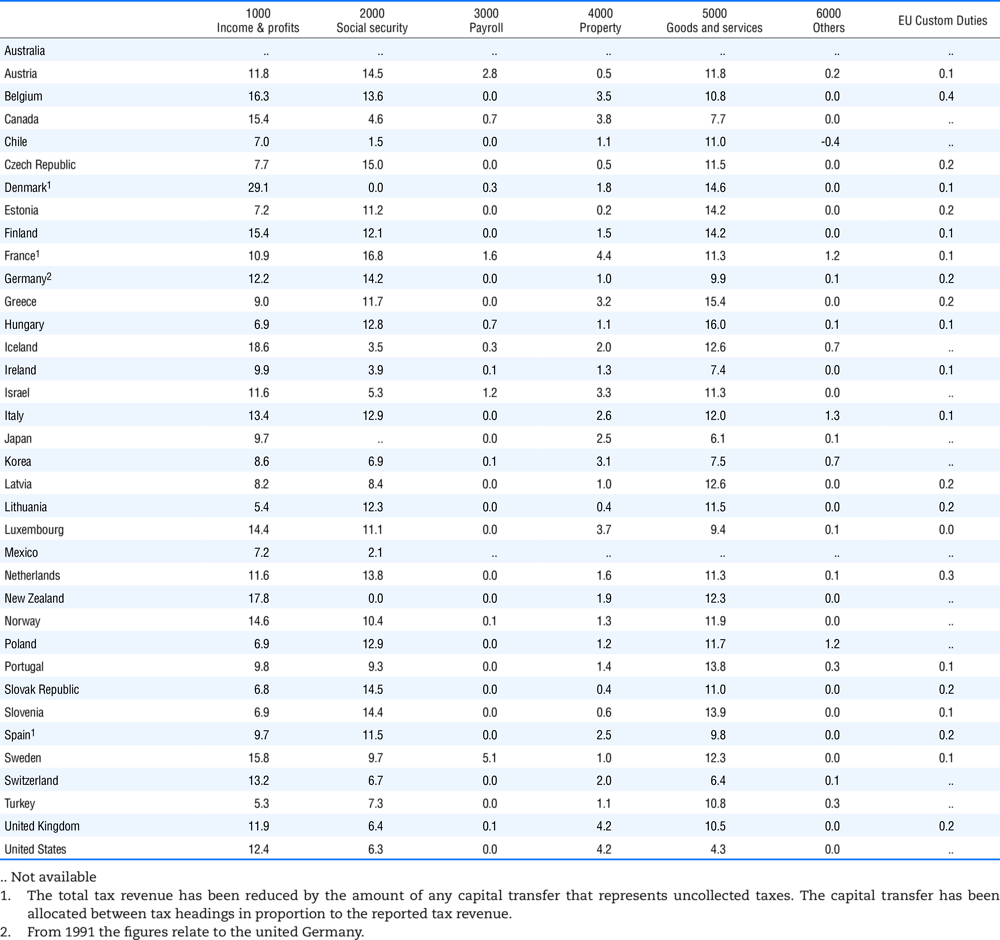
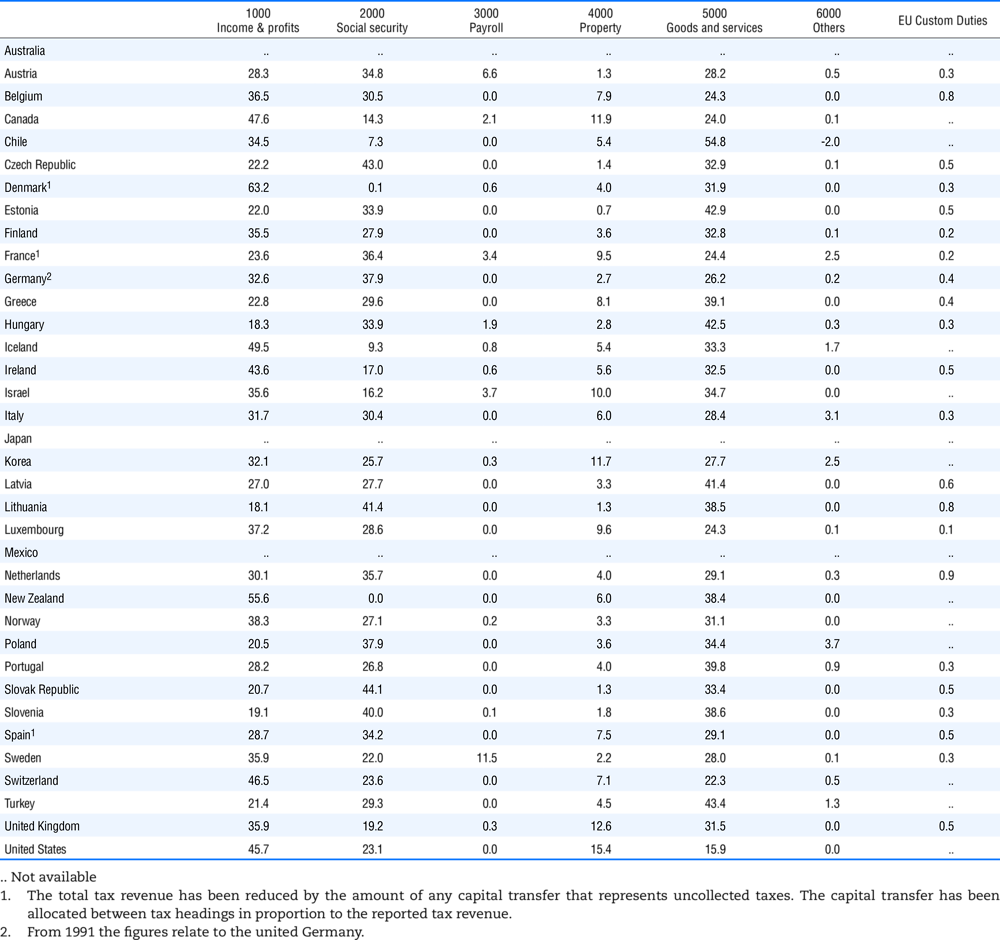
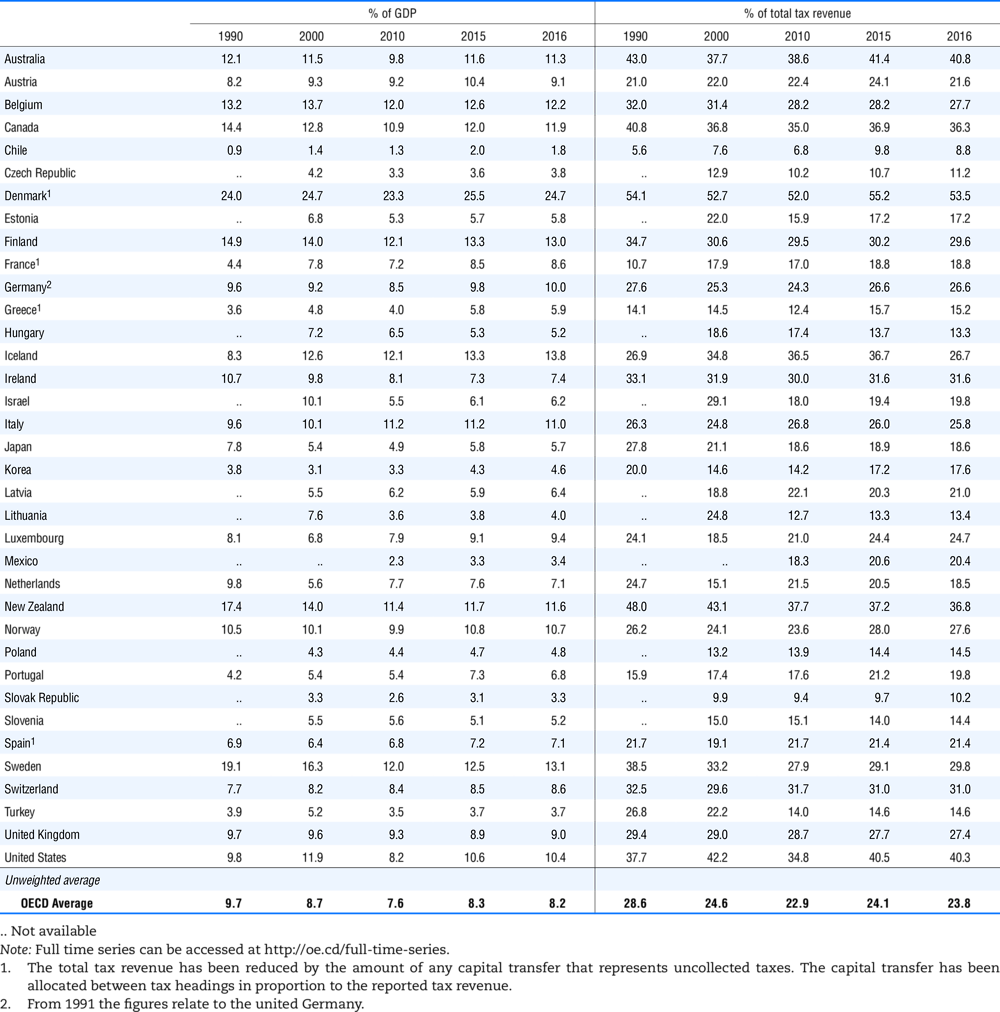
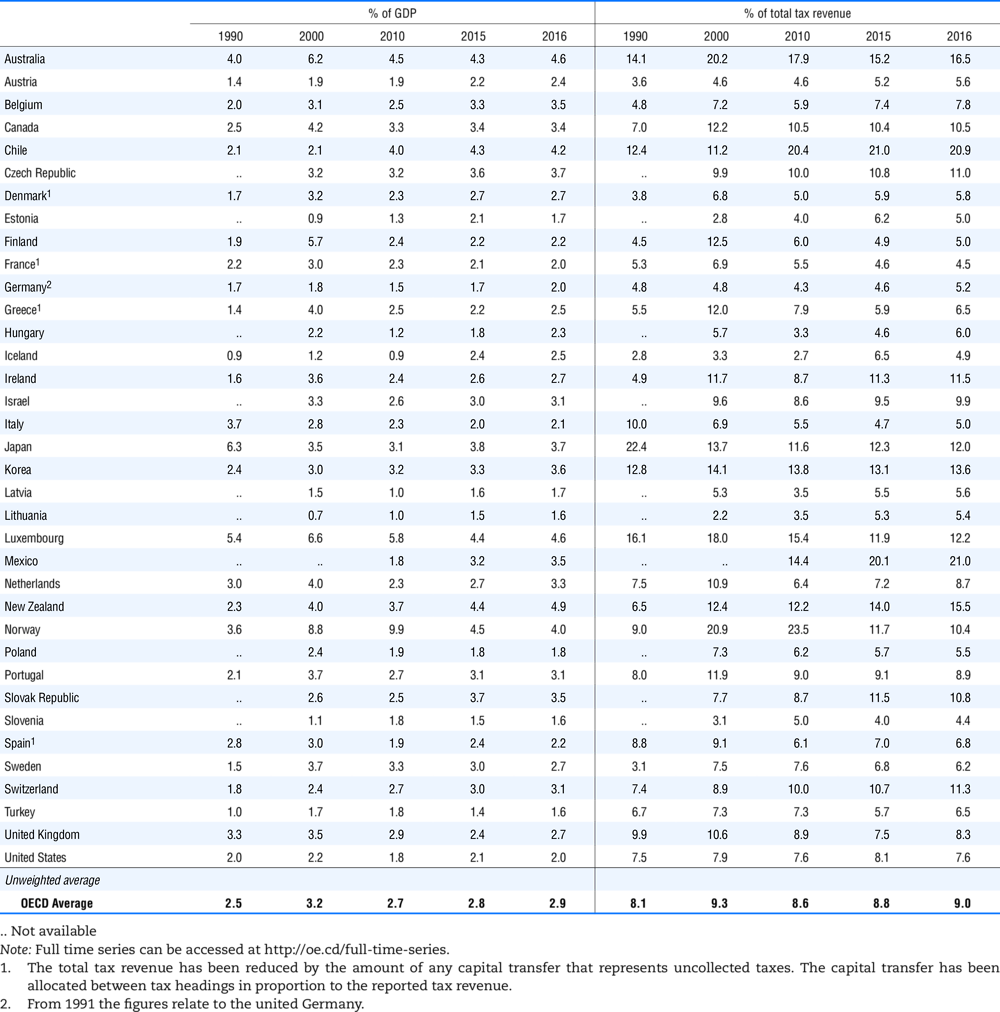
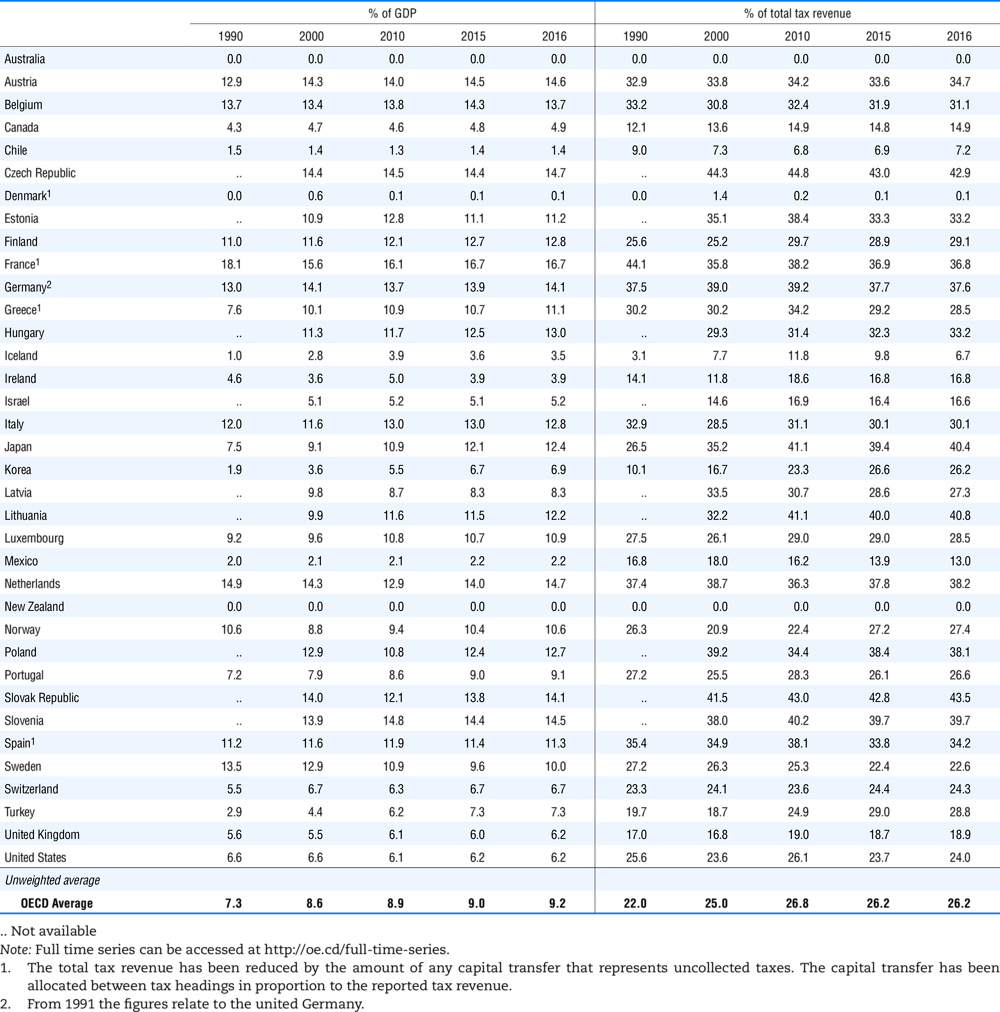
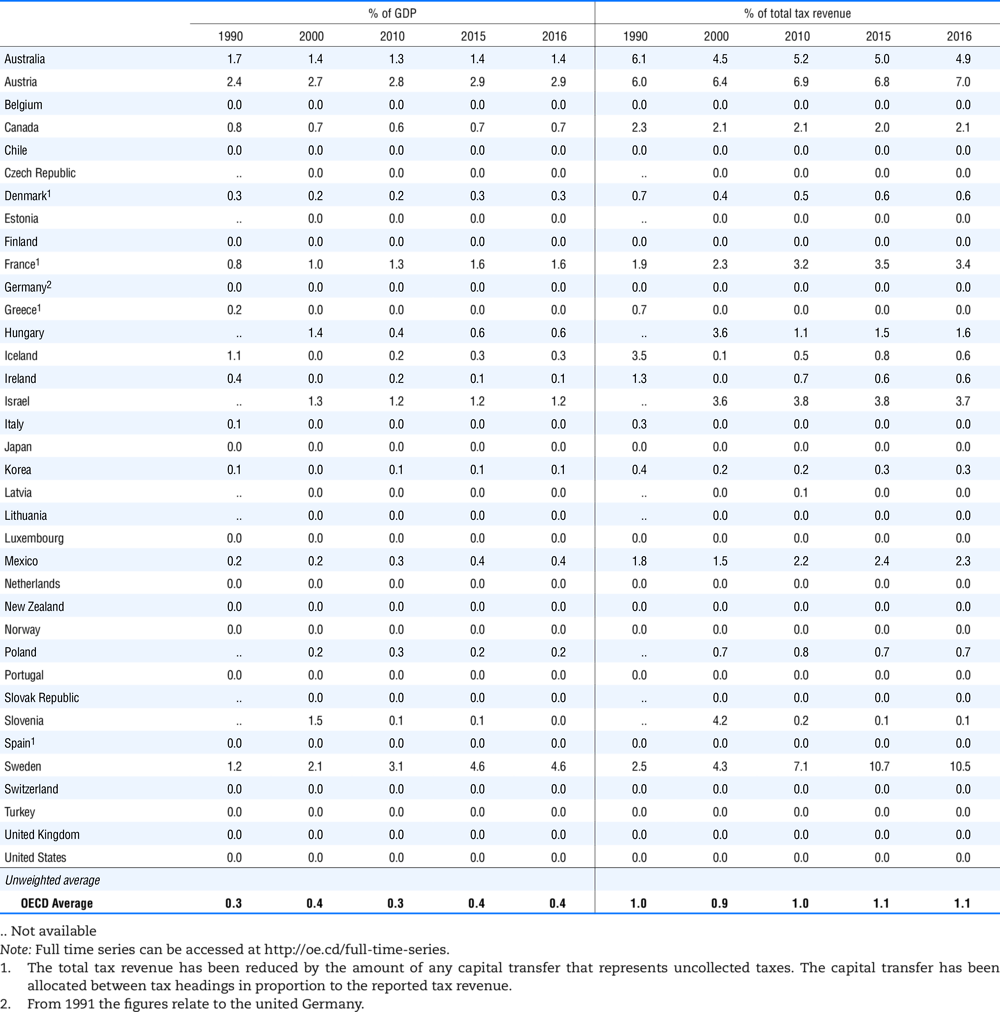
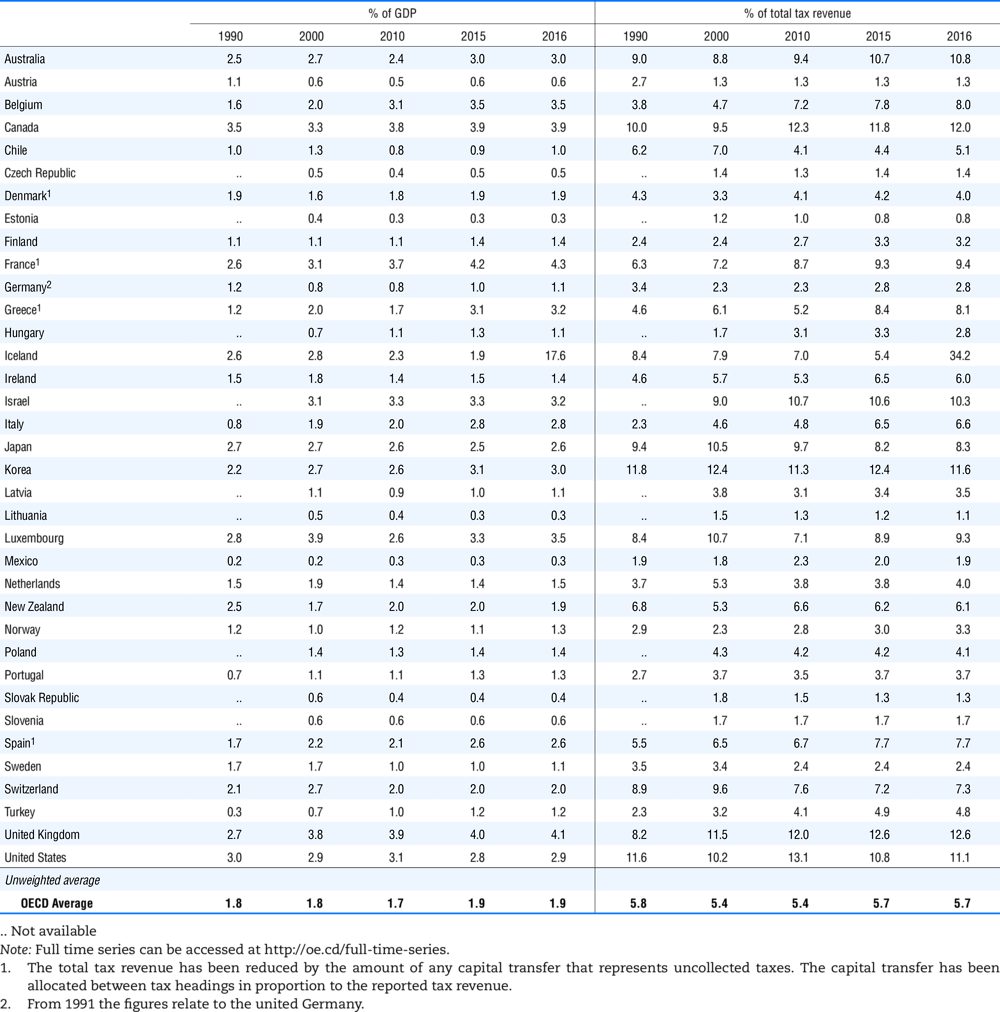
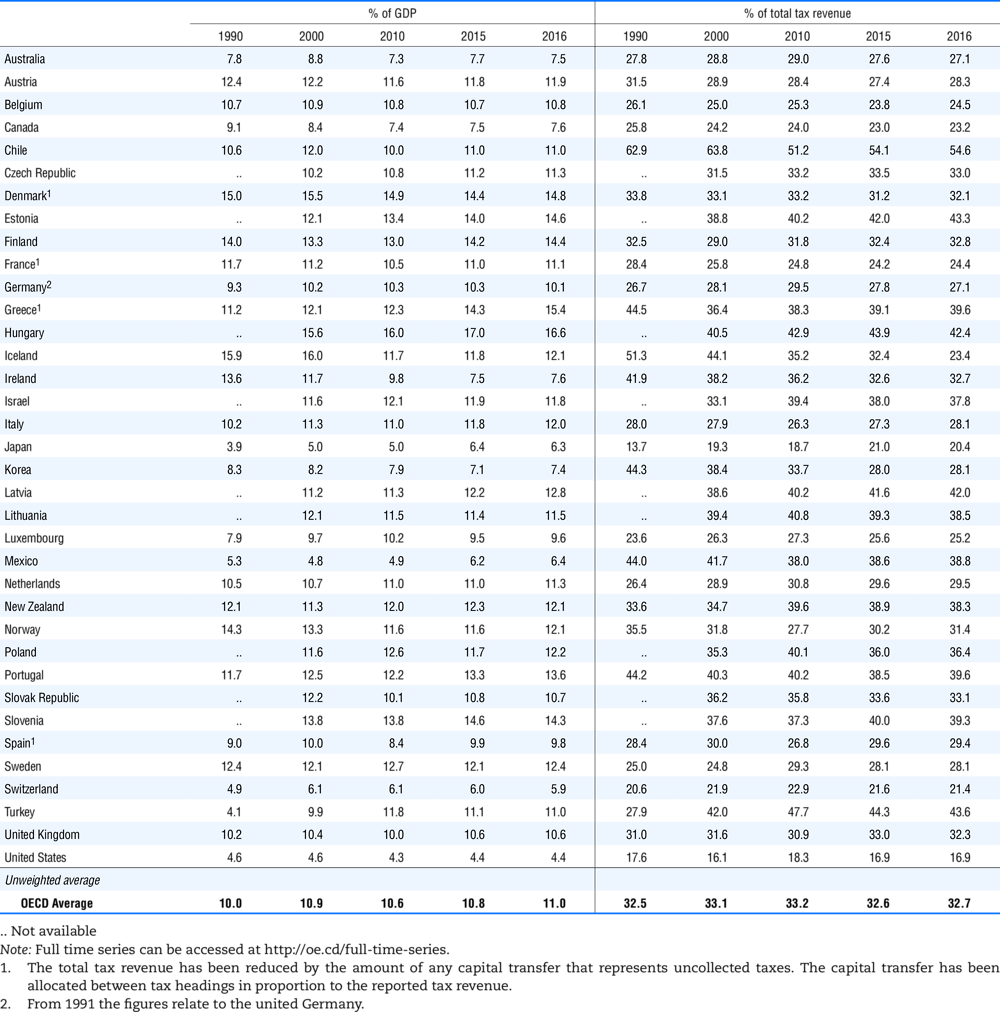
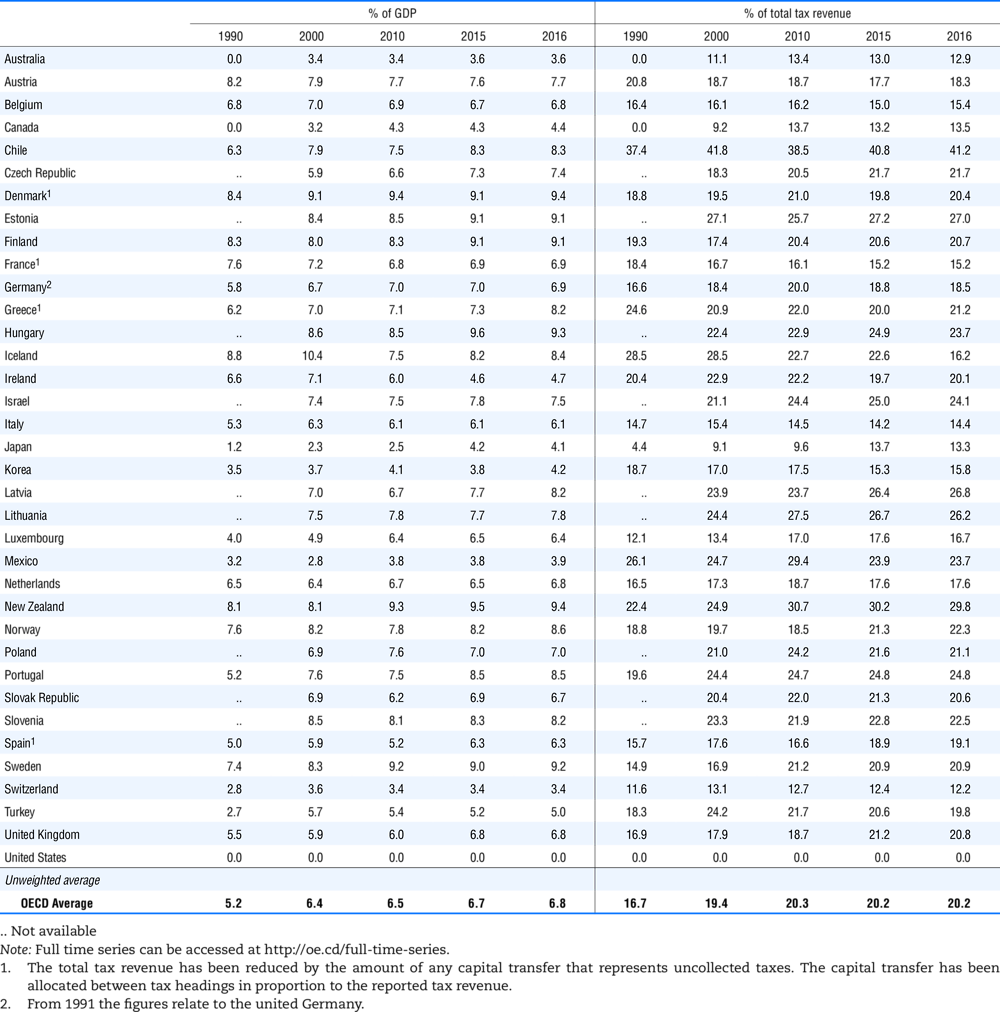
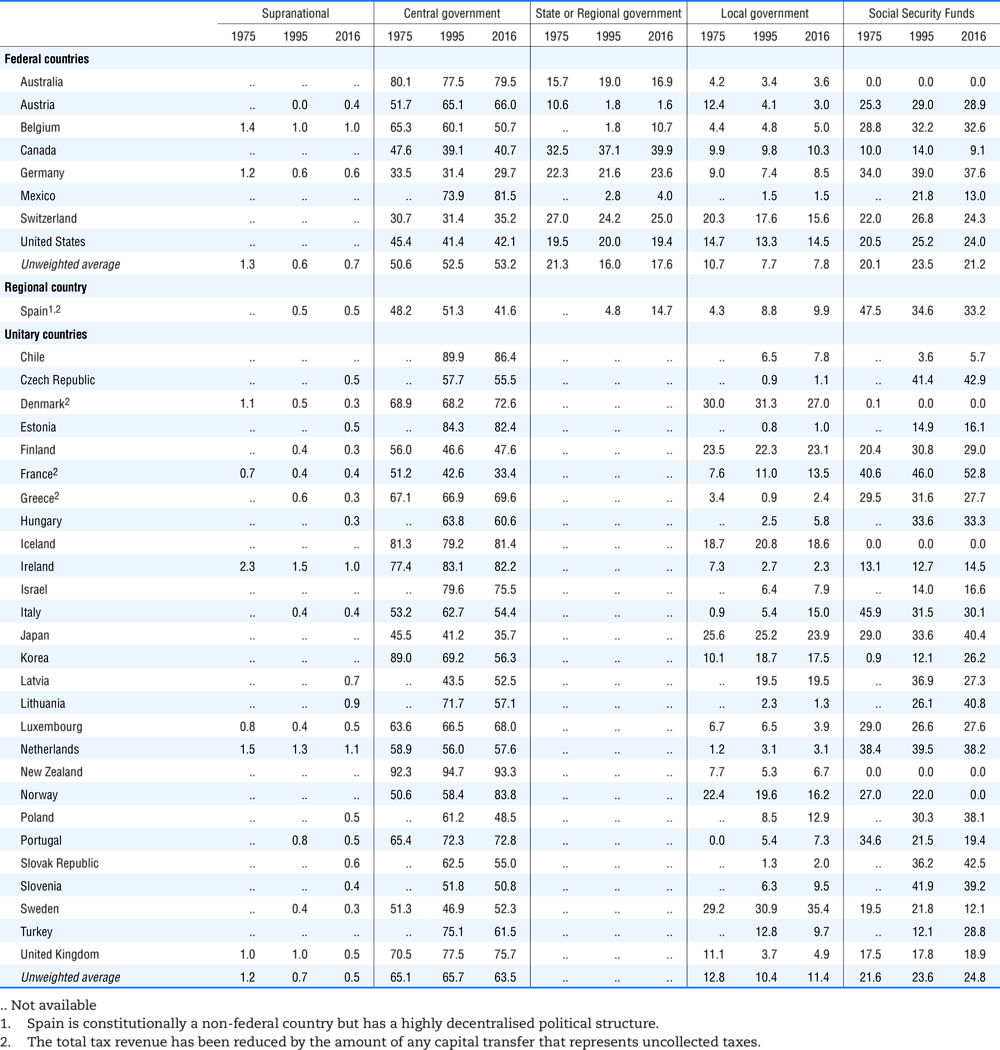
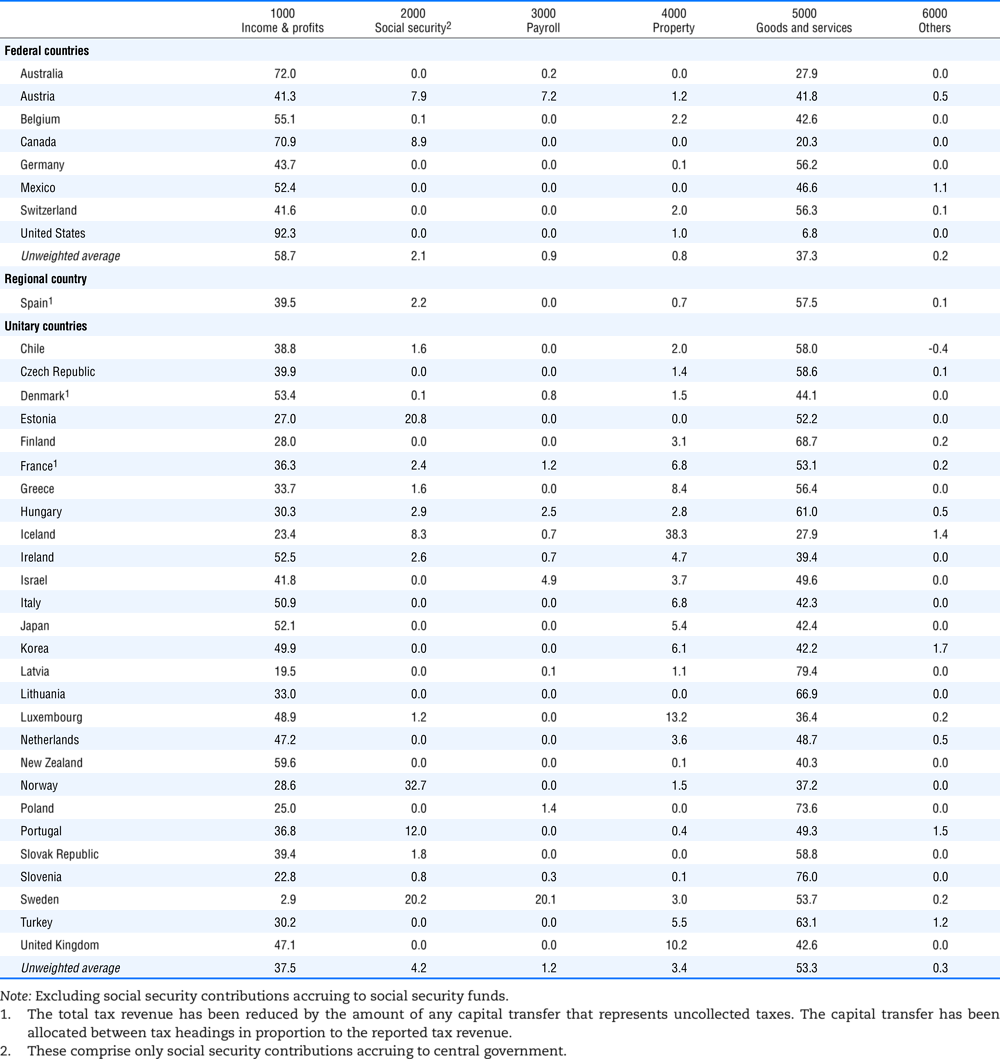
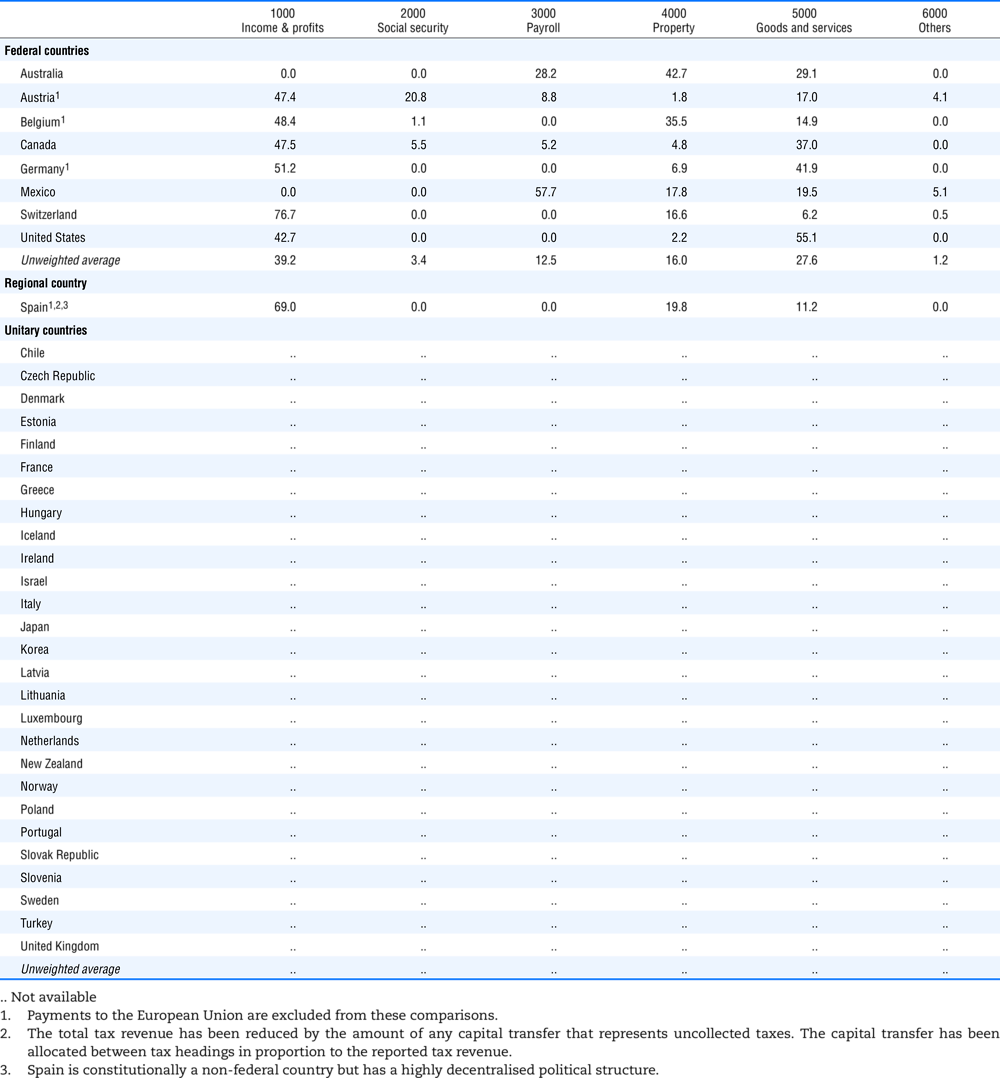
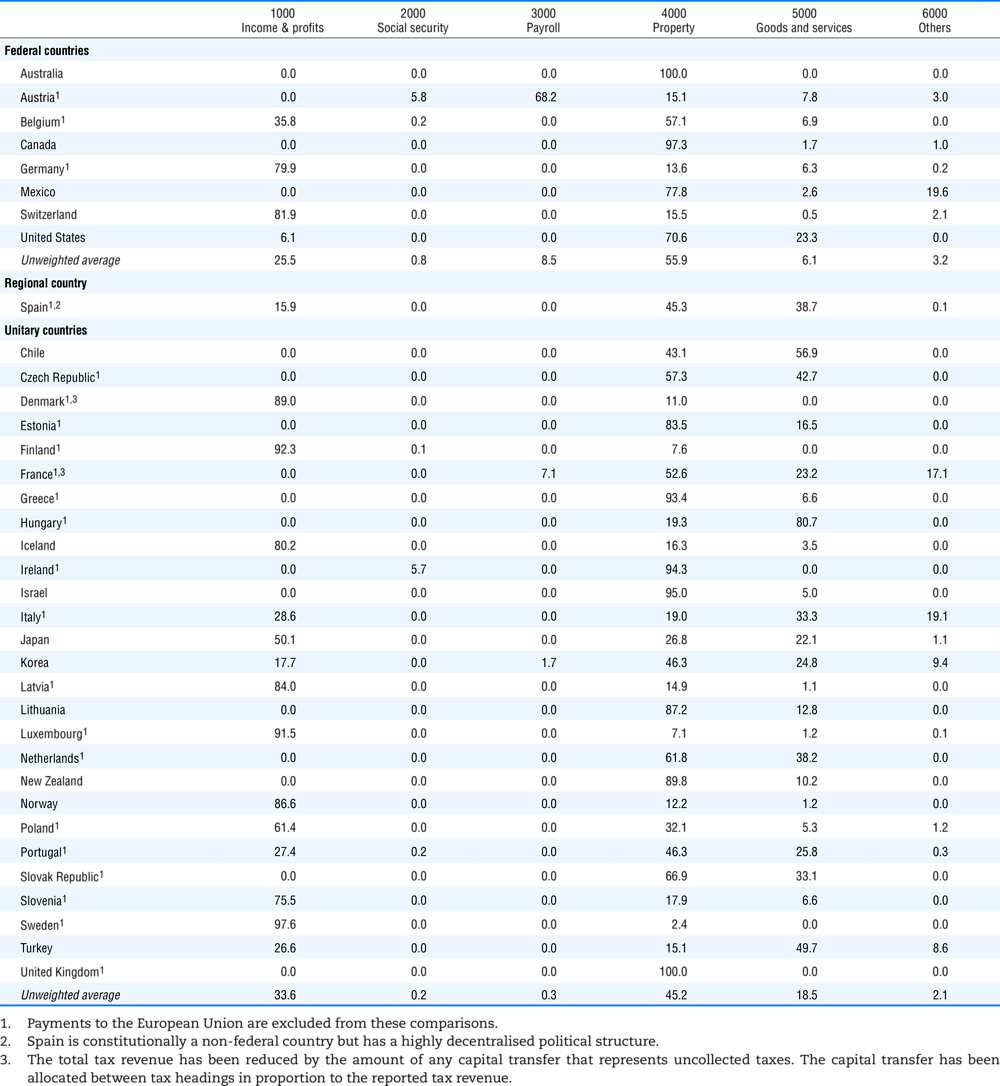
Footnotes to Tables 3.1 to 3.18 refer to the treatment of the capital transfers that some countries make to account for taxes that have been assessed but not collected. The capital transfer has been subtracted from the total tax revenue and this reduction has been allocated between tax headings in proportion to their tax revenues.

This applies to the following countries:

  • Denmark from 1971.

  • France from 1992.

  • Greece for 1999 and 2000.

  • Lithuania from 1999.

  • Spain from 1995.

Table 3.1. Total revenue as % of GDP
Total revenue as % of GDP

 StatLink https://doi.org/10.1787/888933859323

Table 3.2. Total tax revenue in billions of US dollars at market exchange rates
Total tax revenue in billions of US dollars at market exchange rates

 StatLink https://doi.org/10.1787/888933859342

Table 3.3. Tax revenue of main headings as % of GDP, 2016
Tax revenue of main headings as % of GDP, 2016

 StatLink https://doi.org/10.1787/888933859361

Table 3.4. Tax revenue of main headings as % of total tax revenue, 2016
Tax revenue of main headings as % of total tax revenue, 2016

 StatLink https://doi.org/10.1787/888933859380

Table 3.5. Tax revenue of main headings as % of GDP, 2017p
Tax revenue of main headings as % of GDP, 2017p

 StatLink https://doi.org/10.1787/888933859399

Table 3.6. Tax revenue of main headings as % of total tax revenue, 2017p
Tax revenue of main headings as % of total tax revenue, 2017p

 StatLink https://doi.org/10.1787/888933859418

Table 3.7. Taxes on income and profits (1000) as % of GDP and as % of total tax revenue
Taxes on income and profits (1000) as % of GDP and as % of total tax revenue

 StatLink https://doi.org/10.1787/888933859437

Table 3.8. Taxes on personal income (1100) as % of GDP and as % of total tax revenue
Taxes on personal income (1100) as % of GDP and as % of total tax revenue

 StatLink https://doi.org/10.1787/888933859456

Table 3.9. Taxes on corporate income (1200) as % of GDP and as % of total tax revenue
Taxes on corporate income (1200) as % of GDP and as % of total tax revenue

 StatLink https://doi.org/10.1787/888933859475

Table 3.10. Social security contributions (2000) as % of GDP and as % of total tax revenue
Social security contributions (2000) as % of GDP and as % of total tax revenue

 StatLink https://doi.org/10.1787/888933859494

Table 3.11. Taxes on payroll and workforce (3000) as % of GDP and as % of total tax revenue
Taxes on payroll and workforce (3000) as % of GDP and as % of total tax revenue

 StatLink https://doi.org/10.1787/888933859513

Table 3.12. Taxes on property (4000) as % of GDP and as % of total tax revenue
Taxes on property (4000) as % of GDP and as % of total tax revenue

 StatLink https://doi.org/10.1787/888933859532

Table 3.13. Taxes on goods and services (5000) as % of GDP and as % of total tax revenue
Taxes on goods and services (5000) as % of GDP and as % of total tax revenue

 StatLink https://doi.org/10.1787/888933859551

Table 3.14. Value added taxes (5111) as % of GDP and as % of total tax revenue
Value added taxes (5111) as % of GDP and as % of total tax revenue

 StatLink https://doi.org/10.1787/888933859570

Table 3.15. Tax revenues of sub-sectors of general government as % of total tax revenue
Tax revenues of sub-sectors of general government as % of total tax revenue

 StatLink https://doi.org/10.1787/888933859589

Table 3.16. Main central government taxes as % of total tax revenues of central government, 2016
Main central government taxes as % of total tax revenues of central government, 2016

 StatLink https://doi.org/10.1787/888933859608

Table 3.17. Main state government taxes as % of total tax revenues of state government, 2016
Main state government taxes as % of total tax revenues of state government, 2016

 StatLink https://doi.org/10.1787/888933859627

Table 3.18. Main local government taxes as % of total tax revenues of local government, 2016
Main local government taxes as % of total tax revenues of local government, 2016

 StatLink https://doi.org/10.1787/888933859646

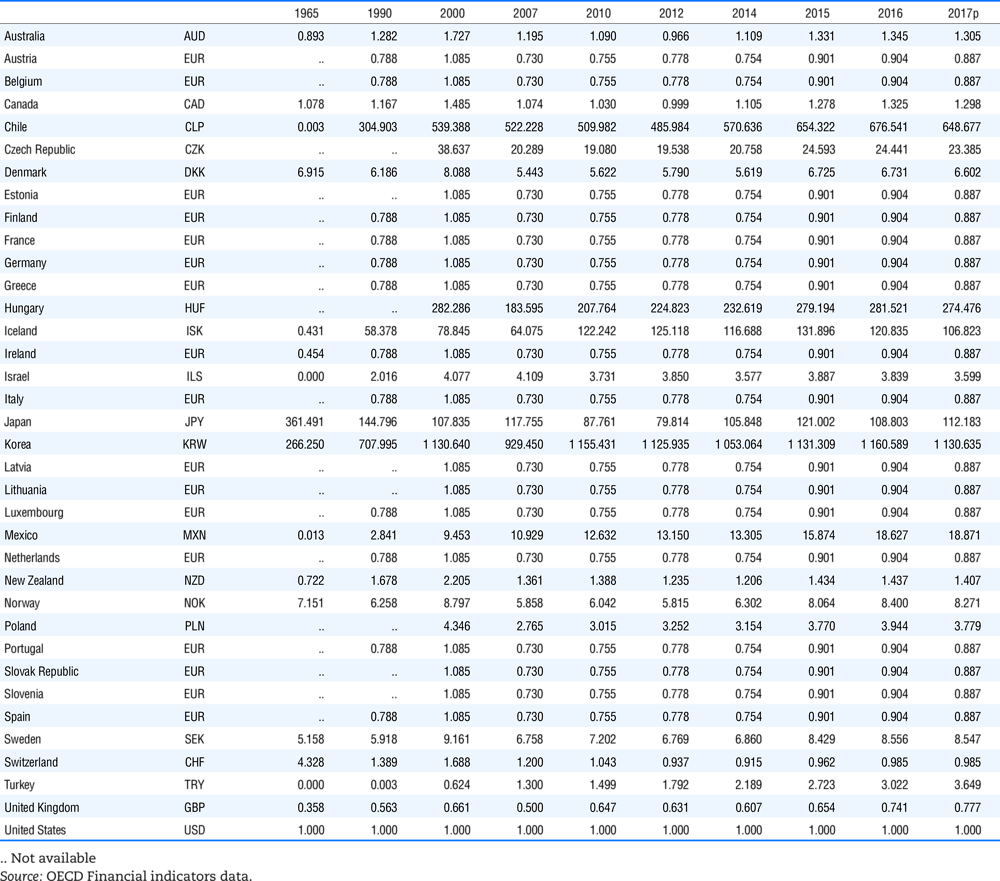
Table 3.19. Gross domestic product for tax reporting years at market prices, in billions of national currency
Gross domestic product for tax reporting years at market prices, in billions of national currency

 StatLink https://doi.org/10.1787/888933859665

Table 3.20. Exchange rates used, national currency per US dollar at market exchange rates
Exchange rates used, national currency per US dollar at market exchange rates

 StatLink https://doi.org/10.1787/888933859684

End of the section – Back to iLibrary publication page