Chapter 1. Tax revenue trends 1965-2017
Chapter 1 provides information on trends in tax revenues in OECD countries from 1965 to 2017, including changes in tax-to-GDP ratios, tax structures, taxes by level of government and non-wastable tax credits.
Revenue Statistics 2018 presents detailed internationally comparable data on tax revenues of OECD countries for all levels of government. The latest edition provides final data on tax revenues in 1965-2016. In addition, provisional estimates of tax revenues in 2017 are included for almost all OECD countries.1
In Revenue Statistics 2018, taxes are defined as compulsory, unrequited payments to general government. Taxes are unrequited in the sense that benefits provided by government are not normally in proportion to their payments.
In the OECD classification, taxes are classified by the base of the tax:
-
Income and profits (heading 1000)
-
Compulsory social security contributions paid to general government, which are treated as taxes (heading 2000)
-
Payroll and workforce (heading 3000)
-
Property (heading 4000)
-
Goods and services (heading 5000)
-
Other (heading 6000)
Much greater detail on the tax concept, the classification of taxes and the accrual basis of reporting is set out in the OECD Interpretative Guide at annex A of Revenue Statistics 2018.
All of the averages presented in this summary are unweighted.
1.1. Tax-to-GDP ratios
1.1.1. Tax ratios for 2017 (provisional data)
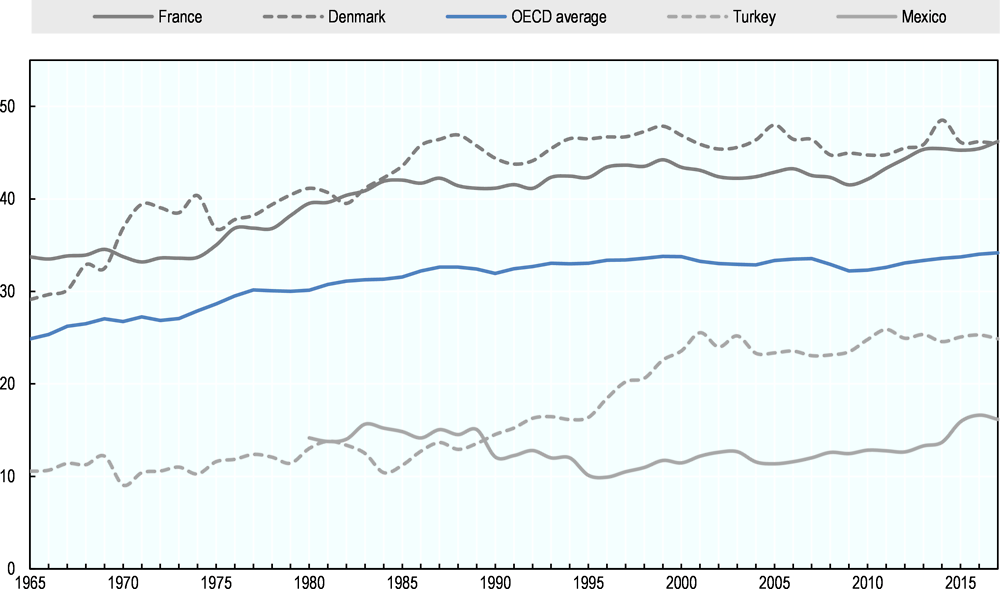
New OECD data in the annual Revenue Statistics 2018 publication show that tax revenues as a percentage of GDP (i.e. the tax-to-GDP ratio) have continued to increase since the low-point experienced in almost all countries in 2008 and 2009 as a result of the financial and economic crisis. The average tax-to-GDP ratio in OECD countries was 34.2%2 in 2017 compared with 34.0% in 2016 and 33.7% in 2015. The 2017 figure is the highest recorded OECD average tax-to-GDP ratio since records began in 1965 (Figure 1.1).
1. Data for 2017 are preliminary. The OECD average in 2017 is calculated by applying the unweighted average percentage change for 2017 in the 33 countries providing data for that year to the overall average tax to GDP ratio in 2016.
2. The 2016 OECD average tax-to-GDP ratio excludes the one-off revenues from stability contributions in Iceland.
Source: Table 3.1.
Country tax-to-GDP ratios in 2017 varied considerably (Table 1.1), both across countries and since 2016. Key observations include:
-
France had the highest tax-to-GDP ratio in 2017 (46.2%). Denmark, which had the highest tax-to-GDP ratio of OECD countries from 2002 to 2016, had the second-highest tax-to-GDP ratio in 2017 (46.0%). Mexico had the lowest tax-to-GDP ratio (16.2%).
-
Of the 34 countries for which data for 2017 are available, the ratio of tax revenues to GDP compared to 2016 rose in 19 and fell in 15.
-
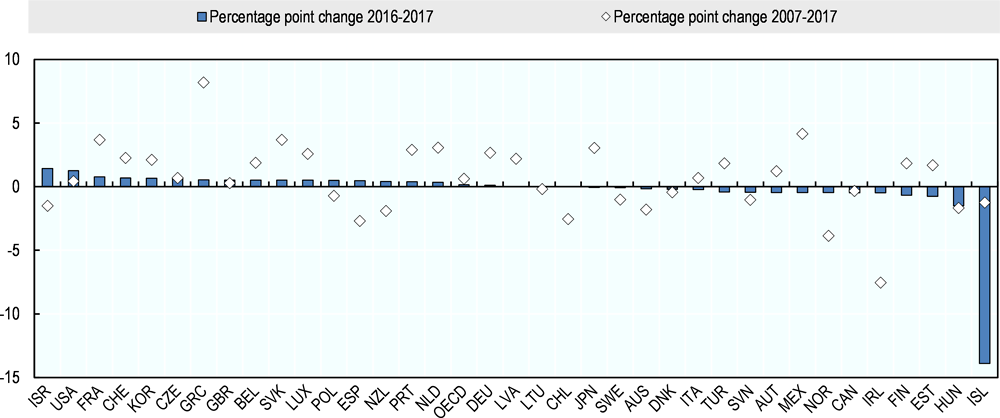
Between 2016 and 2017, the largest tax ratio increases were in Israel and the United States. Israel introduced a number of policy changes which impacted revenues from taxes on income and profits – including a reduced basic tax credit for personal income taxes, increased employer SSCs, and changes to corporate taxation – which together contributed to an increase in its tax-to-GDP ratio of 1.4 percentage points. The tax-to-GDP ratio in the United States increased by 1.3 percentage points, partly due to the one-off deemed repatriation tax on foreign earnings under the Tax Cuts and Jobs Act. No other country experienced an increase of more than one percentage point in their tax-to-GDP ratio between 2016 and 2017 (Figure 1.2).
-
The largest falls in the tax-to-GDP ratio between 2016 and 2017 were in Iceland (13.9 percentage points, due to one-off stability contributions in 2016) and Hungary (1.5 percentage points, due to lower revenues from taxes on income and profits and from taxes in goods and services following a package of reforms in 2016). There were no other decreases of over one percentage point.
In 2016, Iceland received revenues from one-off stability contributions from entities that previously operated as commercial or savings banks and were concluding operations. The stability contributions aimed to liberalise the capital controls that were imposed following the 2007-08 crisis, while preserving Iceland’s economic stability. The revenue from these contributions led to unusually high tax revenues for a single year.
The one-off stability contributions raised nearly ISK 385 000 million, equivalent to 15.7% of Iceland’s GDP in 2016. Iceland’s tax-to-GDP ratio rose from 36.3% in 2015 to 51.6% in 2016, before dropping 13.9 percentage points to 37.7% in 2017 (provisional). Due to the exceptional nature of the stability contributions, they are not representative of trends in tax levels across OECD countries and have been excluded from the calculation of the OECD average in 2016.
1. Preliminary data for 2017 was not available for Australia and Japan. For these countries the comparison shown is 2015-2016 and 2007-2016 data.
2. The 2016 OECD average tax-to-GDP ratio excludes the one-off revenues from stability contributions in Iceland.
Source: Secretariat calculations based on Table 3.1.
Although the OECD average tax-to-GDP ratio was higher in 2017 than in 2007 (pre-crisis), this was not the case in 15 OECD countries3, which had lower tax-to-GDP ratios in 2017 than in 2007. In particular, the ratio in 2017 remains at least 3 percentage points lower in two countries; Ireland and Norway. The biggest fall has been in Ireland, from 30.4% in 2007 to 22.8% of GDP in 2017, largely due to the exceptional increase in GDP in 2015. Excluding Ireland, the largest fall has been in Norway, from 42.1% of GDP in 2007 to 38.2% in 2017 (Figure 1.2). In contrast, the strongest increase over this period was in Greece (8.2 percentage points, from 31.2% to 39.4% between 2007 and 2017). Five other countries, France, Japan, Mexico, the Netherlands and the Slovak Republic, experienced increases of 3 percentage points or more over the same period.
The tax-to-GDP ratios shown in Revenue Statistics 2018 express aggregate tax revenues as a percentage of GDP. The value of this ratio depends on its denominator (GDP) as well as its numerator (tax revenue), and that the denominator – GDP – is subject to historical revision.
The numerator (tax revenue)
-
For the numerator, the OECD Secretariat uses revenue figures that are submitted annually by correspondents from national Ministries of Finance, Tax Administrations or National Statistics Offices. Although provisional figures for most countries become available with a lag of about six months, finalised data become available with a lag of around one and a half years. Final revenue data for 2016 were received during the period May-August 2018.
-
In thirty-three OECD countries the reporting year coincides with the calendar year. Three countries — Australia, Japan and New Zealand — have different reporting years. Reporting year 2015 includes Q2/2015–Q1/2016 (Japan) and Q3/2015–Q2/2016 (Australia, New Zealand) respectively (Q = quarter).
The denominator (GDP)
-
For the denominator, the GDP figures used for Revenue Statistics 2018 are the most recently available in September 2018. By that time, the 2016 and 2017 GDP figures were available for all OECD countries.
-
Using these GDP figures ensures a maximum of consistency and international comparability for the reported tax-to-GDP ratios.
-
The GDP figures are based on the OECD Annual National Accounts (ANA – SNA) for the thirty-two OECD countries where the reporting year is the actual calendar year.
-
Where the reporting year differs from the calendar year, the annual GDP estimates are obtained by aggregating quarterly GDP estimates provided by the OECD Statistics Directorate for those quarters corresponding to each country’s fiscal (tax) year. For example, in the case of Japan Q2/2016–Q1/2017.
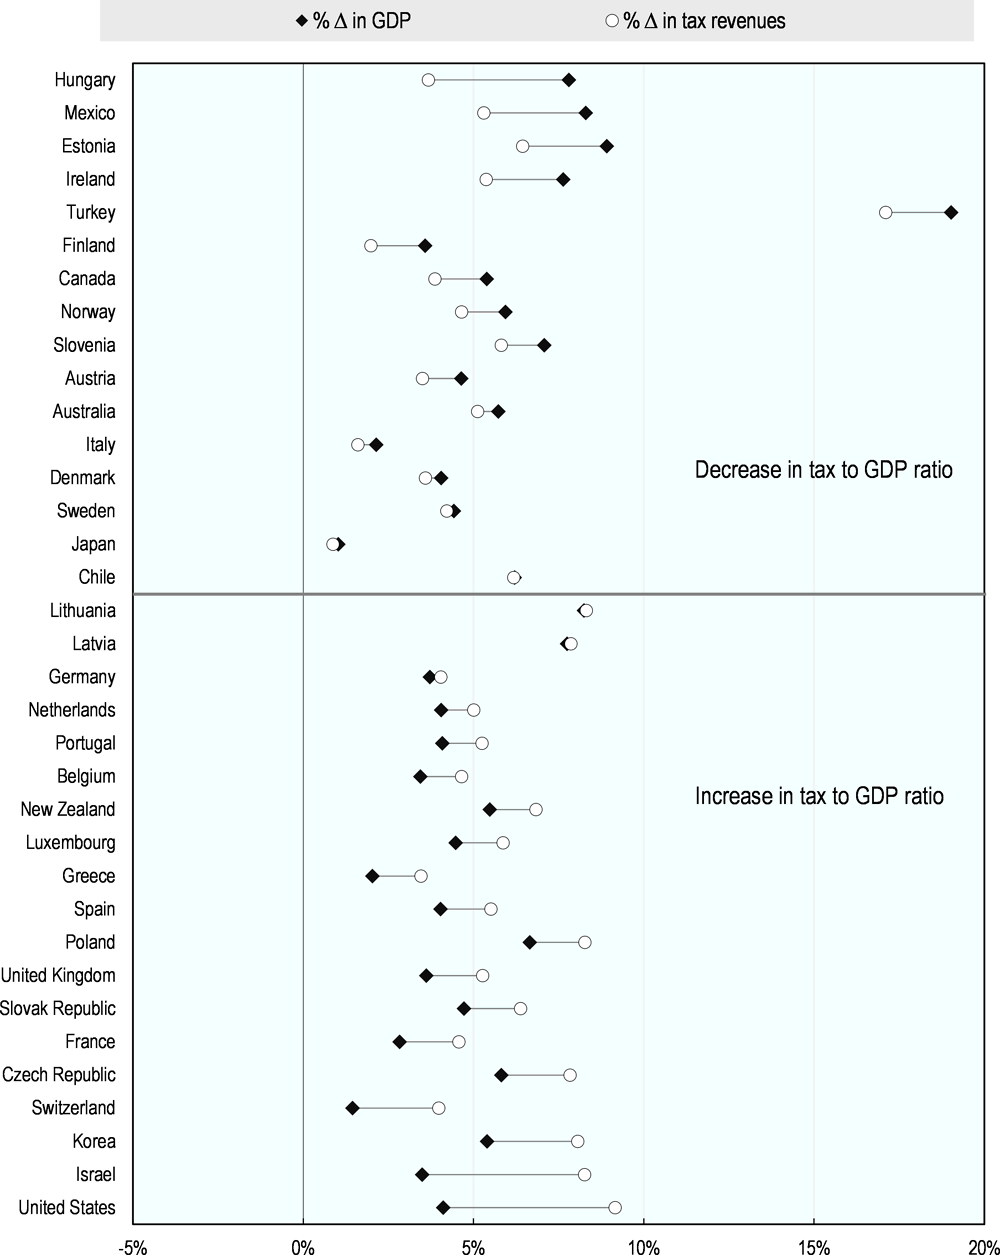
Changes in the tax-to-GDP ratio are driven by the relative changes in nominal tax revenues and in nominal GDP. From one year to the next, if tax revenues rise more than GDP (or fall less than GDP) the tax-to-GDP ratio will increase. Conversely, if tax revenues rise less than GDP, or fall further, the tax-to-GDP ratio will go down. Therefore, the tax-to-GDP ratio does not necessarily mean that the amount of tax revenues have increased in nominal, or even real, terms.
In 2017, 19 OECD countries had an increase in their tax-to-GDP ratio relative to 2016. In all of these countries, GDP growth was positive, although to a lesser degree than tax revenue growth. Of the fifteen OECD countries that experienced a decline in their tax-to-GDP ratio in 2017, thirteen had higher levels of tax revenues, although to a lesser degree than growth in nominal GDP levels. Two countries (Iceland and Mexico) had positive nominal GDP growth and negative tax revenue growth; no countries experienced declines in nominal GDP (Figure 1.3). In Figure 1.3, changes between 2015 and 2016 are shown for Australia and Japan, where the tax-to-GDP ratio is not available in 2017. In both countries, GDP grew faster than nominal tax revenues, leading to decreases in the tax-to-GDP ratio.
1. Data for Australia and Japan show the change between 2015 and 2016, as preliminary data for 2017 was not available for Australia and Japan. Data for Mexico in 2017 show a Secretariat estimate, including expected revenues collected by state and local governments.
2. Iceland's tax-to-GDP dropped 24% from 2016 to 2017, due to large one-off revenues from stability contributions in 2016. To improve readability of the graph, Iceland has not been included.
Source: Secretariat calculations based on chapter 4 (tax revenues) and table 3.19 (GDP).
1. Preliminary data for 2017 was not available for Australia and Japan.
2. The 2016 OECD average tax-to-GDP ratio excludes the one-off revenues from stability contributions in Iceland. These stability contributions caused a large increase in Iceland’s tax-to-GDP ratio in 2016, after which the tax-to-GDP ratio returned to more typical levels.
Source: Secretariat calculations based on Table 3.1
1.1.2. Tax-to-GDP ratios for 2016 (final data)
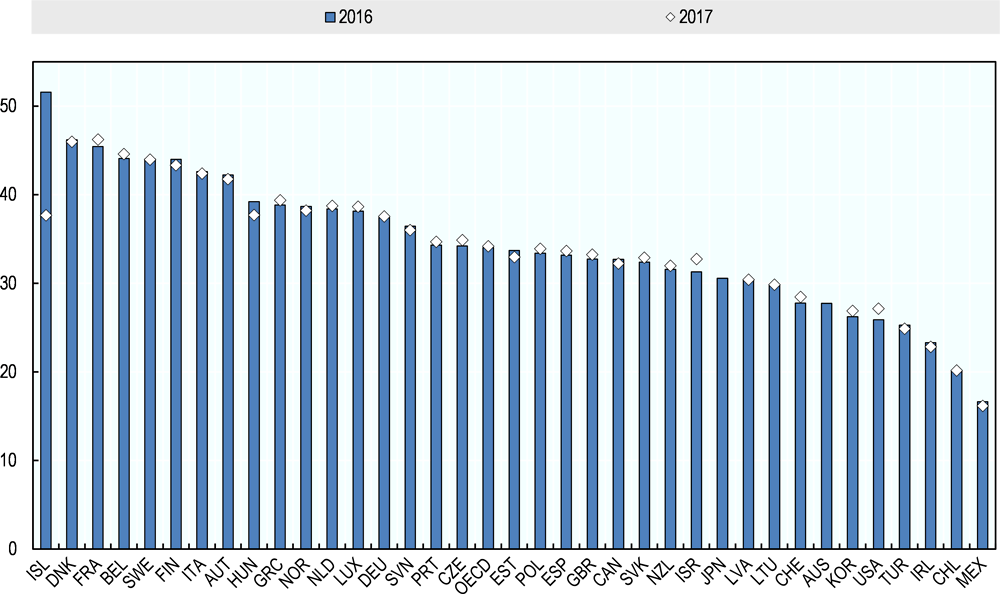
The latest year for which tax-to-GDP ratios are based on final revenue data and available for all OECD countries is 2016 (Figure 1.4). These data show that tax ratios vary considerably across countries:
-
In 2016, Iceland had the highest tax-to-GDP ratio (51.6%), due to one-off stability contributions in that year. Excluding Iceland, Denmark (46.2%), France (45.5%), Belgium (44.1) and Sweden (44.0%) had the highest tax-to-GDP ratios in the OECD in 2016.
-
Mexico had the lowest ratio at 16.6% followed by Chile (20.2%), Ireland (23.3%), Turkey (25.3%) and the United States (25.9%).
-
Eight countries – Austria, Belgium, Denmark, Finland, France, Iceland, Italy and Sweden – had tax-to-GDP ratios of above 40%.
-
In contrast, nine countries – Australia, Chile, Ireland, Korea, Lithuania, Mexico, Switzerland, Turkey and the United States – had tax-to-GDP ratios below 30%.
-
The tax-to-GDP ratio in the OECD area as a whole (un-weighted average) was 34.0% in 2016 and rose by 0.3 percentage points from 2015.
-
Relative to 2015, overall tax ratios rose in 26 OECD member countries and fell in 10.
-
The largest increases in the tax-to-GDP ratio were in Iceland (15.3 percentage points), Greece (2.3), the Netherlands (1.4), Latvia (1.2) and Korea (1.1).
-
The largest reductions were in Austria (0.9 percentage points), Belgium (0.7) and Italy (0.5).
Between 2015 and 2016, the key changes in the tax-to-GDP ratio were largely driven by increases in revenues from goods and services taxes and from social security contributions. Revenues from taxes on income (personal and corporate income taxes together) as a percentage of GDP were unchanged at 11.3% on average (Table 1.2). The largest increase in revenues from taxes on income was in Greece (0.7 percentage points) and Luxembourg (0.6 percentage points). Austria and Chile reported the largest falls in income taxes as a percentage of GDP (by 1.2 and 0.7 percentage points of GDP respectively).
Between 2015 and 2016, average revenues from personal income taxes decreased by 0.1 percentage point to 8.2% of GDP in 2016, while revenues from corporate income tax increased by 0.1 percentage point to 2.9% of GDP in 2016 (Table 1.2). Revenues from goods and services taxes increased from 10.8% of GDP in 2015 to 11.0% in 2016. Social security contributions also increased from 9.0% of GDP in 2015 to 9.2% in 2016. The other ratios were largely unchanged between 2015 and 2016.
1.1.3. Tax ratio changes between 1965 and 2016
Between 1965 and 2016, the average tax-to-GDP ratio in the OECD area increased from 24.9% to 34.0% (an increase of 9.1 percentage points) (Figure 1.1).
Before the first oil shock (1973 to 1974), strong, almost uninterrupted income growth enabled tax levels to rise in all OECD countries. In part, tax levels rose automatically through the effect of fiscal drag on personal income tax schedules. From 1975 to 1985, the tax burden in the OECD area increased by 2.9 percentage points. After the mid-1970s, the combination of slower real income growth and higher levels of unemployment apparently limited the revenue raising capacity of governments. But during and after the deep recession following the second oil shock (1980), countries in Europe saw tax levels rise further, to finance higher spending on social security and rein in budget deficits.
After the mid-1980s, most OECD countries substantially reduced the statutory rates of their personal and corporate income tax, but the negative revenue impact of widespread tax reforms was often offset by reducing or abolishing tax reliefs. By 1999, the average OECD tax-to-GDP ratio had risen to 33.8%, the highest recorded level at that time. It fell back slightly between 2001 and 2004, but then rose again between 2005 and 2007 before falling back following the crisis. Taking these changes together the average tax level in the OECD area increased by 1.0 percentage points between 1995 and 2016 (Figure 1.1).
The OECD average conceals the great variety in national tax-to-GDP ratios. In 1965, tax-to-GDP ratios in OECD countries ranged from 10.6% in Turkey to 33.7% in France. By 2016 the corresponding range was from 16.6% in Mexico to 51.6% in Iceland, the latter due to exceptional revenues from one-off stability contributions in 2016. Without this one-off increase in tax revenues in Iceland, the tax-to-GDP ratio in OECD countries in 2016 ranged from 16.6% in Mexico to 46.2% in Denmark. The trend towards higher tax levels over this period reflects the need to finance a significant increase of public sector outlays in almost all OECD countries.
1.2. Tax structures
Tax structures are measured by the share of major taxes in total tax revenue. In 2016, the tax structures of OECD countries varied. Sixteen countries raised the largest part of their revenues from income taxes (both corporate and personal), eleven countries raised the largest part of their revenues from SSCs, and eight countries raised the largest part of their revenues from consumption taxes (including VAT). Taxes on property and payroll taxes played a smaller role in the revenue systems of OECD countries in 2016, both on average and within most countries (Figure 1.5).
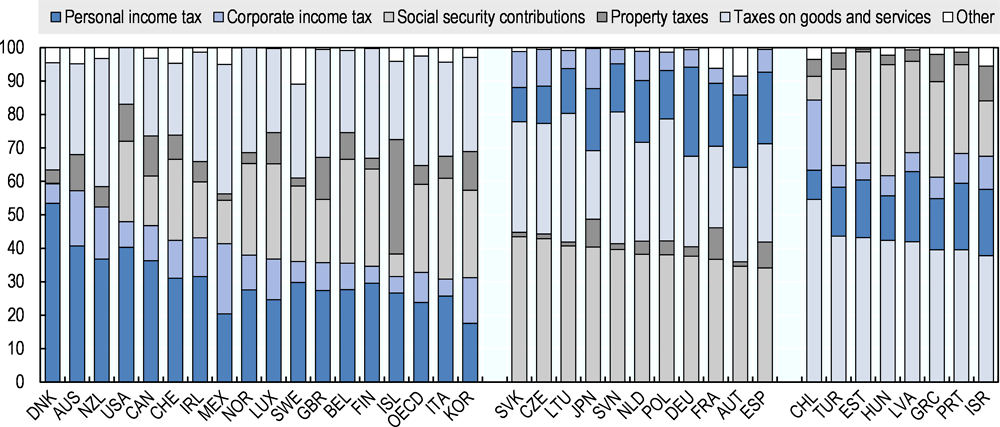
1. Countries are grouped and ranked by those where income tax revenues (personal and corporate) form the highest share of total tax revenues, followed by those where social security contributions, or taxes on goods and services, form the highest share.
2. The OECD average tax structure excludes the one-off revenues from stability contributions in Iceland.
3. The one-off revenues raised by stability contributions in Iceland in 2016 are classified as property taxes. Without these exceptional revenues, personal income taxes would have been the largest source of tax revenues in Iceland in 2016.
Source: Secretariat calculations based on data in chapter 4.
While on average tax levels have generally been rising, the tax structure or tax ‘mix’ has been remarkably stable over time. Nevertheless, several trends have emerged up to 2016 – the latest year for which data is available for all 36 OECD countries.
1.2.1. Taxes on income and profits
On average, in 2016, OECD countries collected 33.6% of their tax revenues through taxes on income and profits (personal and corporate income taxes taken together). Taxes on personal and corporate incomes remain the most important source of revenues used to finance public spending in 16 OECD countries, and in eight of them – Australia, Canada, Denmark, Ireland, Mexico, New Zealand, Switzerland and the United States – the share of income taxes in the tax mix in 2016 exceeded 40%.
1. The OECD average tax revenue in 2016 from main categories excludes the one-off revenues from stability contributions in Iceland.
Source: Secretariat calculations based on tables 3.8 to 3.14.
Within taxes on income and profits, the share of PIT and CIT varies:
-
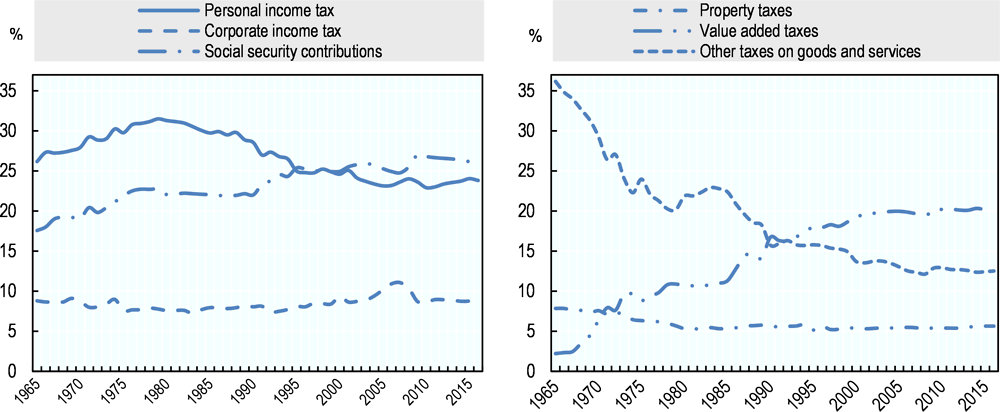
Revenues from personal income taxes are 23.8% of total taxes on average in 2016 compared with around 30% in the 1980s. About two percentage points of this reduction can be attributed to the impact on the average of a number of relatively new entrants to the OECD from Eastern Europe for which tax revenue data is only available from the 1990s onwards. These countries tend to have relatively low personal income tax revenues and high revenues from social security contributions, but this impact is observed in the post 1990 data only.
-
The variation in the share of the personal income tax between countries is considerable. In 2016, it ranged from a low of 8.8% and 10.2% in Chile and the Slovak Republic to 40.8% in Australia and 53.5% in Denmark (Figure 1.5).
-
The sharp fall in the share of revenues from corporate income taxes in total taxation in 2008 and 2009 did not continue into 2011 and 2012, but the share of these taxes in total revenues remains at 9.0% of total tax revenues in 2016, below its 11.1% share in 2007.
-
The share of the corporate income tax in total tax revenues varied considerably across countries from less than 5% (France, Iceland and Slovenia) to 21.0% (Mexico) and 20.9% (Chile) in 2016. Apart from the spread in statutory rates of the corporate income tax, these differences are at least partly explained by institutional and country specific factors, for example:
-
the degree to which firms in a country are incorporated,
-
the breadth of the corporate income tax base, for example some narrowing may occur as a consequence of generous depreciation schemes and of tax incentives,
-
the degree of cyclicality of the corporate tax system, for which one of the important elements are loss offset provisions,
-
the extent of reliance upon tax revenues from the exploitation of oil and/or mineral deposits, and
-
other instruments to postpone the taxation of earned profits.
-
1.2.2. Social security contributions
Social security contributions as a share of total tax revenues on average across the OECD accounted for 26.2% in 2016. They were highest in the Slovak Republic and the Czech Republic (43.5% and 42.9%, respectively). In contrast, Australia and New Zealand do not levy social security contributions.
There is also wide variation across OECD countries in the relative proportions of social security contributions paid by employees and employers (Figure 1.7):
-
Seven countries (Chile, Greece, Israel, Luxembourg, the Netherlands, Poland, and Slovenia) raise more revenues from employee SSCs, whereas the remainder raise more from employer SSCs.
-
The highest share of employee SSC revenues are found in Slovenia, at 20.5% of total revenues. Germany, Greece, Japan, the Netherlands and Slovenia also have employee SSC revenues of over 15% of total tax revenues. Denmark had the lowest share, at 0.1% of total revenues. Apart from Denmark, only Estonia had revenues from employee SSCs of less than 5% of total revenues.
-
The highest share of employer social security contribution revenues are found in Estonia, at 31.5% of total revenues. Lithuania and the Czech Republic also had employer SSC revenues of over 25% of total tax revenues, at 27.6% and 27.2% respectively. Denmark and Chile had the lowest shares, at 0.05% and 0.2% of total revenues respectively.
-
The highest share of self-employed or non-employed social security contribution revenues are found in the Netherlands and the Slovak Republic, at 9.3% and 8.8% of total revenues respectively.
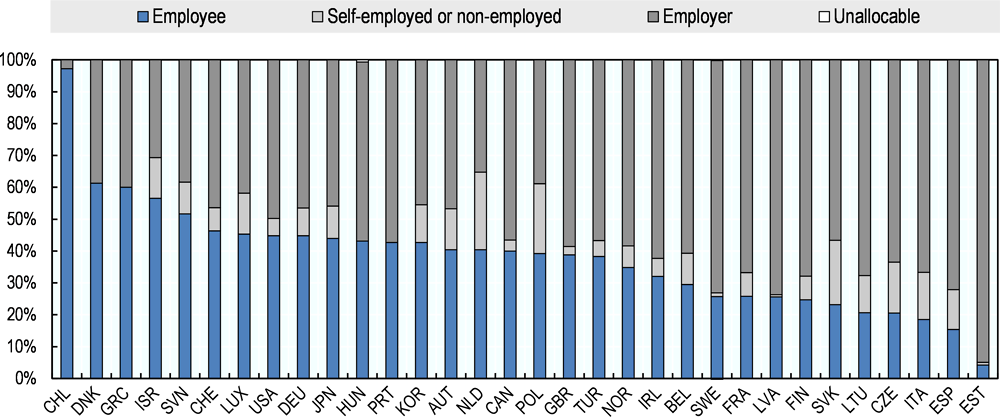
1. Australia, Iceland, Mexico and New Zealand are not included within figure 1.7.Although Iceland and Mexico collect social security contributions, disaggregated data is not available. New Zealand and Australia do not levy social security contributions.
Source: Secretariat calculations based on data in chapter 4.
1.2.3. Property taxes
Between 1965 and 2016, the share of taxes on property fell from 7.9% to 5.7% of total tax revenues on average across the OECD (Figure 1.6). Iceland had the highest share of revenue from property taxes in 2016 (34.2%) although this was due to one-off stability contributions that applied in that year, followed by the United Kingdom (12.6%) and Canada (12.0%). Property taxes accounted for 0.8% of total revenues in Estonia, the lowest of OECD countries:
-
Property taxes accounted for more than 10% of total tax revenue in seven countries in 2016 (Australia, Canada, Iceland, Israel, Korea, the United Kingdom and the United States).
-
Property taxes account for less than 2% of total revenue in seven countries (Austria, Czech Republic, Estonia, Lithuania, Mexico, Slovenia and the Slovak Republic).
1.2.4. Consumption taxes
-
The share of taxes on consumption (general consumption taxes plus specific consumption taxes) fell from 38.4% to 32.7% between 1965 and 2016 (Figure 1.6).
-
During this period, the composition of taxes on goods and services has fundamentally changed. A fast-growing revenue source has been general consumption taxes, especially the value-added tax (VAT) which is now imposed in thirty-five of the thirty-six OECD countries.4
-
General consumption taxes presently account for 20.8% of total tax revenue, compared with only 11.9% in the mid-1960s. In 2016, the vast majority of this was from VAT (20.2% of total tax revenues) (Figure 1.6)
-
The substantially increased importance of the value-added tax has served to counteract the diminishing share of specific consumption taxes, such as excises and custom duties.
-
Between 1975 and 2016 the share of specific taxes on consumption (mostly on tobacco, alcoholic drinks and fuels, as well as some environment-related taxes) have almost halved from 17.7% to 9.8% of total revenues. In 2016, excises were the largest single category of total revenues, accounting for 7.8% of total revenues (Figure 1.8).
-
Rates of taxes on imported goods were considerably reduced across all OECD countries, reflecting a global trend to remove trade barriers.
-
Nevertheless, countries such as Estonia, Mexico, Poland, and Slovenia (around 14%) and Turkey (around 22%) still collect a relatively large proportion of their tax revenues through taxes on specific goods and services.
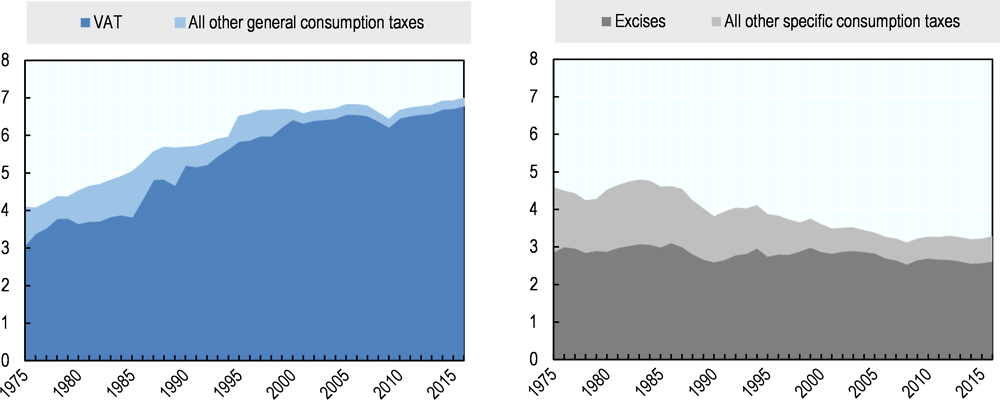
1. The unweighted average for each year includes all countries which report revenue in the categories shown in that year. The OECD averages for 2016 OECD exclude the one-off revenues from stability contributions in Iceland.
Source: Secretariat calculations based on chapter 4.
1.3. Taxes by level of government
This section discusses the relative share of tax revenues attributed to the various sub-sectors of general government in 2016. The different sub-sectors are:
-
Central government
-
State government (federal and regional countries only)
-
Local government
-
Social security funds
-
Supranational (EU countries only)
The guidelines for attributing these revenue shares to the different levels of government are based on the final version of the 2008 System of National Accounts. These guidelines are discussed in the special feature S.1 in the 2011 edition of OECD Revenue Statistics.
1.3.1. Revenues of sub-national governments
Eight OECD countries have a federal structure. Among these countries, central governments received 53.2% of total revenues in 2016 on average. The second-highest share of revenues on average was received by social security funds, which are a sub-sector of general government, at 21.2% of total revenues, followed by 17.6% at the state level and 7.8% at the local level (Table 1.3). However, within countries there was considerable variation around these means:
-
In 2016, the share of central government receipts in the eight federal OECD countries varied from 29.7% in Germany to 79.5% in Australia.
-
In 2016, the share of the states varied from 1.6% in Austria, 4.0% in Mexico and 10.7% in Belgium to 39.9% in Canada. The share of local government varied from 1.5% in Mexico to 15.6% in Switzerland.
-
Between 1975 and 2016 the share of federal government revenues declined by nearly fifteen percentage points in Belgium and to a lesser extent in Canada, Germany and the United States.
-
The share of federal government revenues increased in Austria and Switzerland by around 15 and five percentage points respectively. There was little change in Australia and Mexico.
-
Of the seven federal countries with social security funds, five increased the share of revenue between 1975 and 2016. The exceptions were Canada and Mexico, where the share slightly declined between 1975 (1980 for Mexico due to data availability) and 2016.
Spain is classified as a regional rather than a unitary country because of its highly decentralised political structure. In 2016 the share of central government receipts was 41.6% compared with 14.7% for the regional government. Between 1975 and 2016, the share of local government receipts increased from around 4% to 10% and the share of social security funds declined from 47.5% to 33.2%.
The remaining twenty-seven OECD countries have a unitary structure. In these countries, an average of 63.5% of revenues were derived at the central level, with 24.8% accounted for by social security funds. A further 11.4% were raised by local governments. Among unitary OECD countries:
-
The share of central government receipts in 2016 varied from 33.4% in France and 35.2% in Switzerland to 93.3% in New Zealand.
-
The local government share varied from 1.0% in Estonia to 35.4% in Sweden.
-
Between 1975 and 2016 there have been shifts to local government of 5 percentage points or more in five countries – France, Italy, Korea, Portugal and Sweden and a smaller increase in the Netherlands. Shifts of 5 percentage points or more in the other direction occurred in three countries – Ireland, Norway and the United Kingdom.5
-
Between 1975 and 2016, there were increases in the share of social security funds of 7 or more percentage points in four countries – Finland, France, Japan and Korea and corresponding decreases in four other countries – Italy, Norway, Portugal and Sweden.
The ‘supranational’ column of Table 1.3 and Table 1.4 report taxes collected on behalf of the European Union (EU) by the twenty-three EU member states that are members of the OECD. For years prior to 1998, customs duties collected on behalf of the EU by national tax administrations of the EU member states are included under heading 5123.6 From 1998 onwards they are shown as a memorandum item since they represent a tax imposed by the EU and collected by national administrations.
1.3.2. Composition of central and sub central revenues
Figure 1.9 shows the revenues from each major category of tax revenue for central and sub central governments. For federal and regional countries, the sub central level includes revenues received by both state and local governments. Figure 1.9 demonstrates that:
-
Central government revenues in almost all OECD countries are predominantly derived from income and goods and services taxes, with a negligible share from property taxes.
-
At the subnational level, revenue from property taxes provides a much larger share of revenues than at the central level, and accounts for over 90% of revenues in four countries (Israel, Ireland, Greece and the United Kingdom).
-
By contrast, the share of income taxes and goods and services taxes is lower at the sub-central level, the exceptions being Finland, Luxembourg and Sweden, where over 90% of sub-central revenues are derived from income taxes.
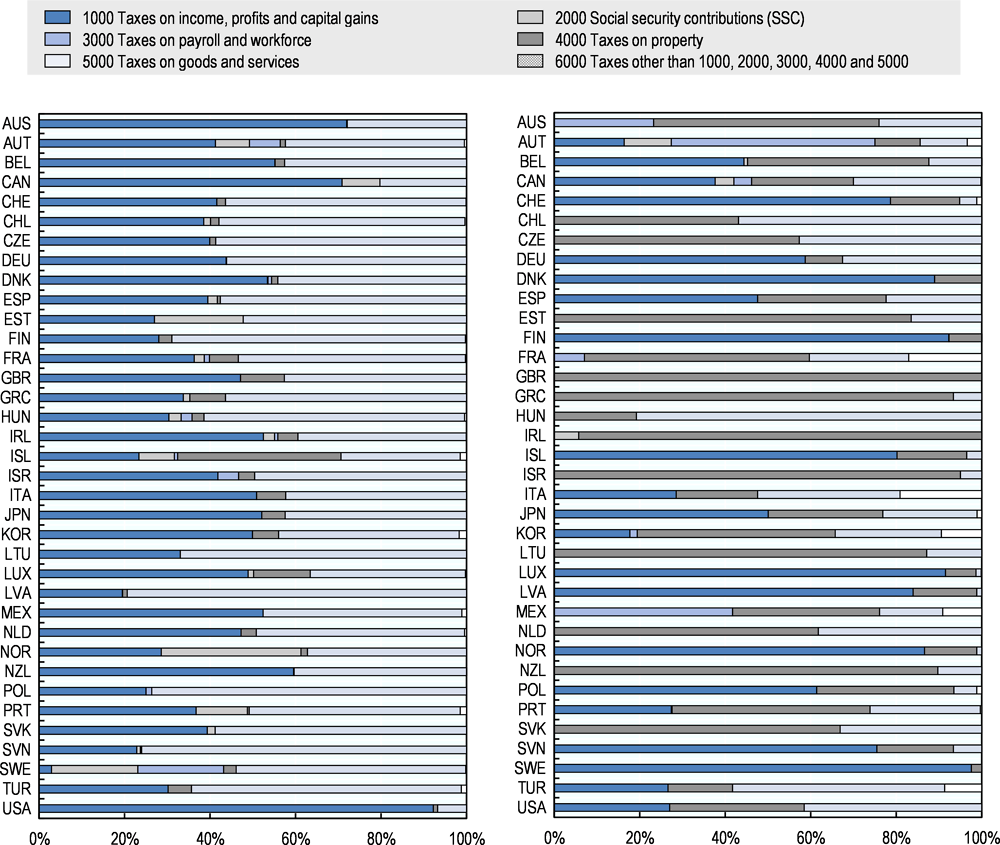
1. The left-hand panel (a) refers to only those taxes which are classified as central government taxes. Social security contributions paid to social security funds are excluded. The right-hand panel (b) refers only to those taxes which are classified as sub-central taxes (local and (where relevant) state taxes). Social security contributions paid to social security funds are excluded.
2. The one-off revenues raised by stability contributions in Iceland in 2016 are classified as property taxes collected by the central government. Without these exceptional revenues, personal income taxes would have been the largest source of revenues for Iceland’s central government in 2016.
Source: Secretariat calculations based on tables 3.16 to 3.18.
1.4. Non-wastable tax credits
There are two kinds of tax credits that apply to income taxes (both personal and corporate):
-
Non-payable or wastable tax credits are those that can only ever be used to reduce or eliminate a tax liability. They cannot be paid out to either taxpayers or non-tax payers as a benefit. They are, therefore, the same as a tax allowance or relief.
-
In contrast, payable or non-wastable tax credits can be partitioned into two parts. One part is used to reduce or eliminate a tax liability in the same way as a wastable tax credit. The other part can be paid directly to recipients as a benefit payment, when the benefit exceeds the tax liability.
The OECD methodology for classifying non-wastable tax credits is set out in paragraphs 19 and 20 of the Interpretative Guide. This states that only the part of a non-wastable tax credit that is used to reduce or eliminate a taxpayer’s tax liability should be subtracted in the reporting of tax revenues. This is referred to as the ‘tax expenditure component’ of the credit. In contrast, the part of the tax credit that exceeds the taxpayer’s tax liability and is paid to that taxpayer is treated as an expenditure item and not subtracted in the reporting of tax revenues. This part is referred to as the ‘transfer component’.
Table 1.6 provides information on the non-wastable tax credits in 2016 for those countries reporting them in the Revenue Statistics 2018 (though it may be that some countries with non-wastable tax credits do not appear in the table). It shows the amounts of the non-wastable tax credits and their two components together with the results of using the figures to calculate tax revenue values and the associated tax-to-GDP ratios.
Table 1.6 also shows two alternative treatments:
-
The ‘net basis’ which treats non-wastable tax credits entirely as tax provisions, so that the full value of the tax credit reduces reported tax revenues, as shown in columns 4 and 7.
-
The ‘gross basis’ is the exact opposite, treating non-wastable tax credits entirely as expenditure provisions, with neither the transfer component nor the tax expenditure component being deducted from tax revenue, as shown in columns 6 and 9. This is the approach followed by the GFSM and the SNA.
Table 1.6 shows that, with some exceptions, the choice of method for reporting non-wastable tax credits has only a small impact on the ratio of total tax revenue to GDP. For the countries with available data, the differences between the ratios on a net basis and on a gross basis are one percentage point or more in only France, Germany and the United Kingdom, and between half a percentage point and one percentage point in Australia, Canada, Czech Republic, Italy, New Zealand and the United States.
Notes
← 1. Provisional 2017 figures are not available for Australia and provisional figures on social security contributions in Japan are also not available as at the time Revenue Statistics 2018 was published.
← 2. Calculated by applying the unweighted average percentage change for 2017 in the 34 countries providing data for that year to the overall average tax-to-GDP ratio in 2016.
← 3. As provisional 2017 figures are not available for Australia and Japan, the change in the tax-to-GDP ratio is calculated between 2007 and 2016.
← 4. The terms “value added tax” and “VAT” are used to refer to any national tax that embodies the basic features of a value added tax by whatever name or acronym it is known e.g. “Goods and Services Tax” (“GST”).
← 5. For 1975, please see table 1.4 of Revenue Statistics 2018.
← 6. From 1998 onwards, these custom duties are shown as a ‘memorandum’ item since they represent a tax imposed by the EU and collected by national administrations. However, they continue to be part of the aggregate revenue figures that represent all taxes imposed within the territory of EU member states. This approach ensures consistency of the time series, and ensures that the tax-to-GDP ratio measures are immune to changes in the relative share of customs duties in (1) the composition of EU financing resources and (2) national tax mixes of EU member states.