The geography of well-being
Understanding how and to what extent economic growth translates into better lives for people is important to both citizens and policy makers. A crucial step in answering these questions is having the right tools to assess people’s living conditions. While gross domestic product (GDP) has for a long time been the most used proxy for measuring well-being, it fails to account for the actual quality of life experienced by people. The growth of GDP per capita does not always translate into better life for people. Household income and GDP per capita in OECD regions, for example, are on average positively correlated, but the same trend is not followed everywhere.
At the regional level, well-being is measured through eleven topics covering both material conditions (income, jobs, housing) and quality of life (health, education, safety, environmental quality, civic engagement, access to services, community, and life satisfaction). For the first time subjective indicators are included in the regional framework to measure community and life satisfaction.
Shifting from GDP to well-being indicators that focus on people’s outcomes makes the issue of regional disparities within countries broader for policy makers. A certain concentration of production in space can be beneficial for overall economic growth thanks, among other things, to agglomeration economies. However, the spread of benefits across all regions is an important objective for policy makers who want to ensure equal opportunities in education, access to jobs and health across regions.
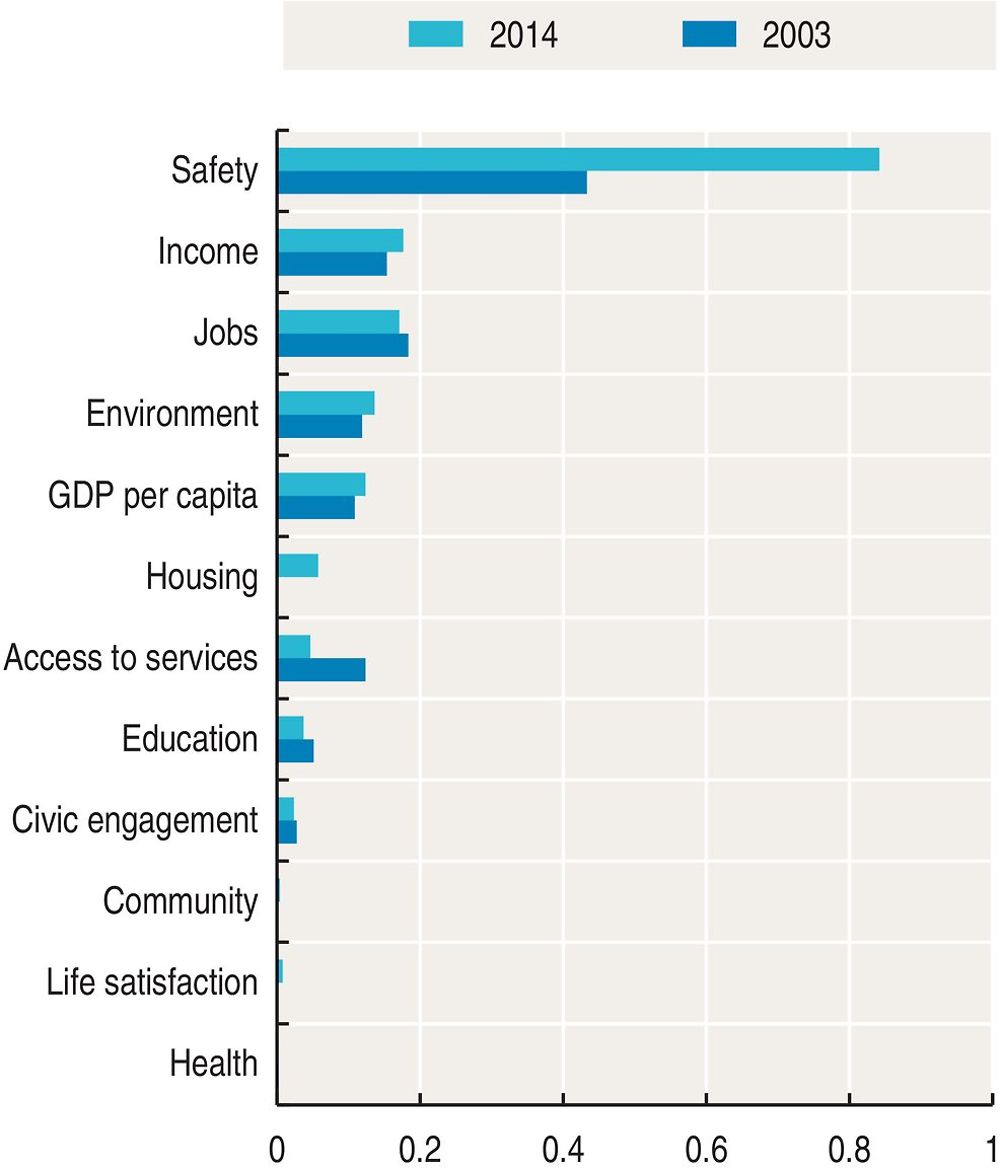
Considering all OECD regions, the highest levels of regional disparities, as measured through the Theil entropy index, are observed in safety (homicide rate) and income (income per capita), with disparities that have increased in both dimensions in the past decade (Figure 1.1).
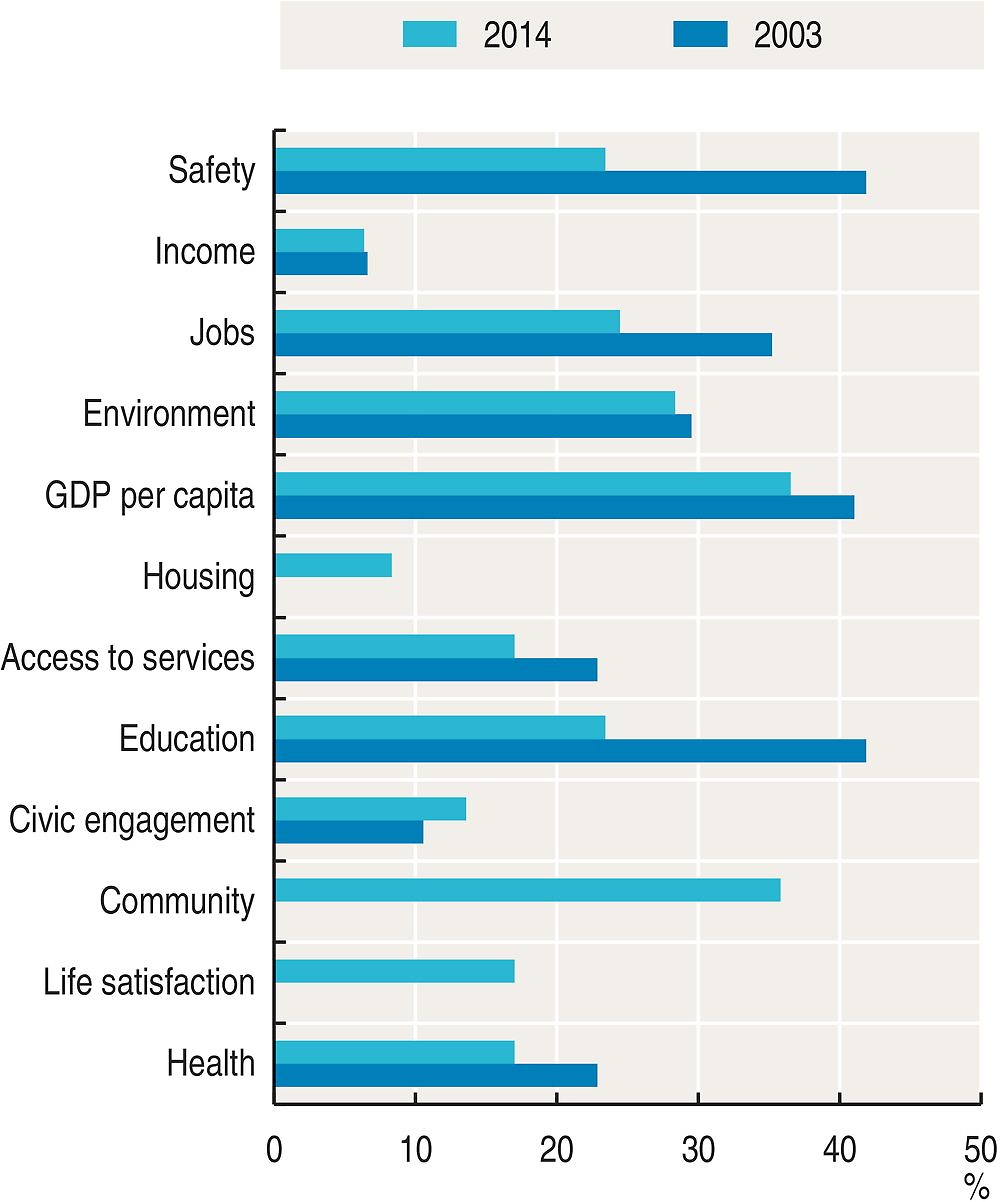
Part of the observed regional disparities are due to differences between countries and part to differences among regions within a country. Around one-quarter or more of the observed disparities in safety, jobs, environment, education, community, and GDP per capita are explained by disparities within the same country (Figure 1.2).
The typology of regions, whether urban or rural, partially explains differences in well-being outcomes. For simplicity, a region is considered mostly urban if more than 70% of its population lives in a functional urban area – this is a definition that is consistent across countries and that does not rely on local administrative boundaries. People living in mostly urban regions have, on average, higher significant well-being outcomes in income, access to services, housing and education than those living in other areas. However, they experience significantly worse values for air pollution (environment) (Figure 1.3).
The Theil entropy index is a measure of inequality among all regions in the OECD. The index takes on values between 0 and infinity, with zero interpreted as no disparity. It can be decomposed in a “within country” and “between country” component so that the sum of the two equals the total entropy. The index assigns equal weight to each region regardless of its size; therefore differences in the values of the index among countries may be partially due to differences in the average size of regions in each country (see Annex C for details).
In Figure 1.3, mostly urban regions are defined as TL2 regions with at least 70% of their population living in a functional urban area located within the TL2 region (see Annex A for details).
Source
OECD (2015), OECD Regional Statistics (database), https://doi.org/10.1787/region-data-en.
Reference years and territorial level
2003-14; TL2 (TL3 for Estonia).
The classification of mostly urban regions does not include Iceland, Israel, New Zealand and Turkey for lack of data on functional urban area.
Further information
OECD (2015), How's Life? 2015: Measuring Well-being, OECD Publishing, Paris, https://doi.org/10.1787/how_life-2015-en.
OECD (2014), How's Life in Your Region?: Measuring Regional and Local Well-being for Policy Making, OECD Publishing, Paris, https://doi.org/10.1787/9789264217416-en.
Veneri, P. and F. Murtin (2016), “Where is inclusive growth happening? Mapping multi-dimensional living standards in OECD regions”, OECD Statistics Working Papers, No. 2016/01, OECD Publishing, Paris, https://doi.org/10.1787/5jm3nptzwsxq-en.
OECD Regional Well-Being: www.oecdregionalwellbeing.org.
Figure notes
1.1- 1.3: The available years may differ for the different indicators (see Annex B for details).
1.3: A value higher than 100 indicates relatively better well-being outcomes in mostly urban regions. To this end, the inverse of the indicators homicide, unemployment and air pollution was used since for such indicators a higher value represents a worse situation. The difference between urban and rural regions is statistically significant only for the dimensions GDP per capita, income, access to services, housing, education and environment.
Information on data for Israel: https://doi.org/10.1787/888932315602.


