Regional patterns of co-patenting
The percentage of regional patent applications with co-inventors from another region, whether or not they belong to the same country, is an indicator of co-operation activity between the two regions.
More than 70% of patents in OECD countries are applied for by two or more inventors. The share of co-patenting in the total Patent Cooperation Treaty (PCT) applications can be high for patenting leader countries (such as the United States and Germany), small economies (such as Iceland and Latvia) and emerging economies (such as India). For most of the countries, the share of patents with co-inventors increased over the last 15 years, and most significantly in Estonia, Iceland, Portugal and Greece; while it decreased in Japan and Luxembourg (Figure 2.55).
The propensity to co-patent with co-inventors from the same TL3 region (average 50%) is higher than with co-inventors from other regions in the same country (average 29%) and from foreign regions (average 21%). Slovenia, Turkey, Japan and Chile show the highest propensity to co-patent within the same region. Japan, Korea, Turkey, and the United States co-patent domestically and show the lowest propensity to co-patent beyond national borders. By contrast, Estonia, Greece, Mexico and Chile – which have a low level of patenting in general – seem more oriented toward international co-operation (Figure 2.56).
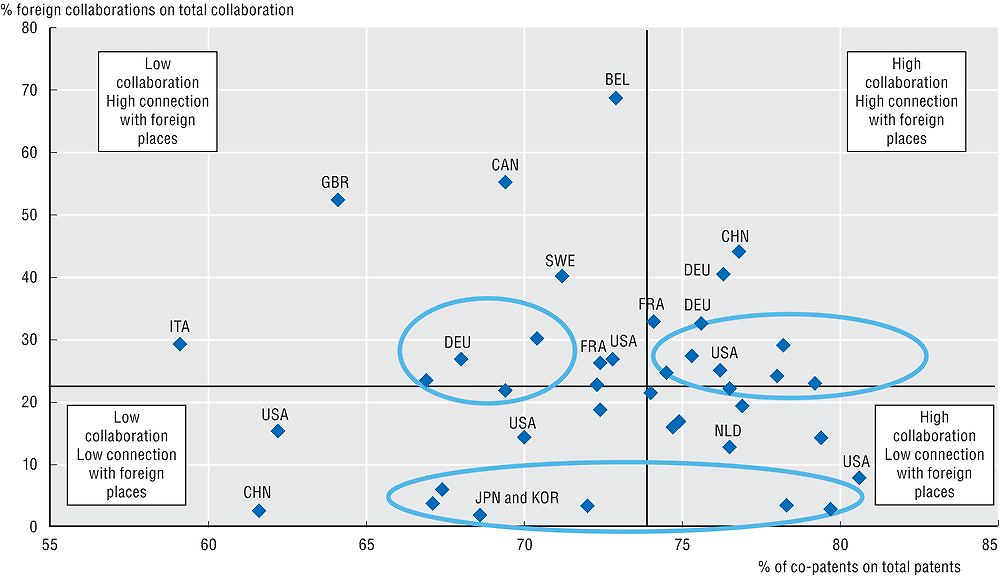
Among the 40 regions with the highest number of patent applications, different patterns of collaboration emerge. Top patenting regions such as the region of Flanders (Belgium) and Ontario (Canada) display a high share of collaboration and are relatively more connected with other foreign hubs. The top ranking regions in Asian countries show a lower propensity to collaborate in patenting in general and with foreign regions, exceptions being Shanghai and Beijing. States in the United States show a relatively low share of international collaboration – given their already large pool of domestic co-patenting partners – although it has increased since 1995-97 (Figure 2.57).
A patent is an exclusive right granted for an invention, which is a product or a process with industrial applicability that provides, in general, a new way of doing something or offers a new technical solution to a problem (“inventive step”). A patent provides protection for the invention to the owner of the patent. The protection is granted for a limited period, generally 20 years.
Data refer to overall patent applications to Patent Co-operation Treaty (PCT) applications.
Patent documents report the inventors (where the invention takes place), as well as the applicants (owners), along with their addresses and country of residence. Patent counts are based on the inventor’s region of residence and fractional counts. If two or more inventors are registered on the patent document, the patent is classified as a co-patent.
The number of foreign co-inventors is defined as the number of co-inventors that reside/work in a region outside national borders.
Source
OECD (2015), OECD Regional Statistics (database), https://doi.org/10.1787/region-data-en.
See Annex B for data, source and country-related metadata.
Reference years and territorial level
2010-12 average.
TL3 regions, TL2 regions for Brazil, China, India and South Africa.
Further information
OECD (2009), OECD Patent Statistics Manual, OECD Publishing, Paris, https://doi.org/10.1787/9789264056442-en.
Figure notes
2.57: TL2 regions; 2010-12 average increase or decrease compared to 1995-97 average. The x- and y- axes are centred to the median among regions.
Information on data for Israel: https://doi.org/10.1787/888932315602.