Spatial productivity differences within and across regions
In OECD countries, 60% of spatial disparities in productivity are found within the same large (TL2) region.
Productivity in OECD regions has a strong spatial dimension, i.e. it differs widely between neighbouring areas and depends on local factors. Even within the same large region (TL2), the most productive smaller area (TL3) is on average 56% more productive than the least productive one. Spatial differences in productivity within large (TL2) regions are particularly stark in the United Kingdom and Korea, which is partly due to very high productivity levels in the areas encompassing the capital city compared to surrounding areas (Figure 1.13).
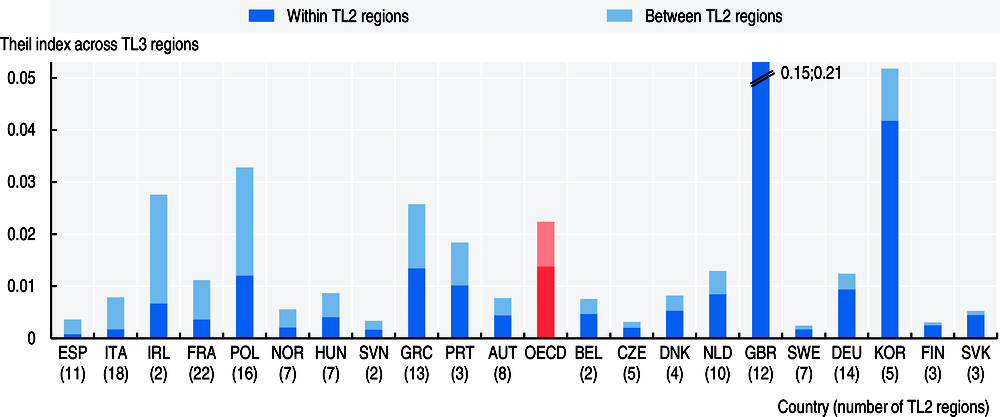
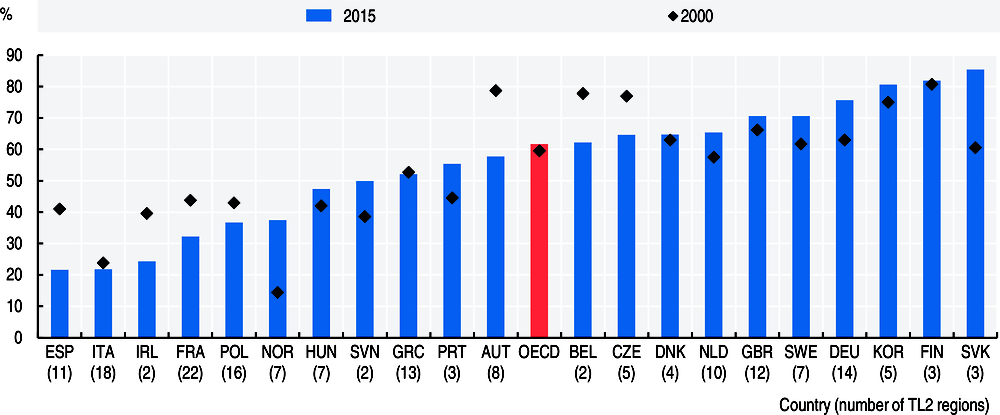
In 14 of 22 OECD countries considered, productivity differences between TL3 regions are predominantly driven by contrasts in productivity within the same larger region. For example, spatial productivity disparities in Germany are larger between the Kreise (TL3) of the same Länder than across different Länder (TL2) of the country (Figure 1.14). Intraregional productivity differences account, on average, for 60% of total disparities in productivity across all TL3 regions in a country. Such disparities are most pronounced in the Slovak Republic, Finland, and Korea, where more than 80% of the total disparities among all TL3 regions is explained by differences within the same TL2 region. In the majority of countries, the proportion of spatial disparities in productivity within the same large region increased between 2000 and 2015. This rise was highest in Norway, with an increase of more than 61%.
Theil index inequality in productivity (GDP per worker at place of work) across TL3 regions is decomposed in two components: a) inequality within TL2 large regions (across TL3 small regions inside TL2 regions) and b) inequality between TL2 regions. The Theil index measures total spatial disparities and it is the sum of the inequalities within and between TL2 regions.
The Frontier is the region leading its country in terms of labour productivity, measured by the real gross domestic product per employee. In some countries the leading region accounts for a small percentage of the total workforce. Where this is the case, the frontier is the weighted average of regions with the highest labour productivity levels accounting for 10% of the country’s total employment.
Catching-up/diverging/keeping pace regions is a classification of regions based on their labour productivity growth relative to the frontier. It is based on the growth in labour productivity between 2000 and 2015 (or closest year available). Regions where labour productivity grew/dropped by at least 5 percentage points more/less than in the frontier are classified as catching-up/diverging regions, with regions that are keeping pace falling within the +/- 5 percentage points band.
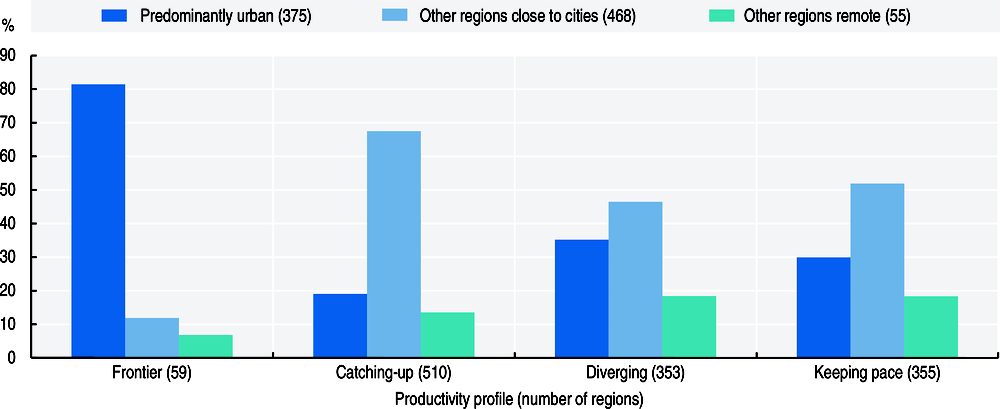
The differences in productivity within TL2 regions are particularly marked between urban areas and remote rural areas. While the vast majority of a country’s most productive regions (known as ‘the frontier’), consist of regions with a predominantly urban population, remote regions are overrepresented in the group of diverging, or ‘lagging’ regions (Figure 1.15). In contrast, those regions that manage to catch up – i.e. regions that generate higher productivity growth than that of the national frontier – are mostly intermediate or rural regions that benefit from proximity to cities and their agglomeration economies. Remote regions only make up 14% of ‘catching up’ regions (i.e. those regions that successfully narrow the productivity gap versus the most productive regions in their country).
Source
OECD (2018), OECD Regional Statistics (database), https://doi.org/10.1787/region-data-en.
See Annex A for the methodology to define regional typology.
Reference years and territorial level
2000-15, TL3 and TL2.
Further information
OECD (2016), OECD Regional Outlook 2016: Productive Regions for Inclusive Societies, OECD Publishing, Paris, https://doi.org/10.1787/9789264260245-en.
Figure notes
1.13-1.14: TL2 regions composed by only one TL3 region have been removed from the calculation. First year 2000, or first available year: Korea, 2008.