Regional foreign-born population and changes over time
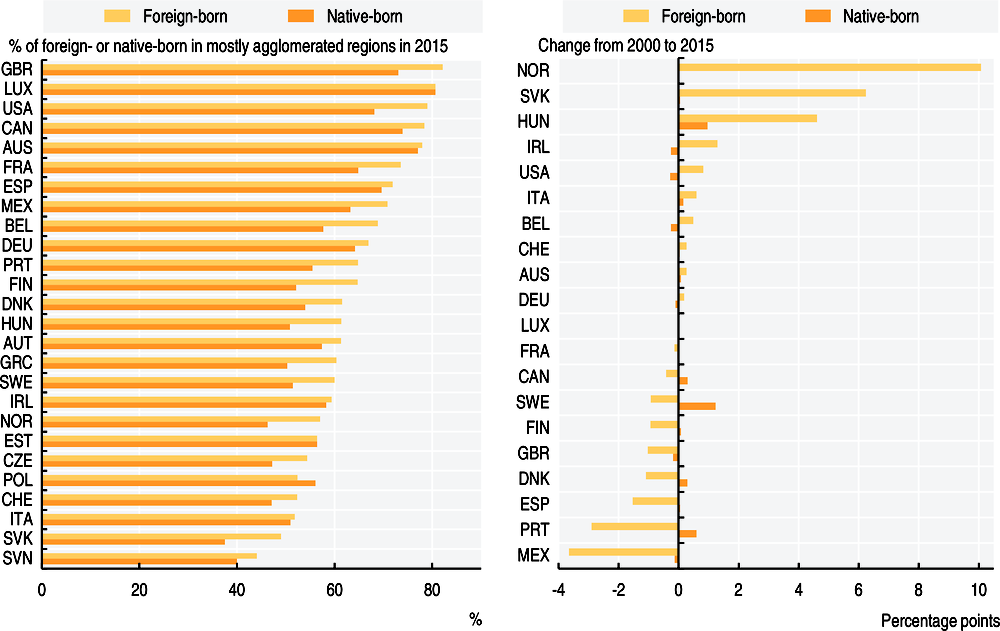
In the OECD, two-thirds of the foreign-born population live in regions with large agglomerations, six percentage points more than the native-born population.
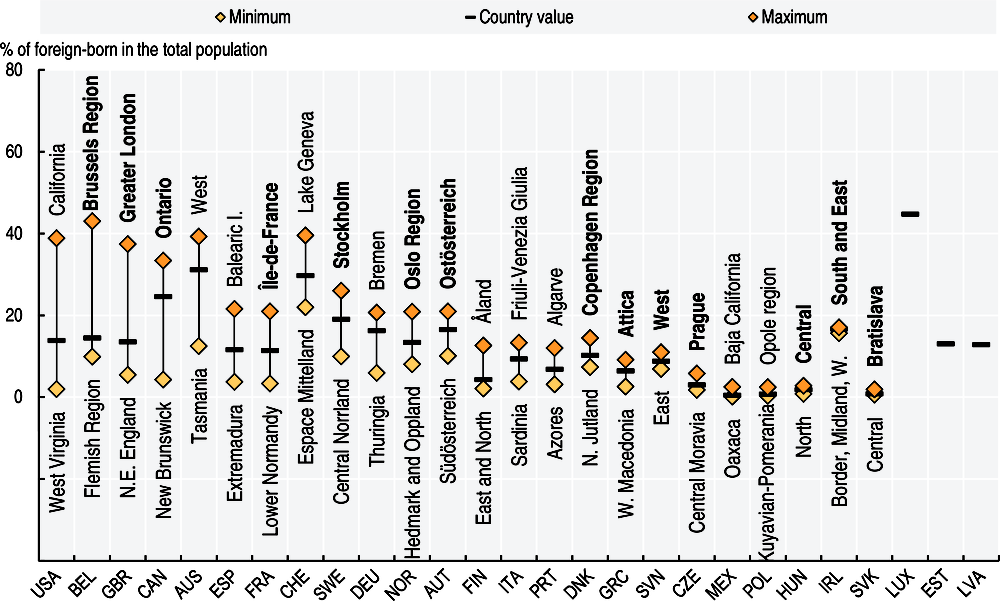
Across OECD regions, around 10% of the total population is foreign-born. Capital regions (i.e., the regions where the capital cities are located) record the highest shares of migrants in the majority of OECD countries (in 14 out of 24 countries) (Figure 3.13).
The foreign-born population is more concentrated than the native-born population. Close to two-thirds of the foreign-born population live in “mostly agglomerated” regions (see Definition below) across the OECD, 6 percentage points more than the average of the native-born population (58%). In 24 out of the 26 countries covered (with the exception of the Slovak Republic and Slovenia), at least half of the total migrant population live in mostly agglomerated regions (Figure 3.14).
Migrants are defined by place of birth. The foreign-born or migrant population is defined as the population born in a country different from the one of residence. Unlike citizenship, this criterion does not change over time, it is not subject to country differences in legislation and it is thus adequate for international comparisons. As such, the terms “foreign-born” and “migrants” will be used interchangeably in the following sections.
TL2 regions are classified into two types: i) “mostly agglomerated”; and ii) “non-agglomerated”. The methodology employed in building this classification is mainly based on the share of regional population living in functional urban areas (FUAs). A FUA usually encompasses a cluster of contiguous municipalities that have a high-density core and a functionally connected commuting zone (OECD, 2012). A TL2 region is classified as mostly agglomerated if the share of the regional population living in FUAs is above 70% or if part of the regional population lives in a metropolitan area with more than 1.5 million inhabitants. In all other cases, regions are classified as non- agglomerated.
Large disparities are also observed in the regional distribution of migrants across OECD countries. For example, with similar overall shares of foreign-born in total country population (around 14%), the United States, Belgium, and the United Kingdom display close to twice the variation in their regional distribution of migrants than Spain, France, and Norway. In Australia, Switzerland and Ireland, the share of migrants is above 12% in all regions; while in the Slovak Republic, Hungary, and Poland, the share of foreign-born population is less than 3% in all regions (Figure 3.13 and 3.15).
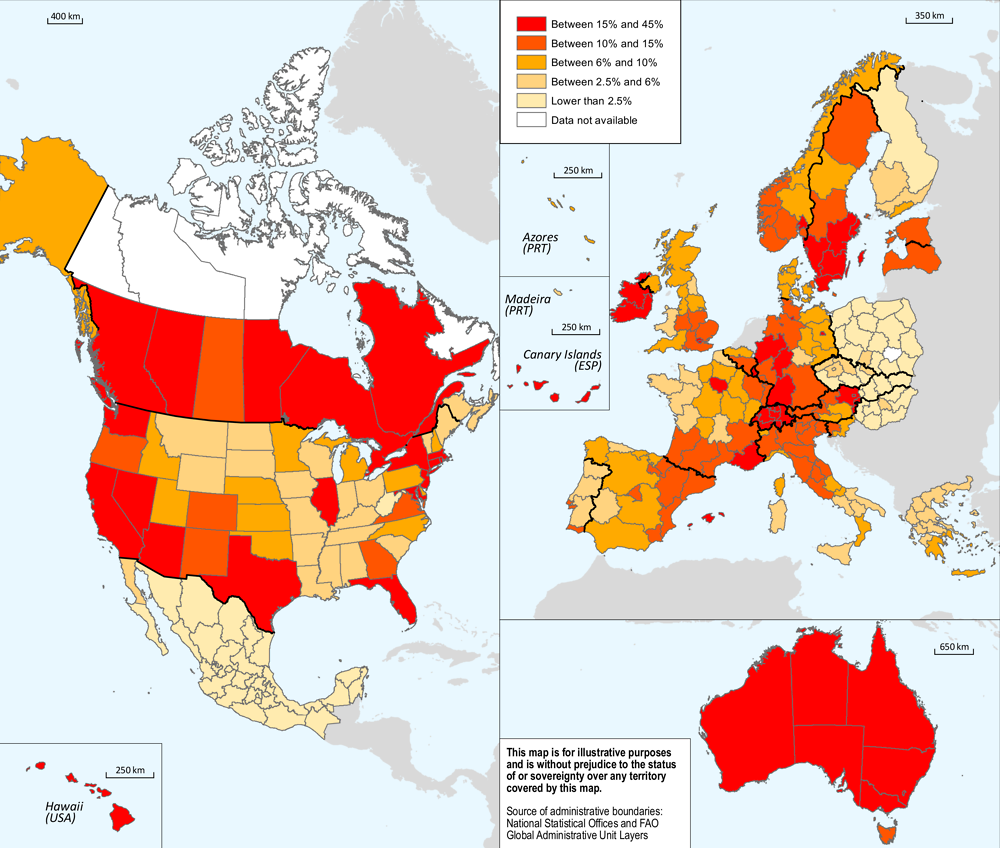
Note: Intervals correspond to quintiles.
While for OECD countries the change in the presence of migrants from 2005 to 2015 has been, on average, relatively low (around 2 percentage points), it differed significantly across OECD large regions (TL2). For example, in Hedmark and Oppland (Norway), Corsica (France) and Tasmania (Australia) the presence of migrants has dropped by more than 6.5 percentage points; whereas, in Greater London (United Kingdom), Bremen (Germany), Oslo and Akershus (Norway), California (United States), and Brussels (Belgium), the share of foreign-born has increased by more than 7 percentage points (Figure 3.16). Across European regions, on average, the composition of the foreign-born population by place of origin is very well balanced; with 40% of total migrants being natives of other European countries.
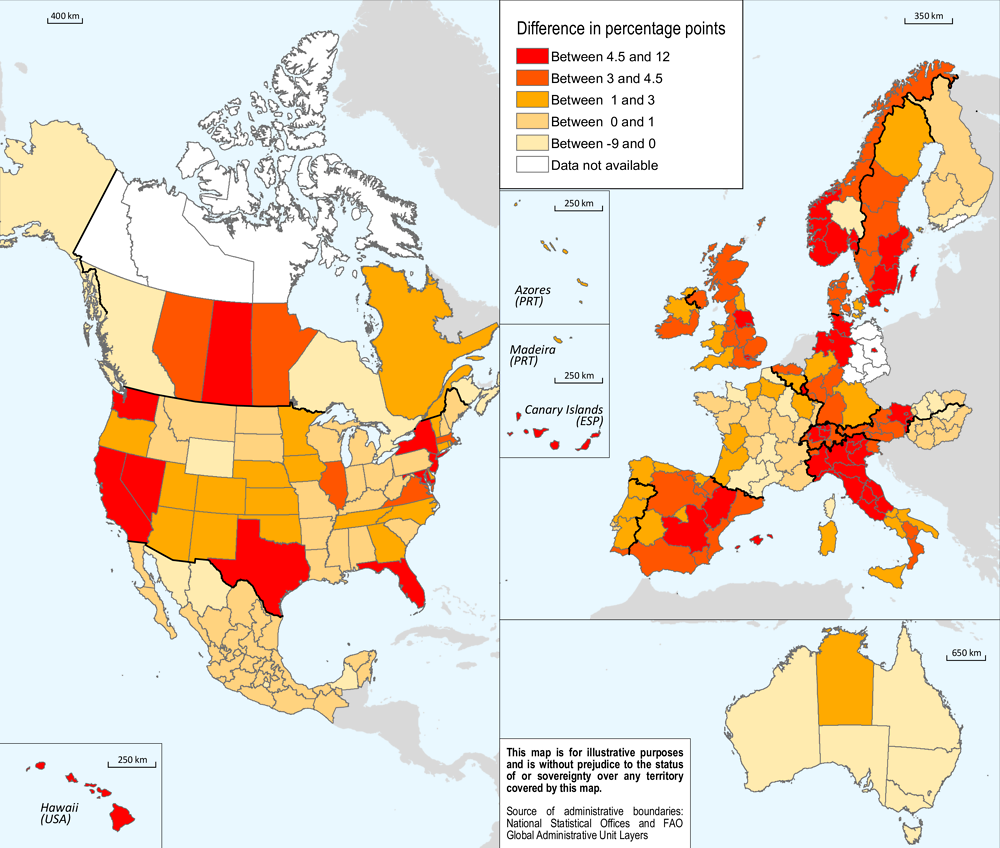
Note: Intervals correspond to quintiles.
Source
OECD (2018), OECD Regional Statistics (database), https://doi.org/10.1787/region-data-en.
See Annex B for data sources and country-related metadata.
Reference years and territorial level
2005 and 2015; 2014-2015 (two-year average) for Europe and US; TL2, except for Austria, where data is only available at the NUTS1 level.
Further information
Territorial grids and regional typology (Annex A)
Diaz Ramirez, M., et al. (2018), “The integration of migrants in OECD regions: A first assessment”, OECD Regional Development Working Papers, No. 2018/01, OECD Publishing, Paris. https://doi.org/10.1787/fb089d9a-en
OECD (2012), Redefining “Urban”: A New Way to Measure Metropolitan Areas, OECD Publishing, Paris, https://doi.org/10.1787/9789264174108-en.
Figure notes
3.13: The shares of foreign-born refer to the population 15 years old or older. Capital regions are highlighted in bold in the figure.
3.14: Panel A: Percentage of respective place-of-birth population. Panel B: Difference between the percentage in 2014-2015 (two-year average) and the one in 2005.