Elderly dependency ratios in regions
With as many as three elderly persons for every 10 working-age persons, rural regions face more challenges than other places in ensuring the welfare of their senior citizens.
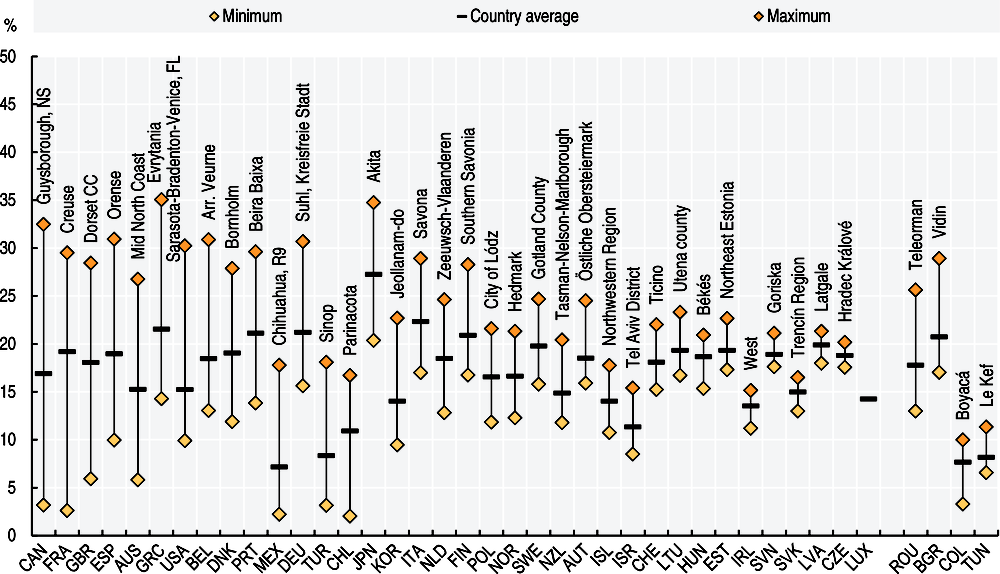
Ageing can have a major impact on the labour market and on the financing of certain pension systems (e.g. pay-as-you-go pension plans), as well as on the expenditure for health services for the elderly. In OECD countries, the elderly population represents 16.7% of the total population (Figure 3.7). Nevertheless, larger concentrations of the elderly can be observed in small and less urbanised regions (i.e. TL3 regions with predominantly rural population). For example, in 33 TL3 regions – Japan (19), Canada (8), Germany (2), Belgium (1), Greece (1), Spain (1), and the United States (1) – the elderly population is greater than 30%; of these regions, 20 are classified as predominantly rural and 13 as intermediate. Large disparities within countries are also observed in Canada, France, the United Kingdom, Mexico, Spain, Australia, Greece and the United States. In these countries, the difference between the region with the highest and the lowest share of elderly population is above 20 percentage points.
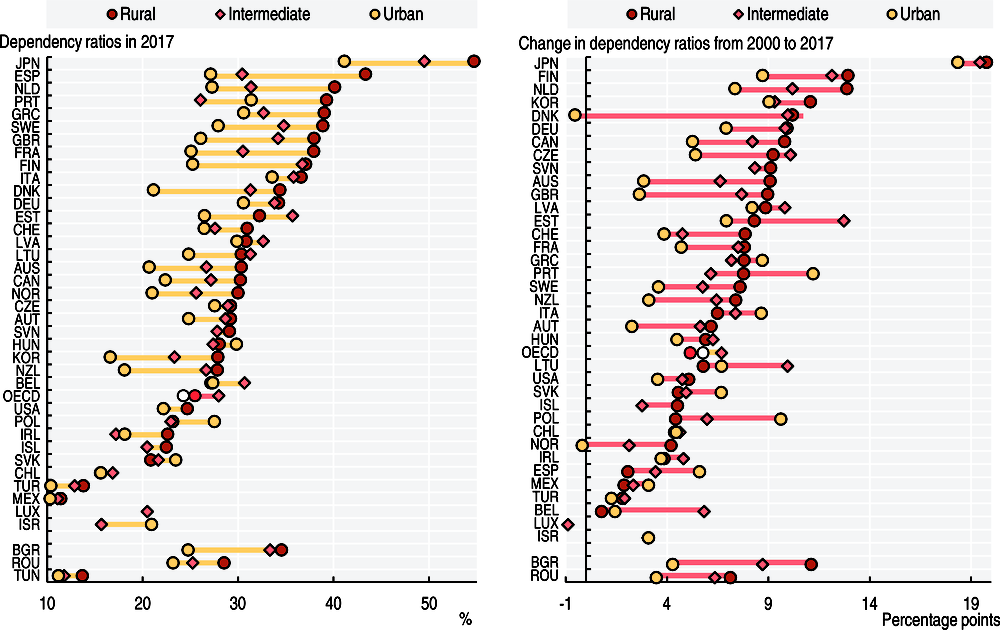
The elderly dependency rate gives an indication of the pressure on the typically economically-active population (15-64 years old) from the typically retired population (65 years old and over). In 2016, the elderly population represented one fourth of the total working-age population across OECD regions. On average, elderly dependency rates are around 31% in predominantly rural regions, 6 percentage points higher than in urban regions. In the rural areas of Japan, Spain and the Netherlands, elderly dependency rates are above 40%; whereas in the rural areas of Mexico, Turkey and Chile they are below 20% (Figure 3.8).
The elderly population is the population aged 65 years and over; while the elderly dependency rate is defined as the ratio between the elderly population and the working age population (15-64 years).
Compared to other types of regions, regions with predominantly rural population have been facing higher increases in the elderly dependency rates in the last 17 years. On average, from 2000 to 2017, elderly dependency rates have increased by 6 percentage points in the OECD. The highest growth has been observed in predominantly rural regions (7 percentage points), while the lowest is reported in predominantly urban regions (5 percentage points) (Figure 3.8). This trend might challenge the provision of services in the most rapidly ageing regions.
Source
OECD (2018), OECD Regional Statistics (database), https://doi.org/10.1787/region-data-en.
See Annex B for data sources and country-related metadata.
Reference years and territorial level
2000-2017; TL3.
Further information
Territorial grids and regional typology (Annex A).
Eurostat (2013), Urban-Rural typology, http://ec.europa.eu/eurostat/web/rural-development/methodology.
Figure notes
3.7: 2016 was the latest available year for Australia, the United States, Japan, New Zealand, Colombia, and Tunisia; 2015 for Russia; 2014 for China, Brazil, Peru, and South Africa.
3.8: First available year was 2001 for Japan, Australia; 2002 for Chile, and Romania; 2003 for the Netherlands; and 2008 for Turkey. Last available year was 2016 for Japan, Australia, New Zealand, and the United States.