Regional population and changes over time
During the past two decades, urban populations have been gradually increasing in the OECD area.
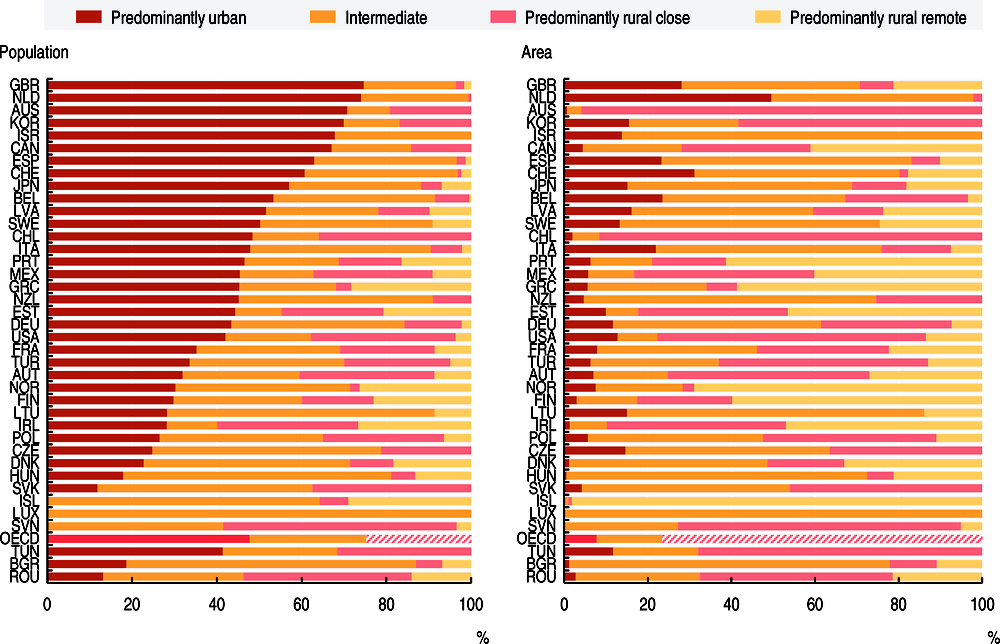
Demographic trends such as population growth can strongly affect economic, social, and environmental conditions that consequently shape national and regional policies. In 2017, around half of the population of the OECD (48%) lived in regions with predominantly urban population (“predominantly urban regions”), which represented only 8% of the total OECD surface area. The remaining population lived in either intermediate regions (27%) or in regions with predominantly rural population (“predominantly rural regions”) (Figure 3.1).
OECD has established a regional typology to take into account geographical differences and enable meaningful comparisons between regions belonging to the same type. All regions in a country have been classified as predominantly rural, intermediate or predominantly urban. This typology has been refined by introducing a criterion of distance (driving time) to large urban centres. Thus a predominantly rural region is classified as predominantly rural remote (PRR) if at least 50% of the regional population needs more than one hour to reach a large urban centre by motor vehicle; otherwise, the rural region is classified as predominantly rural close to a city (PRC). The extended typology has been applied to North America, Europe and Japan (see Annex A for the detailed methodology). In the case of Europe, the classification in predominantly urban and predominantly rural regions is reported following the population-grid based classification developed by Eurostat (2013).
In the United Kingdom, the Netherlands, Australia, Korea, Israel and Canada, two-thirds of people lived in regions with predominantly urban population. In contrast, in Ireland, Slovenia, Romania, Estonia, Austria, Finland, the United States, and the Slovak Republic, regions with predominantly rural population accounted for over 37% of the total country population – 1.5 times the OECD average. In Lithuania, Sweden, Norway, Greece, Iceland, Switzerland and Hungary more than two-thirds of the total rural population lives in remote rural regions (Figure 3.1).
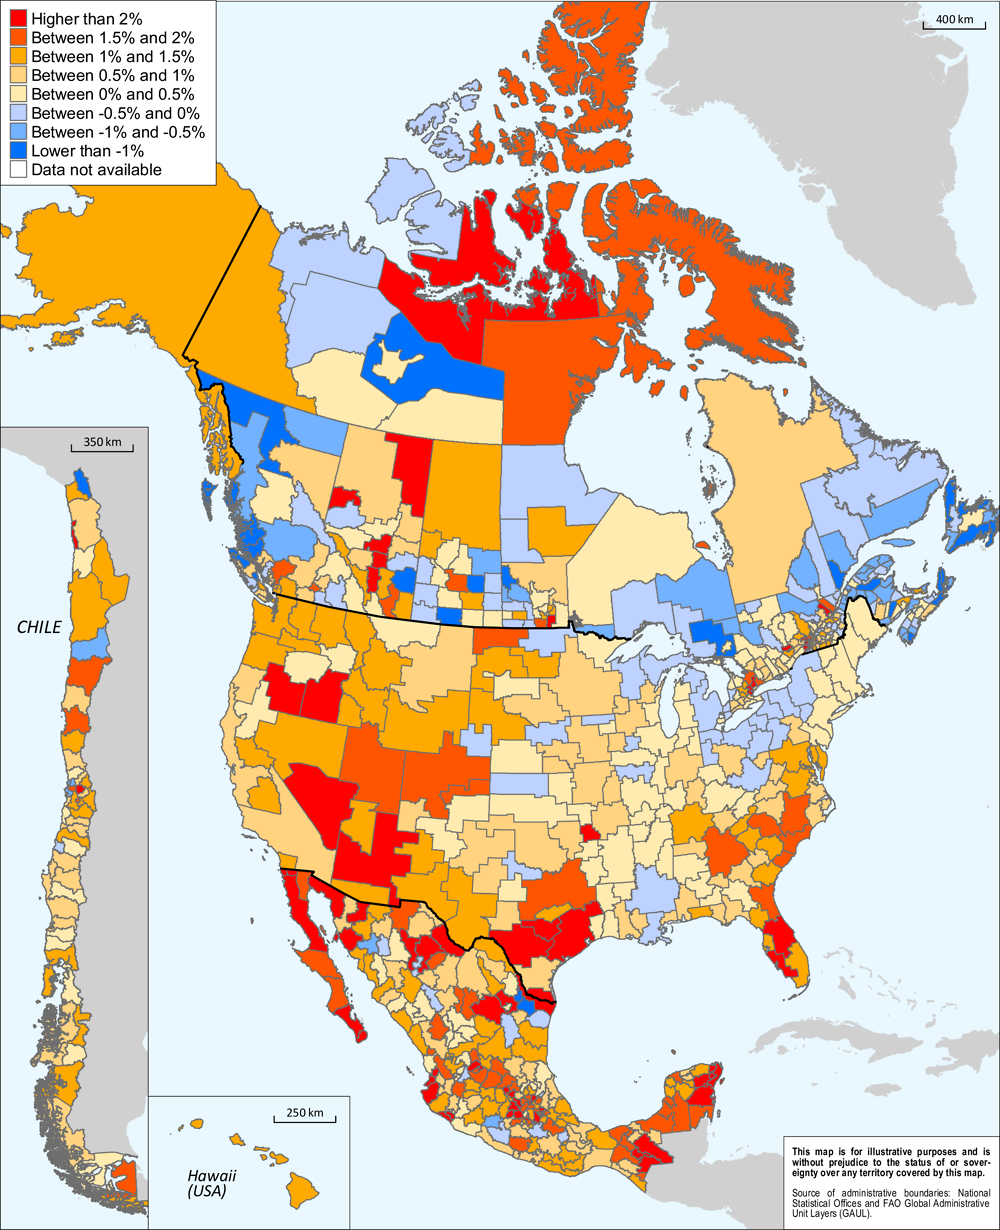
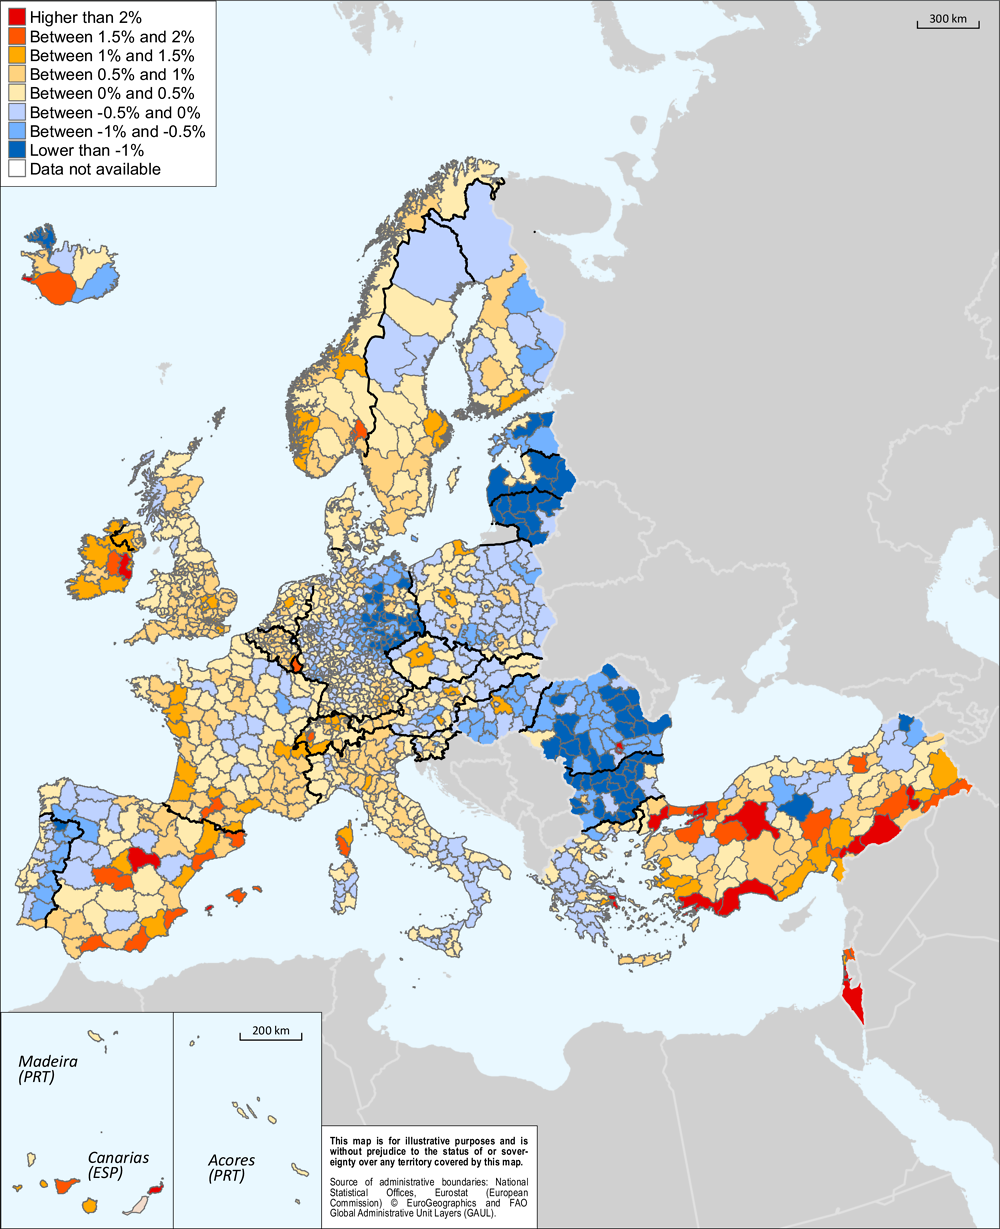
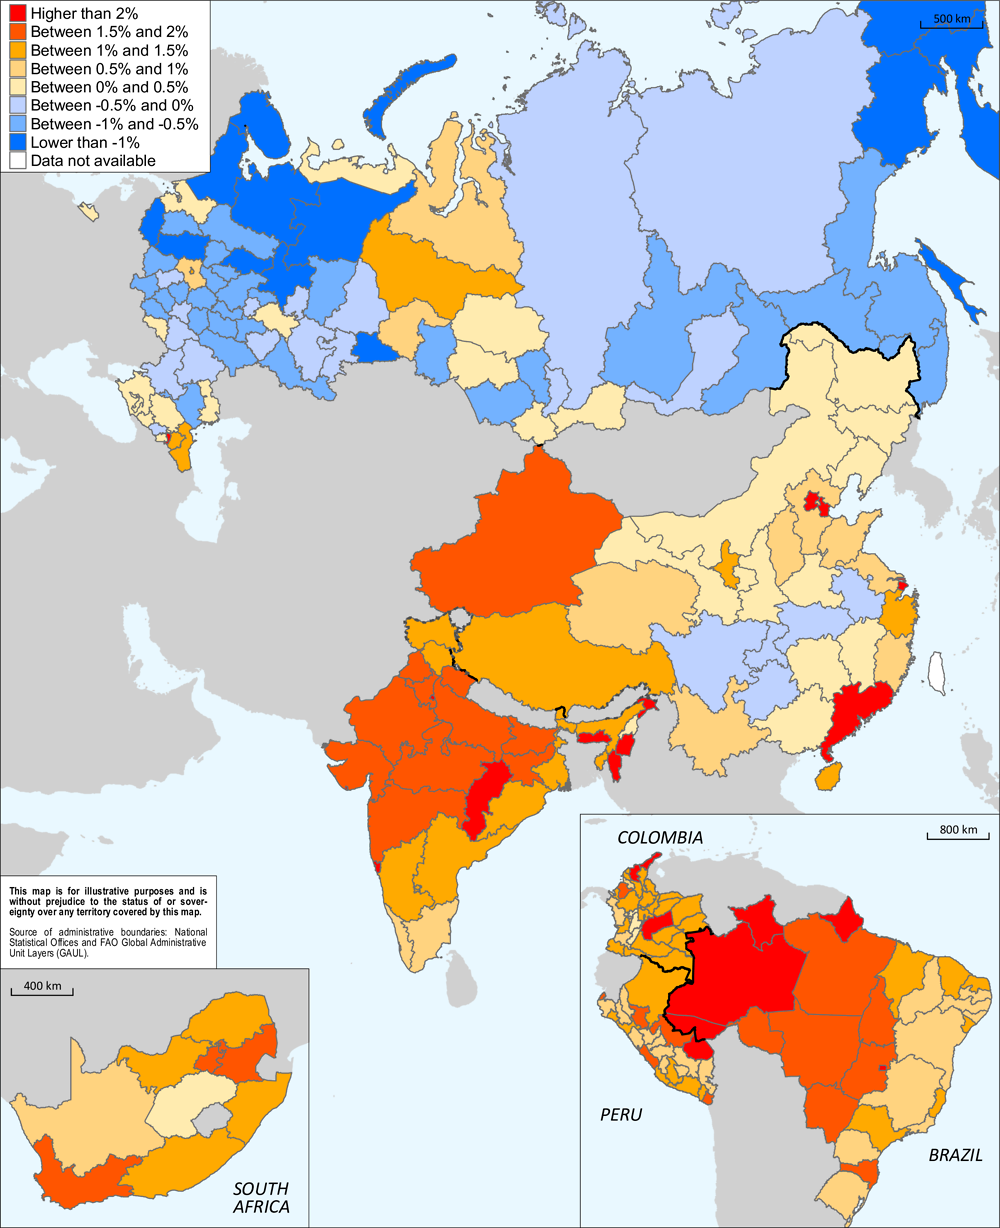
In the period from 2000 to 2017, the OECD population grew at an average annual rate of 0.64%. Belgium, Switzerland, Norway, Ireland, New Zealand, Israel, and Australia, displayed positive population growth rates in at least 95% of their regions between 2000 and 2017; in contrast, in Portugal, Poland, Estonia, Japan, Latvia, and Hungary, population growth was much more concentrated spatially, with 60% or more of their respective TL3 regions showing a decrease in total resident population (Figure 3.3 to 3.6).
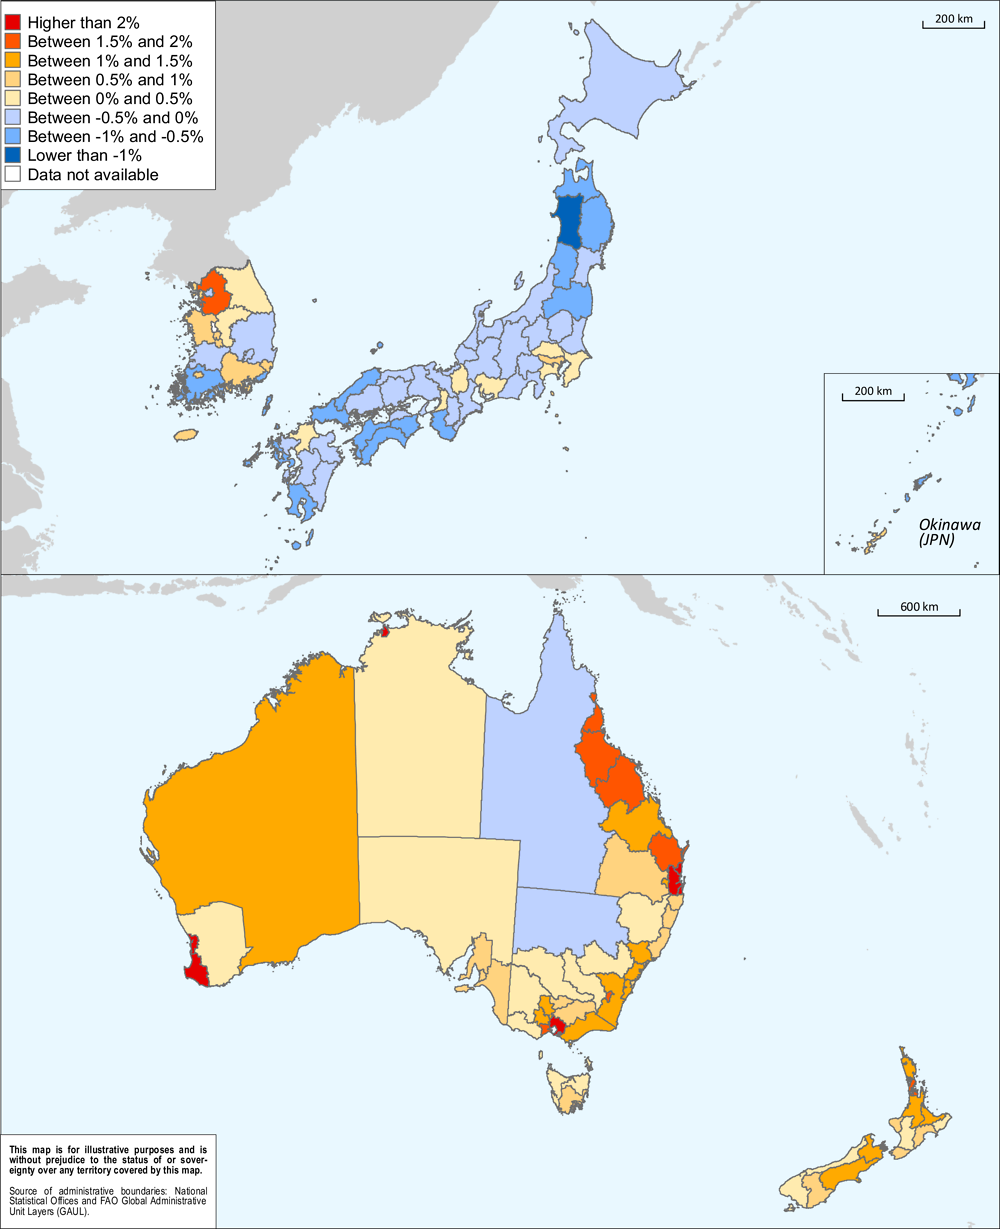
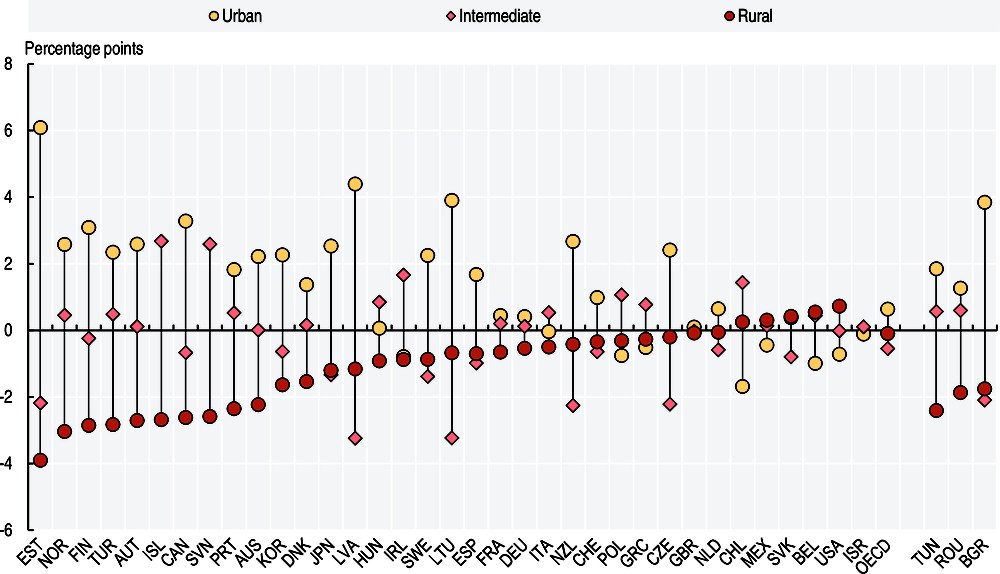
In 24 out of the 35 OECD countries considered, the share of population in regions with predominantly urban population has increased in the past 17 years; this increase has been particularly pronounced in Estonia, Latvia, Lithuania, Canada, and Finland, where the difference in the population share from 2000 to 2017 is of more than 3 percentage points. In almost all countries, regions with predominantly rural population have seen a decrease in population for the aforementioned period, with the exception of Chile, Mexico, the Slovak Republic, Belgium, and the United States, whose population increased marginally (Figure 3.2).
Source
OECD (2018), OECD Regional Statistics (database), https://doi.org/10.1787/region-data-en.
See Annex B for data sources and country-related metadata.
Reference years and territorial level
2000-2017; TL3.
TL2 regions for Brazil, China, Colombia, India, Peru, Russian Federation and South Africa.
Further information
Territorial grids and regional typology (Annex A)
Eurostat (2013), Urban-Rural typology, http://ec.europa.eu/eurostat/web/rural-development/methodology.
Brezzi, M., L. Dijkstra and V. Ruiz (2011), “OECD Extended Regional Typology: The Economic Performance of Remote Rural Regions”, OECD Regional Development Working Papers, 2011/06, OECD Publishing. https://doi.org/10.1787/5kg6z83tw7f4-en.
Figure notes
3.1-3.2: 2017 or latest available year: Australia, Canada, Iceland, Japan, New Zealand, United States and Tunisia, 2016. Extended typology not defined for Australia, Iceland, Korea, Latvia and Lithuania.
3.2: 2000 or first available year: Australia and Turkey, 2001; Tunisia, 2005.