Net pension wealth
Net pension wealth, the present value of the flow of pension benefits, again varies by economy, ranging from 22.1 for men in China (24.8 for women in Viet Nam) for low earners to 4.2 and 4.6 for men and women in Thailand at high earnings level. Malaysia and Viet Nam have the highest levels for both average and high earners.
Replacement rates give an indication of the pension promise relative to individual earnings, but they are not comprehensive measures of cumulated pension payments; they look only at the benefit level relative to individual earnings at the point of retirement, or more generally at a given, later age. For a full picture, life expectancy, normal retirement age and indexation of pension benefits must also be taken into account. Together, these determine for how long the pension benefit is paid, and how its value evolves over time. Net pension wealth – a measure of the stock of future discounted flows of pension benefits after taxes and social contributions – takes account of these factors. It can be thought of as the total net benefits that will be received on average from the mandatory retirement-income schemes.
In defined benefit systems there is often no or a weak link between the replacement rate and the expected duration of benefit withdrawal. Of course, in the long run, ensuring financial sustainability imposes a trade-off between the replacement rate and the duration of retirement. When retirement ages and pension benefits are held constant, pension wealth increases with longevity gains. In defined contribution systems there is a more direct link between the size of the benefit and the expected duration of benefit withdrawals. In these systems the pension wealth measure is equal to the accumulated assets and therefore independent of longevity increases as these automatically reduce the benefits.
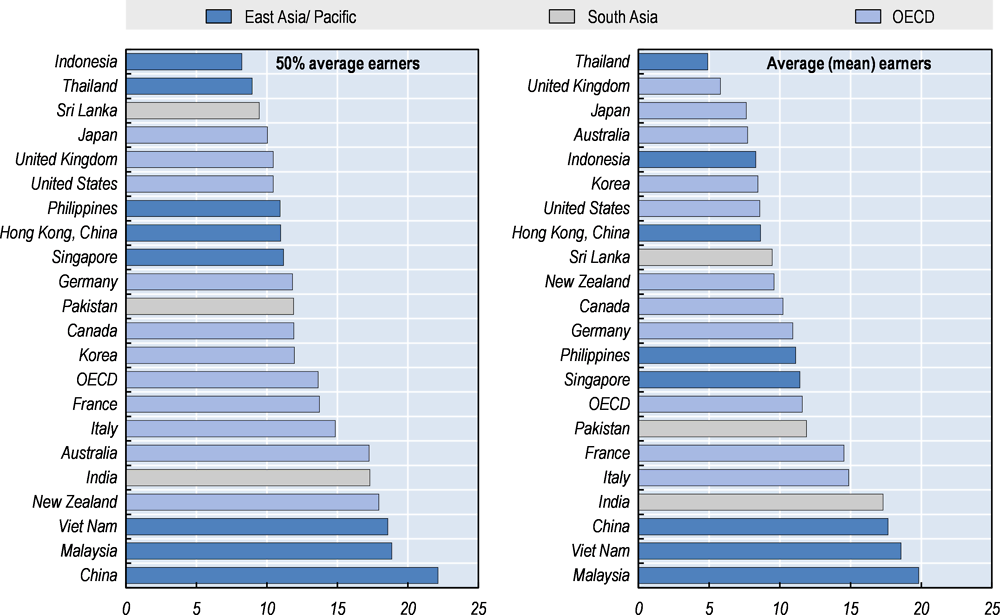
Net pension wealth at individual earnings equal to average worker earnings is highest in Malaysia at 19.8 times annual individual net earnings for men and women, but the highest level for women is found in Viet Nam at 24.8. The lowest pension wealth is found in Indonesia at 8.3 times for men and 9.2 for women, due to lower replacement rates.
The average for the OECD countries is 13.6 for low earners, 11.6 for average earners and 10.0 for high earners. All of the OECD countries have decreasing pension wealth levels as earnings increase. As with the gross pension wealth the values for New Zealand roughly half on each doubling of earnings as the mandatory pension is not affected by earnings but rather residency rules.
For high earners the non-OECD Asian economies dominate with China, India, Malaysia, the Philippines and Viet Nam having values above the OECD average, with none of the Asian OECD countries having a higher value than the OECD average. The values in both Malaysia and Viet Nam are approximately twice that of the OECD average. Even the variation within the other OECD countries is apparent with Italy having a net pension wealth over four times that of the United Kingdom for high earners.
For low earners China, India, Malaysia, Singapore and Viet Nam all have a net pension wealth higher than the OECD average. The value in China at 22.1 is over twice the value in Indonesia. For the OECD only four of the economies, namely Australia, France, Italy and New Zealand have a net pension wealth above the OECD average. The remaining OECD countries all have similar values between 10.0 and 12.0.
For women the same pattern is repeated as for the gross pension wealth, in that only Malaysia, Singapore and Sri Lanka having the same net pension wealth figures for men than women. The remaining economies, both OECD and non-OECD all have net pension wealth estimates that are higher for women than for men.
Source: OECD pension models.