Chapter 2. Does the tax treatment of retirement savings provide an advantage when people save for retirement?1
This chapter assesses whether the tax treatment of retirement savings vehicles in different OECD countries provides an advantage when people save for retirement. It then calculates the tax advantage that individuals saving into private pension plans may enjoy over their lifetime. This overall tax advantage is the amount that an individual would save in taxes paid by contributing to a private pension plan instead of putting the same amount into an alternative, benchmark savings vehicle. It also includes the effect of state financial incentives, such as flat-rate subsidies and matching contributions, and it is calculated for different types of private pension plans across all OECD countries.
Policy makers may wish to promote retirement savings through tax advantages and other financial incentives in order to increase national savings, reallocate savings into retirement products and reinforce the role of private pensions in the provision of retirement income.
Some countries have low national savings relative to their investment needs and may wish to increase overall savings. This could be achieved by introducing incentives with the goal of encouraging new savings. These incentives could focus on retirement savings products, as a way to help people accumulate enough financial resources by the time they retire, thus preventing them from relying on the public safety net, which would increase budgetary expenditures.
Retirement saving is for the long haul. Therefore, increasing saving for retirement could increase long-term investment and eventually bring higher long-term growth. Thus, even a country that has enough overall savings may still want to promote private pensions: reallocating other types of savings into retirement vehicles will not increase overall national savings but will earmark a greater share for retirement.
Recent reforms to pay-as-you-go public pension systems have increased the need to develop the complementary role of private pensions in the provision of retirement income in some countries. OECD governments have been active in reforming pension systems over the last decade (OECD, 2015a), often reducing public pension benefits and increasing the role of private pensions, in particular defined contribution plans. Providing financial incentives intends to make retirement savings more attractive in order to complement public provision and increase overall pension adequacy.
OECD countries encourage saving for retirement through private pensions by taxing retirement savings differently than alternative savings vehicles or offering other financial incentives. Historically, tax breaks (through tax exemption, tax deductions and tax credits) have been the main type of financial incentive provided by governments to promote private pensions. A more recent trend is to provide other types of financial incentives, for example, flat-rate subsidies or matching contributions. The OECD has recently performed a stocktaking exercise, collecting information on the tax treatment of retirement savings for all OECD and EU countries (OECD, 2015b). This report assesses the differences across various tax regimes that exist for private pension plans, and compiles country profiles, validated by national officials, giving detailed information on the tax treatment of funded private pension plans. The analysis shows that many countries apply a variant of the “Exempt-Exempt-Taxed” (“EET”) regime, where both contributions and returns on investment are exempted from taxation while benefits are treated as taxable income upon withdrawal. A wide range of other tax regimes can also be found, from the “Exempt-Exempt-Exempt” (“EEE”) regime where contributions, returns on investment and pension income are all tax-exempt, to regimes where two out of three flows of income are taxed.
This chapter assesses whether the tax treatment of retirement savings vehicles in different OECD countries provides an advantage when people save for retirement. It calculates the tax advantage that individuals saving in private pension plans may enjoy over their lifetime. It calculates this overall tax advantage for different types of private pension plans across all OECD countries. The approach used consists in comparing the tax treatment of a private pension plan to that of a benchmark savings vehicle, i.e. comparing how contributions, returns on investment and withdrawals are taxed in each savings vehicle. This includes the effect of state financial incentives, such as flat-rate subsidies and matching contributions, which are considered as tax credits paid into the pension accounts of entitled individuals. The overall tax advantage is defined as the amount that an individual would save in taxes paid during their working and retirement years by contributing the same pre‐tax amount to a private pension plan instead of to a benchmark savings vehicle.
In most OECD countries, the tax treatment of retirement savings does indeed provide a tax advantage when people save for retirement instead of saving into other traditional savings vehicles. The size of the overall tax advantage varies however, and depends on the tax regime applied to pension plans and savings vehicles, as well as on the characteristics of the personal income tax system (i.e. the tax brackets and the tax rates), the income level, the amount saved, the length of the contribution period, the type of pay-out option, the benchmark savings vehicle chosen as a comparator and other financial and economic parameters.
Before providing country-specific results in Section 2.2, Section 2.1 first explores the mechanisms through which different tax regimes may provide a tax advantage to individuals contributing to private pension plans. This section introduces the approach used to calculate the overall tax advantage and uses illustrative examples to help explain which tax regimes may be more favourable to individuals and how different factors may influence the results. As the section abstracts from country-specific parameters, the comparison between tax regimes is possible. Section 2.2 then calculates the amount of tax saved by individuals in different OECD countries when contributing to various types of private pension plans instead of to a benchmark savings vehicle. The overall tax advantage is calculated for all types of private pension plans existing in OECD countries, as long as a different tax regime applies. The analysis considers mandatory and voluntary plans, occupational and personal plans, defined benefit (DB) and defined contribution (DC) plans. Section 2.3 concludes. Finally, Annex 2.A1 provides the full description of the framework and assumptions.
2.1. How different tax regimes may provide a tax advantage when individuals save for retirement
This section first introduces the approach used to calculate the overall tax advantage when people save for retirement. It calculates the overall tax advantage for illustrative tax regimes built to show the mechanisms through which these tax regimes may provide a tax advantage. The section then looks at the effect on the tax advantage of different levels of income, lengths of the contribution period, contribution rates, pay-out options and financial and economic parameters (inflation, productivity growth, rate of return and discount rate). It ends with a summary of the main findings.
How to assess the tax advantage
This sub-section introduces the approach used to calculate the overall tax advantage that different tax regimes may offer to individuals saving in private pension plans. The calculation consists in comparing the tax treatment of a private pension plan to that of a benchmark savings vehicle, i.e. comparing how contributions, returns on investment and withdrawals are taxed in each case.2
In principle, all income is taxed either when earned or at some point in the future. Saving, including for retirement, involves three income flows that can be taxed. These incomes flows are contributions, returns on investment and withdrawals. In general, savings are made out of taxed earnings and the returns on investment are also subject to income tax. In return, the income received from such savings vehicles is fully exempt from taxation. Such arrangements are known as “Taxed-Taxed-Exempt” or “TTE” schemes. Table 2.1 illustrates how much tax would be paid under different tax regimes by an individual contributing EUR 100 before tax to a savings or pension vehicle in the first year and withdrawing a lump sum three years later. The calculations assume that the individual is subject to a 25% marginal income tax rate and that investments earn a 3% rate of return annually. The discount rate is set equal to the rate of return to calculate the present value of tax paid. Under the “TTE” regime, the individual pays EUR 25 in tax when the contribution is made, so that only EUR 75 is actually invested after tax. At the end of each investment year, the individual also pays taxes on investment income amounting to EUR 0.6. In present value terms, the total tax paid is equivalent to EUR 26.6.
The most popular tax regime for private pension plans is the one in which contributions and returns on investment are exempt, while withdrawals are taxed. Such arrangements are known as “Exempt-Exempt-Taxed” or “EET” schemes (OECD, 2015b). Table 2.1 shows that at the end of the third year, the accumulated assets are larger under the “EET” regime (EUR 109.3) than under the “TTE” regime (EUR 80.2) because contributions and returns on investment are exempt from taxation. Under the “EET” regime, taxes are only paid on withdrawals and are equal to EUR 25 in present value terms. The individual therefore saves EUR 1.6 in taxes in present value terms when contributing to an “EET” scheme rather than to a “TTE” one.
The “EET” and “TEE” regimes deliver the same tax advantage when the discount rate is equal to the rate of return, and contributions and withdrawals are subject to the same income tax rate. Table 2.1 shows that “EET” and “TEE” generate the same present value of tax paid. Conversely, the “ETT” regime is identical to the “TTE” regime in terms of the present value of total tax paid. The “EET” and “TEE” regimes therefore confer a tax advantage relative to the “TTE” and “ETT” regimes, which comes from the exemption from taxation of the returns on investment.
Building on the above example, the analysis herein calculates the overall tax advantage by extending it to the entire lifetime of the individual and considering the particularities of different tax regimes, as well as different pension and economic parameters.3 This overall tax advantage is defined as the difference in the present value of total tax paid on contributions, returns on investment and withdrawals between a benchmark savings vehicle and a private pension plan, assuming a flow of contributions made yearly over the entire career, given a constant contribution rate of 10%, a constant real rate of return on assets of 3%, and annuity pension payments calculated with a discount rate equal to the rate of return and a fixed life expectancy. The overall tax advantage therefore represents the amount saved in taxes by the individual over their working and retirement years when contributing the same amount (before tax) to a private pension plan instead of a benchmark savings vehicle. It is expressed as a percentage of the present value of pre-tax contributions.
There are several ways to provide preferential tax treatment to contributions to private pension plans. It can be done through tax exemptions/deductions, tax credits or state financial incentives. A tax exemption or a tax deduction reduces an individual’s taxable income, as contributions are excluded/deducted (either fully or partially) from income before calculating the tax due. Tax credits depend on the amount contributed and directly reduce the amount of tax due. A tax credit is non-refundable when the amount of the credit cannot exceed the amount of tax due. State subsidies and state matching contributions can be interpreted as refundable tax credits paid into the pension account. In the case of flat-rate state subsidies, the amount paid into the account is fixed across the income scale. In the case of state matching contributions, the amount paid into the account depends on the amount contributed. For all these tax treatments, caps can be introduced to limit the tax advantage. The analysis considers tax credits and state financial incentives as a negative tax on contributions to private pension plans, which makes it possible to include their impact on the overall tax advantage.
The analysis assumes that wage income is the only source of income during working life. Marginal tax rates are derived by determining the income tax bracket in which the individual’s wage falls every year. Wages are assumed to grow in line with inflation and productivity (both assumed to be constant at 2% and 1.5% respectively), while the income limits for all income tax brackets are assumed to grow in line with inflation.4 When contributions or returns on investment are subject to personal income tax (for the private pension plan or the benchmark savings vehicle), the tax rate that implicitly applies to them is the marginal tax rate, i.e. the tax rate that an individual would pay on the latest unit of income earned.
During retirement, the analysis assumes that the only sources of income are pensions, both mandatory public pensions and the pension payments/withdrawals from the private pension plan. The comparison made with respect to the benchmark savings vehicle substitutes the income from the private pension plan with the income from this alternative savings vehicle. When withdrawals are subject to personal income tax, the tax due is therefore calculated by applying the corresponding rates to each income tax bracket up to the individual’s total taxable pension income.
Comparing different tax regimes
The analysis in this section uses stylised tax regimes in order to abstract from the effect of country-specific parameters and assess just the impact of observed differences between tax regimes on the overall tax advantage. Before calculating the overall tax advantage for different types of private pension plans across all OECD countries in Section 2.2, the analysis focuses on selected tax regimes, assuming a common hypothetical personal income tax system to assess their impact on the overall tax advantage. These selected tax regimes are stylised versions of tax regimes that actually exist in different countries for private pension plans, maintaining the main features. Comparing the actual tax regimes applied to different pension plans across all OECD countries is less revealing, as it becomes impossible to disentangle the effect of the tax regimes themselves from the country-specific parameters. For example, when contributions are deductible from taxable income, the tax-deductibility limits that apply vary across and within countries and may also vary across pension plans (OECD, 2015b). In addition, the characteristics of the personal income tax system (i.e. the tax brackets and the tax rates) have an impact on the calculation of the overall tax advantage. In Canada and Greece for example, the average earner faces a different marginal tax rate (31.15% and 22% respectively). Everything being equal, this will lead to differences in the overall tax advantage.
The analysis focuses on 16 selected stylised tax regimes based on their relevance and importance in different OECD countries.5 Table 2.2 presents the different stylised tax regimes used, which result from the combination of different tax treatments for contributions, returns on investment and pension payments/withdrawals.6 Each stylised tax regime is symbolised by the combination of three letters representing the tax treatment for contributions, returns on investment and withdrawals respectively. For example, the “EET” stylised tax regime assumes that contributions are tax deductible up to EUR 7 300 a year (the first “E” in “EET”), returns on investment are tax-exempt (the second “E” in “EET”) and withdrawals are subject to personal income tax (the “T” in “EET”). Partial tax relief on contributions can be given in two ways, either by reducing taxable income (partial tax deductibility of contributions) or by reducing the tax liability (tax credit calculated based on the amount contributed). This is denoted by a “t”. Some of the stylised tax regimes are also combined with state financial incentives, either flat-rate subsidies or matching contributions. Obviously, the choice of the different parameters defining the stylised tax regimes has an important impact on the results. For example, the overall tax advantage for the “tEE” stylised tax regime will be lower when assuming that 20% of the contributions are tax deductible instead of 25%.
These stylised tax regimes are compared to the “TTE” tax regime that usually applies to traditional savings accounts to calculate the overall tax advantage when saving for retirement. As a baseline, the analysis assumes that the average earner enters the labour market at age 20 in 2015 and contributes 10% of wages yearly until age 65. The total amount of assets accumulated at 65 is converted into an annuity certain with fixed nominal payments.7 Inflation is set at 2%, productivity growth at 1.5%, the real rate of return on investment at 3% and the real discount rate at 3%.
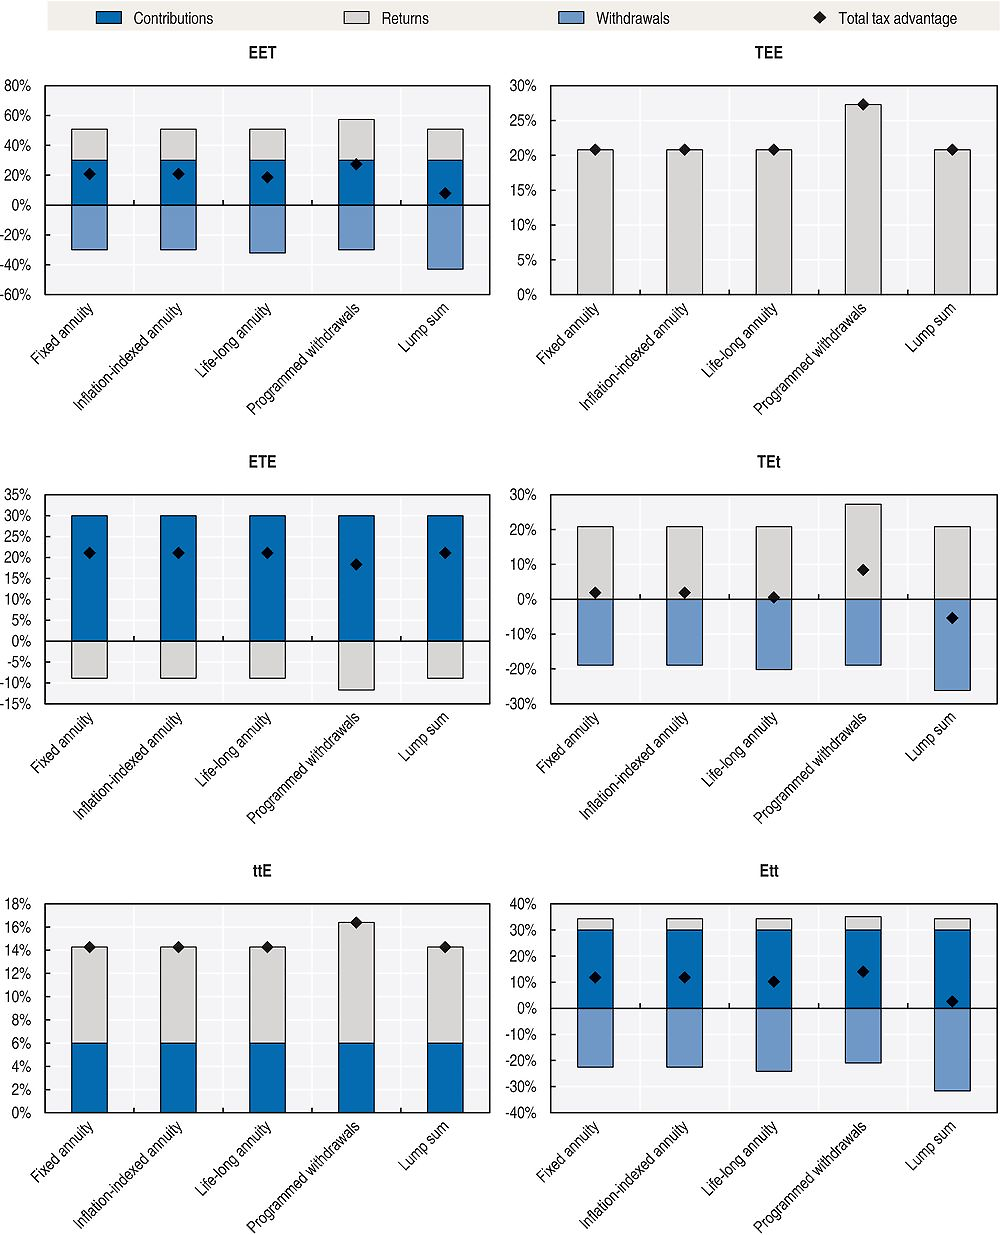
For all the selected stylised tax regimes, average earners can expect to pay less tax when contributing during a full career to a private pension plan rather than to a traditional savings account. For the 16 selected stylised tax regimes, Figure 2.1 shows the size of the overall tax advantage for the average earner, measured as the difference between the present value of total tax paid in a traditional savings account and in a private pension plan, expressed as a percentage of the present value of contributions. The overall tax advantage (solid line) is broken down into three components: tax advantage on contributions, tax advantage on returns and tax advantage on withdrawals. Each selected stylised tax regime would promote private pensions for average earners, with a positive overall tax advantage. Indeed, for most of the selected stylised tax regimes, private pension plans enjoy a preferential tax treatment on contributions and returns on investment as compared to traditional savings accounts (in which contributions and returns on investment are subject to personal income tax), as illustrated by the blue and grey bars on the positive side of the y-axis. This preferential tax treatment outweighs the potential taxation of pension payments (light-blue bars on the negative side). The preferential tax treatment on contributions and returns may come in the form of a tax exemption (full or partial), a tax credit or a lower tax rate. In addition, state financial incentives may increase the tax advantage.
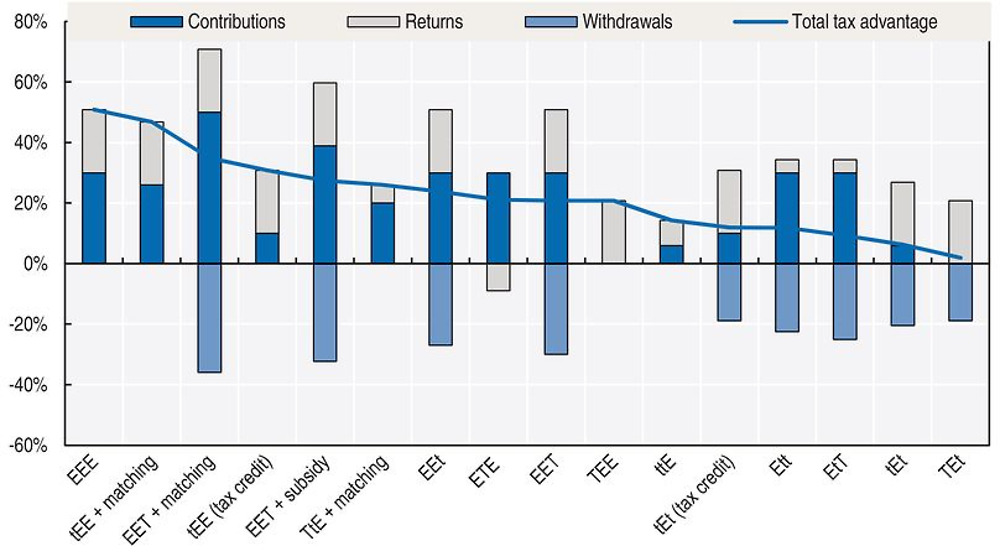
Note: E stands for exempt and T for taxed.
Among the stylised tax regimes, the one where none of the flows is taxed (“EEE”) provides the largest overall tax advantage to an average earner. It is followed by tax regimes where only one of the flows is taxed (“EET”/“EEt”, “ETE” and “TEE”/“tEE”) and finally tax regimes where two of the flows are taxed (“ttE”/“TtE”, “Ett”/“EtT” and “tEt”/“TEt”).
State subsidies and state matching contributions increase the overall tax advantage. For example, the “EET” stylised tax regime provides a larger overall tax advantage to the average earner when combined with a state matching contribution (35% of the present value of contributions) or with a state subsidy (27%) than on its own (21%). When combining state subsidies or state matching contributions with the “EET” stylised tax regime, the increase in the tax advantage on contributions outweighs the additional tax due on withdrawals.
In regimes where only one flow is subject to personal income tax, the overall tax advantage for an average earner contributing to a private pension plan is the same whether the tax is collected on contributions, returns on investment or withdrawals. With each of the “EET”, “ETE” and “TEE” stylised tax regimes, the average earner would save in taxes an amount equivalent to 21% of the present value of contributions.8
A tax credit on contributions brings in more tax savings than a partial tax deduction of contributions as long as the tax rate applying to contributions is lower than the ratio of the tax credit rate to the deduction rate. The “tEt” stylised tax regime is designed either with a partial tax deduction of contributions (20% of contributions are tax deductible) or with a tax credit on personal income tax (corresponding to 10% of the contributions). For an average earner, the tax credit on personal income tax leads to a larger overall tax advantage on contributions (10% of the present value of contributions) than the partial tax deduction of contributions (6% of the present value of contributions). Indeed, as long as the marginal tax rate is lower or equal to 50% (10% divided by 20%), the effective tax rate that applies to contributions will be lower with the tax credit (marginal tax rate minus 10 percentage points) than with the partial tax deduction (80% of the marginal tax rate).
Impact of the level of income
The overall tax advantage varies with the level of income for all the selected stylised tax regimes. Figure 2.2 illustrates how the overall tax advantage (solid line) and its different components (tax advantage on contributions, tax advantage on returns and tax advantage on withdrawals) change with the level of income for the 16 selected stylised tax regimes. Depending on the tax regime, different groups of individuals can expect to get a larger overall tax advantage. The analysis considers three income groups: low-income individuals (earning less than 60% of the average earnings), medium-income individuals (earning between 0.6 and 2 times the average earnings) and high-income individuals (earning more than 2 times the average earnings).
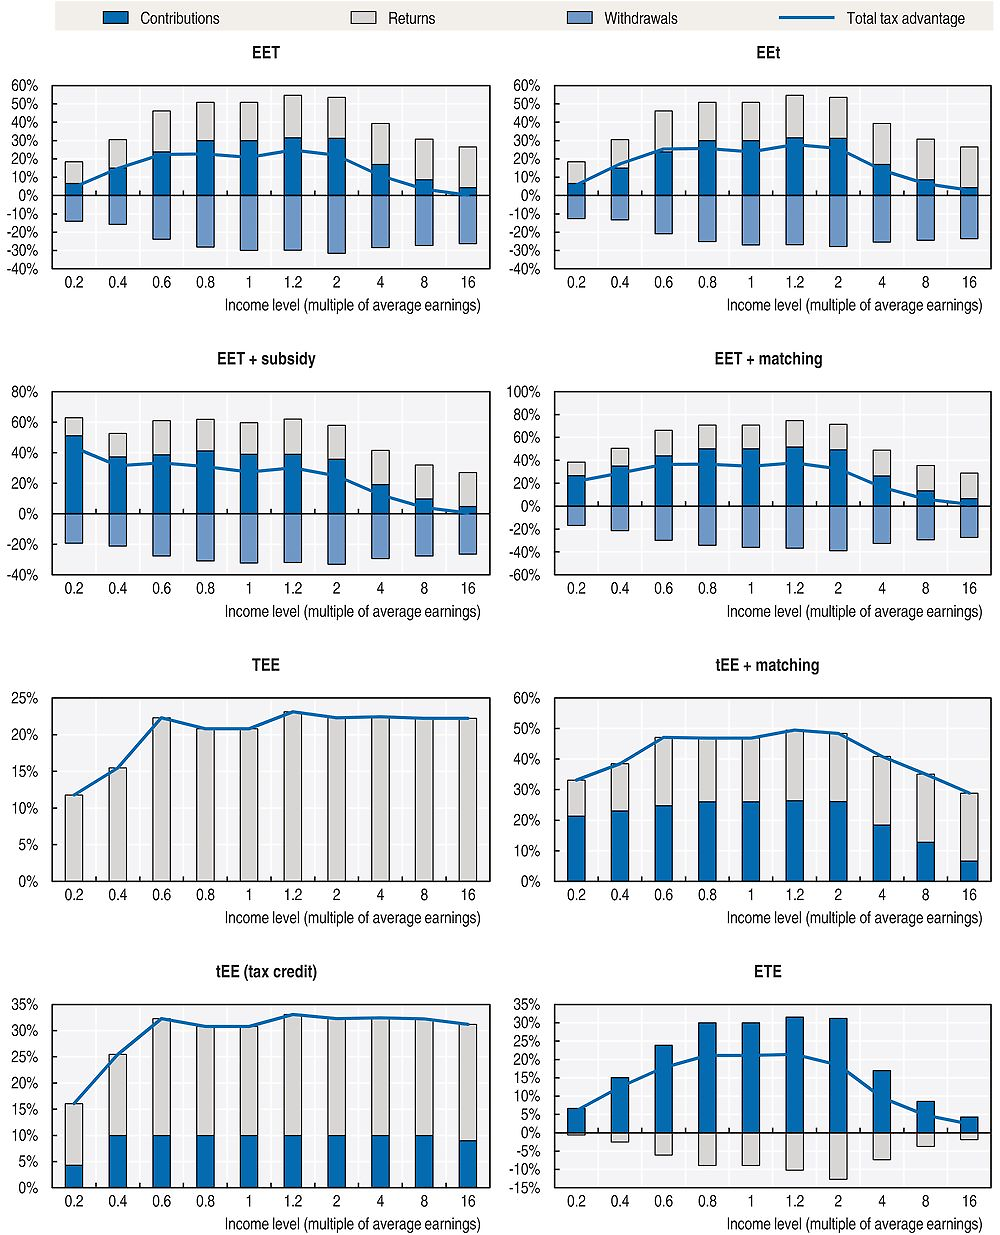
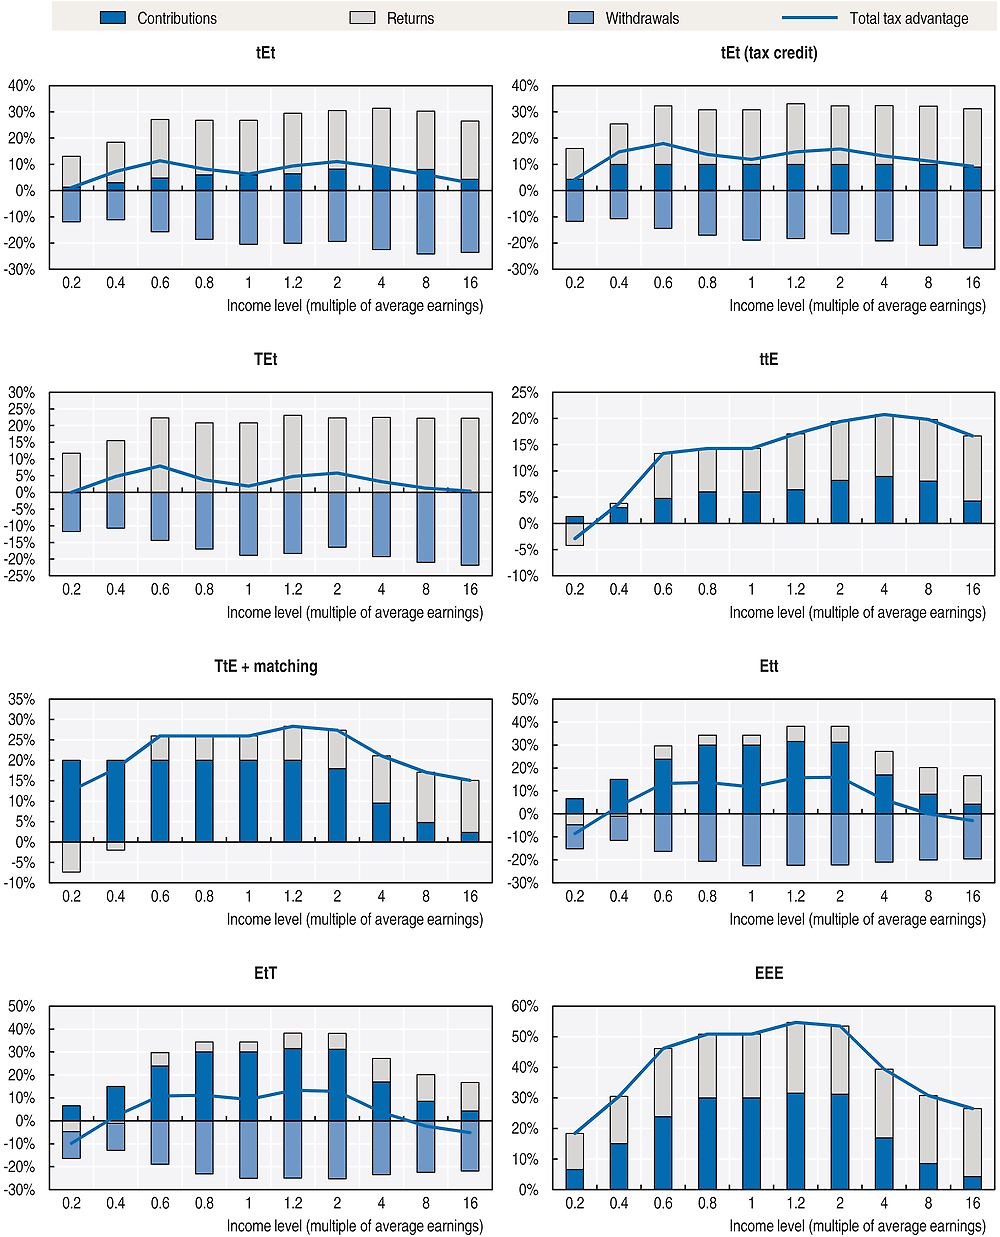
Note: E stands for exempt and T for taxed.
Individuals of all income levels can expect to pay less in taxes when contributing to a private pension plan rather than to a traditional savings account for all the selected stylised tax regimes, except for three cases relevant to very low-income individuals. Very low-income individuals, earning only 20% of average earnings, would pay more tax on private pensions than on traditional savings accounts if the “ttE”, “Ett” or “EtT” stylised regimes applied to private pension plans. These individuals have a null marginal tax rate during part of their career, meaning that returns in the traditional savings account are not taxed, while returns in the private pension plan are taxed at the flat rate of 15%.
Of the 16 selected stylised tax regimes, 10 provide a larger tax saving to medium-income individuals as compared to low and high-income individuals when they contribute to a private pension plan rather than to a traditional savings account. The overall tax advantage increases with income and then falls for the following stylised tax regimes: “EEE”, “EET”, “EEt”, “tEE + matching”, “tEE (tax credit)”, “ETE”, “ttE”, “TtE + matching”, “Ett” and “EtT”. The main driving force is the tax treatment of contributions (the tax treatment of returns on investment and withdrawals have a lesser impact on the change in the overall tax advantage by income). When contributions are deductible from income (“E××”), the tax advantage on contributions increases with income, because the tax paid on contributions to a traditional savings account increases as the individual reaches higher income tax brackets. However, the analysis assumes a limit on the tax deductibility of contributions. This means that contributions to the private pension plan above EUR 7 300 are subject to personal income tax. The higher the income, the higher the likelihood that contributions will exceed the limit (with a 10% contribution rate). Consequently, individuals earning more than the average wage will pay tax on part of their contributions to private pension plans, thereby reducing their overall tax advantage on contributions.9 The same mechanism is engaged when contributions are partially deductible from income (“t××”). The overall tax advantage on contributions initially increases with income, but then declines for high-income individuals because of the limit on thetax deductibility of contributions.
Medium and high-income individuals can expect to save more in taxes paid than low-income individuals when only contributions to private pension plans are taxed (“TEE” stylised tax regime). This tax regime only differs from that of traditional savings accounts (“TTE”) in the tax treatment of returns on investment. As returns in the pension plan are exempt from income tax, the overall tax advantage on returns increases with income, because the tax paid on returns in a traditional savings account increases as the individual reaches higher income tax brackets. As long as there are no limits on the tax exemption of returns, the overall tax advantage does not diminish for high-income individuals.
Flat-rate state subsidies paid into the private pension plan can help target tax advantages at low-income individuals. As the value of the subsidy is fixed across the income scale, its value in relative terms is higher for low-income individuals. Therefore, the state subsidy significantly increases the overall tax advantage for low-income individuals only when comparing the “EET + subsidy” stylised tax regime with the “EET” stylised tax regime.
Tax credits on personal income tax and state matching contributions paid into the private pension plan can be used to smooth out the tax advantage across income groups. The “TtE + matching” stylised tax regime illustrates perfectly the impact of the matching contribution on the tax advantage on contributions. The tax advantage on contributions is income neutral for low and medium-income individuals (the tax advantage corresponds to 20% of the present value of contributions – same as the match rate) and falls with income after reaching the contribution cap. As for the tax credit, the tax advantage on contributions is equal to 10% of the present value of contributions for most income levels (see “tEE (tax credit)” and “tEt (tax credit)” stylised tax regimes). However tax credits are less valuable for low-income individuals who pay little or no income tax, because they are non-refundable, and for high-income individuals, because of the cap on the amount of the tax credit.
As a result of the different effects of income on the overall tax advantage, the ranking of the 16 selected stylised tax regimes as shown in Figure 2.1 for the average earner varies according to income. Thus, while medium-income individuals are better off with the “EEE” stylised tax regime, low-income individuals would save more tax with the “EET + subsidy” and with the “tEE + matching” stylised tax regimes. For high-income individuals, the “tEE (tax credit)” and “tEE + matching” stylised tax regimes are more interesting in terms of tax saved.
Impact of the length of the contribution period
The overall tax advantage of contributing to a private pension plan rather than to a traditional savings account increases with the length of the contribution period. For each of the selected stylised tax regimes, Table 2.3 shows the overall tax advantage for three different lengths of the contribution period: 45 years (baseline, from age 20 to 65), 40 years (late entry at age 25 or early retirement at age 60) and 50 years (delayed retirement to age 70). The longer the contribution period, the larger the overall tax advantage.10 For example, for an average earner contributing to an “EET” private pension plan, the present value of tax saved represents 19% of the present value of contributions after 40 years of contributions, 21% after 45 years and 24% after 50 years.11
The main driver of this result is the compound interest. When returns on investment in private pension plans are tax-exempt (×E×) or taxed at a preferential rate (15% as opposed to the individual’s marginal rate of personal income tax, ×t×), the tax advantage on returns on investment is positive. The longer is the contribution period, the longer the investment income can accumulate and the larger is the tax advantage on returns. The tax advantages on contributions and on withdrawals also vary with the length of the contribution period, but the variations are not significant when expressed as a percentage of the present value of contributions. Because of the compound interest, returns on investment increase in a larger proportion than contributions and withdrawals when the contribution period is longer. Therefore, the variation in the tax advantage on returns is the main driver of the variation in the overall tax advantage when the length of the contribution period changes.
Impact of the contribution rate
The overall tax advantage varies with changes in the contribution rate. The comparison of the overall tax advantage when contributing 5% or 10% to a private pension plan rather than to a traditional savings account produces interesting results.
A lower contribution rate translates into a larger overall tax advantage for high-income individuals in tax regimes in which contributions are tax-deductible, either fully (E××) or partially (t××). As illustrated in Figure 2.3, with a 5% contribution rate the overall tax advantage does not decline for the last two income groups for the “ttE” stylised tax regime, while it does with a 10% contribution rate. This is because the tax deductibility limit on contributions is harder to reach when the contribution rate is halved. The same explanation applies in the case of state matching contributions and tax credits (see “tEE + matching” and “tEE (tax credit)” stylised tax regimes).
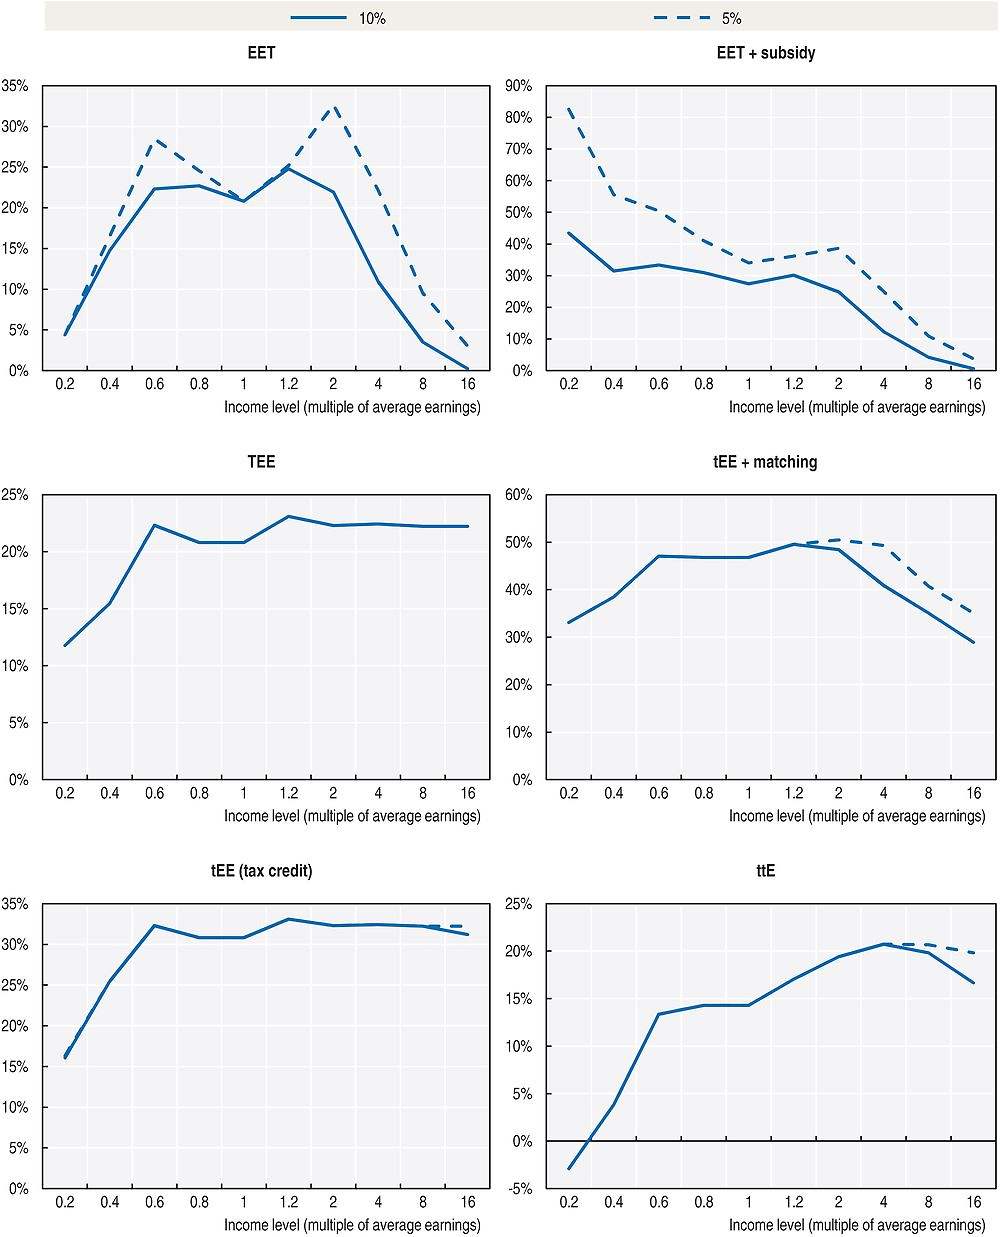
Note: E stands for exempt and T for taxed.
For tax regimes in which pension payments and withdrawals are taxed, either fully (××T) or partially (××t), a lower contribution rate may translate into a larger overall tax advantage for individuals earning between 60% and 80% of the average wage. Indeed, a lower contribution rate leads to lower pension payments during retirement, potentially moving individuals into lower income tax brackets. If a lower marginal tax rate applies, then the individual pays less tax on withdrawals. For example, for the “EET” stylised tax regime, individuals earning between 60% and 80% of the average wage pay less in taxes on pension withdrawals (as a proportion of the present value of their contributions) when they contribute 5% instead of 10%.
An individual entitled to a state subsidy will not get any additional tax advantage when saving above the amount laid down in the plan rules that prompts the maximum subsidy. In the stylised “EET + subsidy” tax regime, the maximum subsidy is obtained with a 5% contribution rate. When contributing more than 5%, the subsidy does not increase, but the present value of contributions does. Therefore, the tax advantage on contributions (ratio between the difference in the present value of tax paid on contributions and the present value of contributions) gets smaller for higher contribution rates, reducing the overall tax advantage. As the value of the subsidy is proportionally reduced for contribution rates below 5%, the tax advantage on contributions remains constant for lower contribution rates.
Finally, the overall tax advantage is not sensitive to the contribution rate in the case of the “TEE” stylised tax regime. Indeed, the overall tax advantage provided through this tax regime is only derived from the preferential tax treatment of returns on investment. As long as there are no limits to the tax exemption of returns in the private pension plan, and the returns in the traditional savings account are subject to personal income tax, the amount contributed has no impact on the tax advantage on returns.
Impact of the type of pay-out option
This sub-section considers five types of pay-out options and explores how sensitive the overall tax advantage under different tax regimes is to them. The types considered are: annuity certain with fixed nominal payments, annuity certain with inflation-indexed payments, life-long annuity with fixed nominal payments, programmed withdrawals and single lump-sum payment.12 For certain stylised tax regimes, the type of pay-out option can have an impact on the tax paid on returns on investment and the tax paid on withdrawals. The tax paid on contributions is never sensitive to the type of pay-out option.
Individuals withdrawing their savings all at once as a lump sum receive a lower overall tax advantage than individuals getting regular income during retirement (annuities and programmed withdrawals) for stylised tax regimes in which pension payments and withdrawals are taxed (either fully or partially). As illustrated in Figure 2.4, which shows only a subset of the stylised tax regimes, the tax due on withdrawals is larger in the case of a lump-sum payment for the “EET”, “TEt” and “Ett” stylised tax regimes. When the whole amount of assets accumulated at retirement is taken as a lump sum, the individual may move to a higher income tax bracket (with a bigger tax rate), therefore paying more tax than when the assets are spread over retirement to get a regular income. As a consequence, the overall tax advantage is lower with the lump-sum option, and even negative in the case of the “TEt” stylised tax regime.
Note: E stands for exempt and T for taxed.
Programmed withdrawals provide a larger overall tax advantage than annuities for most stylised tax regimes. With programmed withdrawals, assets remain invested during the retirement phase and continue to be taxed in the traditional savings account. Therefore, the overall tax advantage is larger with programmed withdrawals than with annuities for stylised tax regime in which returns are tax-exempt (e.g. “EET”, “TEE” and “TEt” stylised tax regimes) or taxed at a lower rate than in the traditional savings account (e.g. “ttE” and “Ett” stylised tax regimes). It is the other way around for the “ETE” stylised tax regime because, even though returns are subject to personal income tax for both the private pension plan and the traditional savings account, the tax due on returns in the case of the “ETE” private pension plan is larger (because after-tax contributions are bigger).
Differences are smaller between different types of annuity products. For all stylised tax regimes, the overall tax advantage is exactly the same when comparing an annuity certain with fixed nominal payments to an annuity certain with inflation-indexed payments. Although the payments in each year are different, the sum of the present value of payments over the retirement period is identical for both types of annuities. Individuals getting a life-long annuity receive a slightly lower overall tax advantage than individuals getting an annuity certain for stylised tax regimes in which pension payments and withdrawals are taxed (either fully or partially). The main difference between a life-long annuity and an annuity certain is that the number of payments is not known in advance for the life-long annuity.13 In the calculation of the annuity factor, the probability of still being alive at each age is taken into account. The consequence is that the payments are bigger with a life-long annuity than with an annuity certain because the annuity provider considers that there is a positive probability for the individual to die before reaching the average life expectancy of their cohort. When pension benefits are taxed, this translates into a higher tax due and a lower overall tax advantage.
Impact of financial and economic parameters
The overall tax advantage can also change when parameters such as returns, discount rates, inflation and productivity growth change. The baseline has inflation at 2%, productivity growth at 1.5%, and the real rate of return on investment and the real discount rate equal to 3%.
The overall tax advantage increases with inflation and real returns for all the stylised tax regimes except one (Table 2.4). Higher inflation (from 2% to 3%) or higher real rates of return (from 3% to 4%) lead to higher nominal rates of return. Therefore, for all the tax regimes offering a preferential tax treatment on returns on investment, the tax advantage on returns is larger in a higher inflation and return scenario, because the tax paid on returns in the traditional savings account is higher. A higher inflation or return has no impact on the tax advantages on contributions and withdrawals. For the “ETE” stylised tax regime, even though returns are subject to personal income tax in both the private pension plan and the traditional savings account, the tax due on returns in the case of the “ETE” private pension plan is larger (because after-tax contributions are bigger).
The impact on the overall tax advantage differs according to the tax regime when the discount rate is lower than the rate of return. A lower discount rate gives a higher weight to future flows. The overall tax advantage therefore declines significantly for tax regimes in which withdrawals are taxed (××T or ××t) because any future differences are amplified by the lower discount rate.
The impact of productivity growth on the overall tax advantage varies according to both the stylised tax regime and the income level.
-
An increase in productivity growth translates into higher contributions through higher wages. For stylised tax regimes with a preferential tax treatment on contributions (E×× and t××), this leads to an increase in the tax advantage on contributions for low-income individuals and a decrease in the tax advantage on contributions for high-income individuals because:
-
the tax paid on contributions is larger in the traditional savings account;
-
but the tax-deductibility limit for contributions is reached by more wage-earners, as this limit is assumed to be indexed to inflation only.
-
-
Inflation-indexed state subsidies have a lower weight on the tax advantage on contributions when productivity growth increases.
-
State matching contributions still provide the same tax advantage on contributions when productivity growth increases, except that the maximum state contribution, which is assumed to be indexed to inflation only, is reached by more wage-earners.
-
An increase in productivity growth translates eventually into higher pension payments and withdrawals. For stylised tax regimes with taxable withdrawals (××T and ××t), this leads to an increase in tax due on withdrawals, potentially at higher marginal tax rates as income limits for all tax brackets are assumed to be inflation-indexed only.
Main findings
The comparison of the stylised tax regimes allows for a better understanding of the mechanisms through which they may provide an overall tax advantage to individuals contributing to private pension plans rather than to traditional savings accounts. The main findings are:
-
For all stylised tax regimes and most income levels, individuals can expect to pay less in taxes when contributing to a private pension plan rather than to a traditional savings account. Usually, the positive overall tax advantage derives from a preferential tax treatment for private pension contributions and returns on investment that is not offset by the potential taxation of benefits. The preferential tax treatment for contributions and returns comes in the form of tax exemptions/deductions, tax credits, lower tax rates and state financial incentives.
-
State subsidies and state matching contributions increase the overall tax advantage.
-
A tax credit on contributions will provide higher tax savings than a partial tax deduction of contributions as long as the tax rate on contributions is lower than the ratio of the tax credit rate to the deduction rate.
-
The overall tax advantage increases with income for tax regimes in which contributions are deductible from income, either fully or partially. It then falls after a certain level of income because of the tax-deductibility limits.
-
Flat-rate state subsidies paid into the private pension plan change the profile of the tax advantage with respect to income as they target the tax advantage at low-income individuals. Low-income individuals may even be better off in terms of tax paid with the “EET + subsidy” stylised tax regime than with the “EEE” stylised tax regime, as long as the subsidy represents a significant share of their income.
-
Tax credits on personal income tax and state matching contributions paid into the private pension plan can be used to smooth out the tax advantage across income groups. However, low-income individuals, who pay little or no income tax, benefit less from non-refundable tax credits. Caps can be introduced to lower the tax advantage for high-income individuals.
-
The overall tax advantage increases with the length of the contribution period because of the compound interest.
-
A higher contribution rate translates into a lower overall tax advantage for high-income individuals in tax regimes where contributions are tax deductible up to a limit as they are more likely to reach this limit.
-
An individual entitled to a state subsidy will not get any additional tax advantage when saving above the amount laid down in the plan rules that prompts the maximum subsidy.
-
Lump sums provide a lower overall tax advantage than pay-out options offering regular payments in stylised tax regimes in which pension payments and withdrawals are taxed, because they may move individuals into a higher income-tax bracket.
-
Programmed withdrawals provide a larger overall tax advantage than annuities for most stylised tax regimes because assets remain invested during the retirement phase and continue to be tax-exempt in the retirement vehicle, while they are taxed in the traditional savings account.
-
A higher nominal rate of return translates into a larger overall tax advantage when returns on investment receive preferential tax treatment in the private pension plan. This remains true when higher nominal returns are just the result of higher inflation.
-
A lower discount rate translates into a lower overall tax advantage for tax regimes in which withdrawals are taxed because any future differences are amplified.
2.2. Does the tax treatment of retirement savings in different OECD countries provide an advantage when people save for retirement?
This section sets out the overall tax advantage in different OECD countries. The overall tax advantage is the amount of tax saved by individuals when contributing to different types of private pension plans instead of to a benchmark savings vehicle. It is calculated for all types of private pension plans that exist in OECD countries, as long as a different tax regime applies.
The methodology is the same as that described in Section 2.1, but in addition:
-
The analysis considers all mandatory and voluntary plans, occupational and personal plans, DB and DC plans.14
-
All the country-specific parameters that apply for each type of plan are taken into account (e.g. specific tax-deductibility limits, ceiling on the lifetime value of pension assets, state financial incentives).
-
The personal income tax system (i.e. the tax brackets and the marginal tax rates) is also country-specific.
-
The private pension plans are compared to different benchmark savings vehicles: a traditional savings account, a mutual fund (or collective investment scheme) and any other country-specific popular savings vehicles (e.g. life insurance contracts, special savings accounts). The analysis accounts for the country-specific tax treatment that applies to each benchmark savings vehicle.
-
Minimum and mandatory contribution rates fixed by regulation are applied whenever they exist. For voluntary contributions, the analysis assumes a 10% contribution rate.
-
The age of retirement assumed in the analysis is the official age of retirement in each country.
The section first presents the results when the benchmark savings vehicle is a traditional savings account. It then looks at the impact of changing the benchmark.
Average earners in all OECD countries enjoy an advantage when saving for retirement in a private pension plan rather than in a traditional savings account in terms of tax paid. This is because the preferential tax treatment that contributions and returns on investment usually enjoy in a private pension plan (as compared to a traditional savings account) outweighs the potential taxation of benefits. Table 2.5 provides for the average earner the overall tax advantage and its three components (tax advantage on contributions, tax advantage on returns and tax advantage on withdrawals), for all OECD countries and selected types of private pension plans. It shows that the overall tax advantage is positive for all types of plans except two: personal pension insurance plans in Austria (-14% of the present value of contributions) and personal pension plans in Norway (-2%). In the case of Austria, contributions are not tax deductible and an extra 4% insurance tax is levied on individual contributions. In the case of Norway, contributions to voluntary personal plans are partially deductible from income, but this is not sufficient to compensate for the tax paid on withdrawals. For the other countries, the amount of tax saved varies from 1% of the present value of contributions in Luxembourg (personal plans) and Slovenia, up to 51% in Israel and Mexico (mandatory contributions), with a maximum overall tax advantage corresponding to 281% of the present value of contributions in Mexico for solidarity savings (voluntary scheme for public sector employees).15
The differences observed across countries are due not only to the characteristics of the tax regimes applied to pension plans and savings vehicles, but also to the characteristics of the personal income tax system in each country (i.e. the tax brackets and the tax rates). In Canada and Greece for example, the overall tax advantage of contributing to a private pension plan is different (24% and 14% of the present value of contributions respectively), even though an “EET” tax regime applies to pension plans in both countries. However, an average earner in Canada has a 31.15% marginal tax rate, while an average earner in Greece has a 22% marginal tax rate.16
In many OECD countries, the overall tax advantage varies according to the type of plan to which individuals contribute. Indeed, many countries apply different tax treatments to different types of plans. For example, in Mexico, individuals can choose between six different vehicles for their voluntary pension contributions. However, because the tax treatment of these voluntary contributions varies according to the vehicle, the overall tax advantage changes from 8% of the present value of contributions for short-term voluntary contributions to 40% for long-term voluntary contributions and occupational pension plans, or even 281% for solidarity savings, which is a scheme exclusively for public sector workers.
When employee and employer contributions to occupational pension plans receive a different tax treatment, the overall tax advantage depends on the relative importance of each type of contribution in the total. For instance, in Hungary, employer contributions are not considered as taxable income for individuals, while employees’ contributions are made out of taxed earnings. As the analysis assumes that employer contributions represent 40% of the total contributions in occupational plans and 0% in individual retirement accounts, the tax advantage on contributions is larger for occupational plans because part of the contributions is tax-exempt.
Introducing financial incentives like state subsidies or state matching contributions increases the overall tax advantage. For example, in New Zealand, the same tax regime applies to occupational pension plans and to KiwiSaver plans (contributions and returns on investment are taxed, but at a lower rate than for a traditional savings account, and withdrawals are tax-free). Adding the state matching contribution for KiwiSaver plans boosts the overall tax advantage from 3% to 11% of the present value of contributions.
In some countries, the overall tax advantage is larger for mandatory pension savings than for voluntary pension savings. This is the case in Australia, where the amount of tax saved by the average earner represents 37% of the present value of contributions when making mandatory contributions, but only 18% when making voluntary contributions. This trend is also found in Iceland (44% for occupational DC plans as opposed to 7% for personal plans), Mexico (51% for mandatory contributions as opposed to 40% for long-term voluntary contributions), the Netherlands (32% for occupational plans as opposed to 29% for personal plans), Norway (20% for occupational plans as opposed to -2% for personal plans) and the Slovak Republic (36% for pillar 2 plans as opposed to 9% for pillar 3 plans).
However, some other countries encourage more voluntary savings. This is the case in Chile (the amount of tax saved represents 16% of the present value of contributions for type A voluntary contributions as opposed to 11% for mandatory contributions), Denmark (27% for quasi-mandatory occupational plans as opposed to 13% for the ATP plan), Estonia (37% for voluntary contributions as opposed to 23% for mandatory contributions), and Latvia (20% for the voluntary scheme as opposed to 9% for the mandatory scheme).
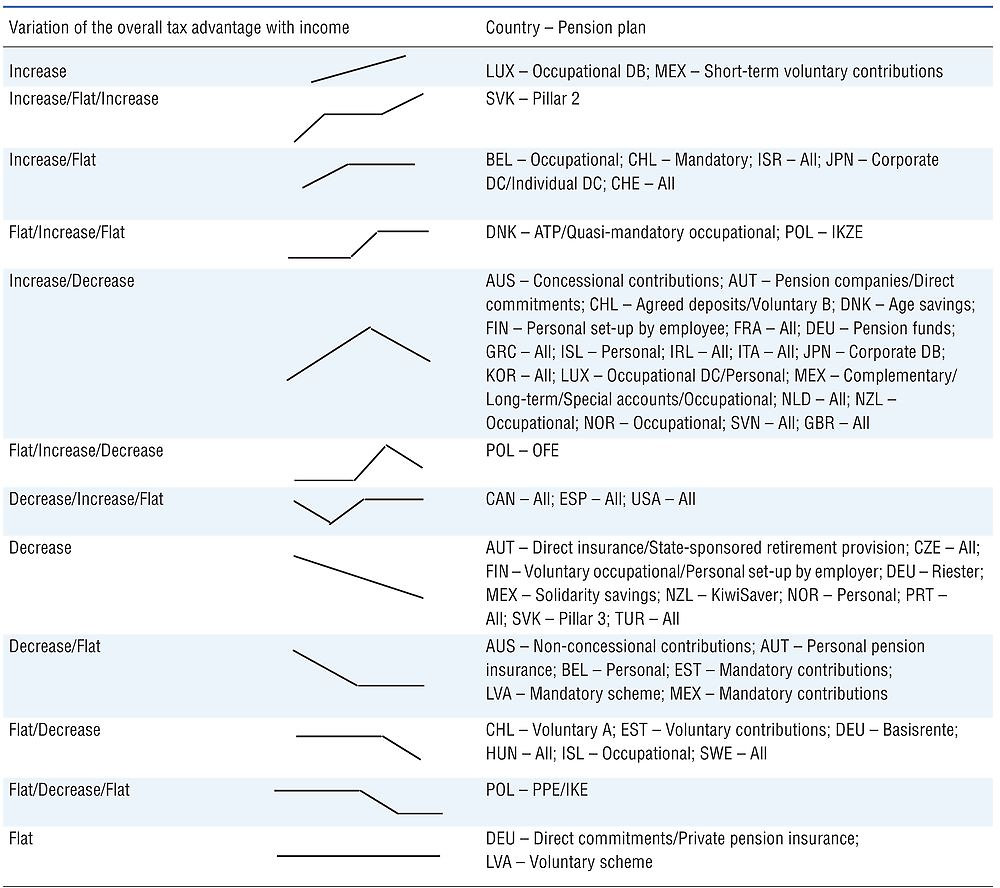
In 20 OECD countries, there is at least one type of pension plan for which the overall tax advantage increases with income and it decreases after certain level of income. Table 2.6 identifies 12 groups of pension plans according to the way the overall tax advantage varies with the income level. The variation of the overall tax advantage with income is the result of the different tax regimes, the plan-specific limits on the amount of contributions attracting tax relief and the characteristics of the personal income tax system in each country. The group with most countries in it is that in which medium-income individuals get the largest tax savings when contributing to a private pension plan rather than to a traditional savings account, because the overall tax advantage first increases with income but then decreases once caps or limits on tax relief are reached.
Low-income individuals get the largest tax savings in 19 countries, for selected pension plans. For most of these pension plans, there is a financial incentive from the state in the form of a matching contribution or of a subsidy. However, there are other ways to achieve the same result. Personal pension plans in Portugal can be used as an illustration. A “tEt” tax regime applies to them: 20% of contributions are tax deductible, up to a limit which varies with age; returns on investment are tax-exempt; and 15% of the annuity is subject to taxation at the marginal rate of income tax. When compared against a traditional savings account, where contributions are subject to personal income tax and returns are taxed at the fixed rate of 28%, the overall tax advantage obtained with a personal pension plan decreases with income. This is mainly because the tax advantage on returns decreases with income (the tax paid on returns in the traditional savings account represents a lower share of the present value of contributions for higher-income individuals because of the fixed tax rate).
Conversely, high-income individuals enjoy the largest tax savings in 10 countries, for selected plans. This is usually because there is no limit on the tax-deductibility of contributions (e.g. mandatory contributions in the Slovak Republic).
Figure 2.5 shows that the choice of the benchmark savings vehicle is also important. For 23 OECD countries, the overall tax advantage that individuals get when contributing to a private pension plan changes when the benchmark changes; for the other 12 countries, the benchmark savings vehicle does not matter. In most cases, the overall tax advantage is lower when the benchmark is a mutual fund rather than a traditional savings account (e.g. those in Figure 2.5 except Luxemburg, Spain and Turkey).17 This stems from the fact that some forms of investment income attract a more favourable tax treatment in a mutual fund than in a traditional savings account, thus lowering the tax advantage on returns derived from the non-taxation or lower taxation of returns in private pension plans. For example, in Canada, returns on investment are taxed at the individual’s marginal rate of income tax in traditional savings accounts. However, for mutual funds, 50% of capital gains from shares and bonds are tax-exempt, with the rest being taxed at the individual’s marginal rate of income tax. Conversely, the overall tax advantage increases in the case of a mutual fund benchmark in Belgium, Korea, Luxembourg, Slovenia and Turkey. Again, the taxation of returns on investment is the cause for the change.
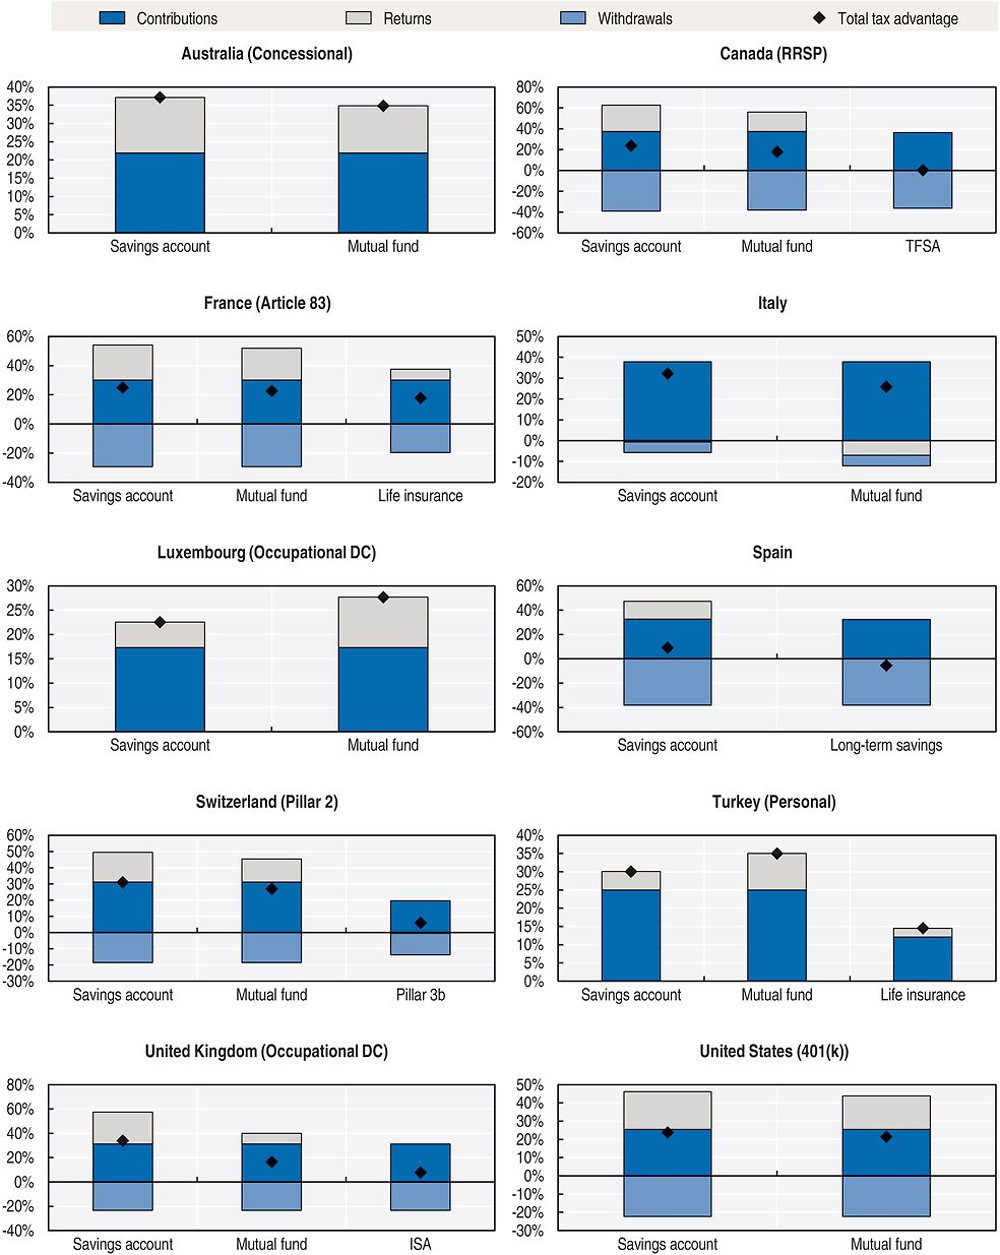
Finally, in some countries, there exist other commonly used savings vehicles with attractive tax treatments that may lower the overall tax advantage of saving for retirement in private pension plans. This is the case in Canada with Tax-Free Savings Accounts (TFSAs), in France with life insurance contracts, in Spain with long-term savings plans, in Switzerland with pillar 3b plans, in Turkey with life insurance contracts and in the United Kingdom with Individual Savings Accounts (ISAs). In these countries, the overall tax advantage when saving in a private pension plan is lower when choosing those special savings accounts as comparators. In Canada, Spain and the United Kingdom, a “TEE” tax regime applies to TFSAs, long-term savings plans and ISAs respectively. Contributing to a private pension plan as compared to one of these savings vehicles therefore does not bring any tax advantage on returns on investment. In the case of Switzerland, an “EET” tax regime applies to pillar 3b plans, just as for private pension plans (the tax relief on contributions is however more limited for pillar 3b plans). Regarding life insurance contracts, a “Ttt” tax regime applies in France and a “ttE” tax regime applies in Turkey.
2.3. Conclusions
This chapter has assessed whether the tax treatment of retirement savings vehicles in different OECD countries provides an advantage for people to save for retirement. The analysis has calculated the overall tax advantage that the tax treatment of saving for retirement provides in different types of pension plans compared to a benchmark savings vehicle. This indicator represents the amount saved in taxes paid by an individual over their lifetime when contributing the same pre-tax amount to a private pension plan instead of a benchmark savings vehicle. It includes the effect of state financial incentives, such as flat-rate subsidies and matching contributions, which can be considered as tax credits paid into the pension account of eligible individuals.
In most OECD countries, the tax treatment of retirement savings provides a tax advantage when people save for retirement instead of saving in other traditional savings vehicles. The size of the overall tax advantage however varies and depends on the tax regime applied to pension plans and savings vehicles, as well as on the characteristics of the personal income tax system (i.e. the tax brackets and the tax rates), the income level, the amount saved, the length of the contribution period, the type of pay-out option, the benchmark savings vehicle chosen as a comparator and other financial and economic parameters.
The amount of tax saved by an average earner when contributing to a private pension plan rather than to a traditional savings account varies greatly across countries. Usually, the positive overall tax advantage derives from a preferential tax treatment for private pension contributions and returns on investment (as compared to a traditional savings account) which is not offset by the potential taxation of benefits.
While many types of pension plans in different OECD countries offer the largest overall tax advantage to medium-income individuals, there are ways to target tax advantages at low-income individuals or to smooth out the tax advantage across the income scale. Flat-rate state subsidies for example significantly increase the overall tax advantage for low-income individuals, as the value of the subsidy is higher for low-income individuals in relative terms. In addition, tax credits on personal income tax and state matching contributions paid into the private pension plan can be used to smooth out the tax advantage across income groups. A state matching contribution provides the same tax advantage on contributions to all income groups, until the contribution cap is reached. It is the same for the tax credit, except that low-income individuals, who pay little or no income tax, benefit less from tax credits.
Tax advantages can encourage people to save for longer periods, but not necessarily to save more in private pension plans. Indeed, individuals contributing longer can expect a larger overall tax advantage, independently of the tax regime applied to their private pension plan. This is due to the effect of compound interest. The longer the contribution period, the longer the investment income can accumulate and the larger is the tax advantage on returns on investment. On the other hand, higher contribution rates may translate into lower tax advantages for high-income individuals, in particular when tax reliefs are provided up to certain limits. Moreover, an individual entitled to a state subsidy will not get any additional tax advantage when saving above the amount laid down in the plan rules that prompts the maximum subsidy.
Straightforward and simple tax rules applying to the private pension system as a whole may increase people’s confidence and help to increase participation in and contributions to private pension plans. In a majority of countries, different tax regimes apply to different types of pension plans and savings vehicles at the national level. In addition, the progressivity of income tax systems and the limits that apply to certain tax reliefs modify the tax advantage by income level. This may create confusion for people who may not have the ability to understand the differences, assess the different options and choose the best one for them.
This chapter has measured the overall tax advantage that individuals may enjoy when saving for retirement. However, whether people actually increase retirement savings as a result of these tax advantages is an empirical question that needs to be investigated. In addition, it is important to assess the convenience of tax advantages and financial incentives from the point of view of the state, considering situations where national savings increase or remain constant. These issues will be addressed in future OECD work.
References
OECD (2015a), Pensions at a Glance 2015: OECD and G20 indicators, OECD Publishing, Paris, https://doi.org/10.1787/pension_glance-2015-en.
OECD (2015b), “Stocktaking of the Tax Treatment of Funded Private Pension Plans in OECD and EU Countries”, www.oecd.org/pensions/financial-incentives-retirement-savings.htm.
This annex describes the framework and assumptions used for the stylised tax regimes and the different pension plans that exist in OECD countries to assess the tax advantage provided to individuals saving for retirement in a funded private pension plan. The assessment of the tax advantages is done by comparing the tax treatment of saving in a funded private pension plan instead of a benchmark savings vehicle.
2.A1.1. Definition of the indicator
The overall tax advantage is defined as the difference in the present value of tax paid on contributions, returns on investment and withdrawals between a benchmark savings vehicle and a private pension plan. It represents the amount saved in taxes by the individual over their working and retirement years when contributing to a private pension plan instead of to a benchmark savings vehicle. This indicator is calculated for a flow of contributions made yearly over the career between an initial age, e.g. 20, and the age at which the individual retires, e.g. 65, given a constant contribution rate. It is expressed as a percentage of the present value of contributions.
The overall tax advantage allows assessing the tax advantage over the entire career of an individual by summing-up the effects of the tax treatment of private pension plans induced by a yearly flow of contributions. In addition, it can be calculated for all types of pension plans, including DB plans, and can appropriately account for caps or limits on the amount of contributions attracting tax relief and ceilings on the lifetime value of pension assets, when relevant.
The indicator is calculated for individuals on different levels of income. The level of income is expressed as a multiple of the annual average wage, from 0.2 to 16 times. The annual average wage in 2015 is taken from the OECD Average annual wages database for each country. During the contribution period, wages are assumed to grow in line with inflation and productivity. The analysis assumes constant values for inflation, the growth rate of productivity, the real rate of return on assets and the real discount rate for the entire simulation (Table 2.A1.1).
2.A1.2. Benchmark savings vehicles
Each type of private pension plan in a given country is compared against different benchmark savings vehicles. The analysis considers at least two benchmark savings vehicles for each country: a traditional savings account and a mutual fund (or collective investment scheme). When other savings vehicles are commonly used in a given country (e.g. special savings accounts, life insurance contracts), they are also considered.
For comparability purposes, the portfolio of the benchmark savings vehicle is assumed to be the same as the one for the private pension plan. Funds are assumed to be invested in only two asset classes: fixed income and shares. Other asset classes, such as real estate or cash and deposits, are not considered.
In addition, the same pay-out option as for the private pension plan is also assumed for the benchmark. All pay-out options available in a country are considered. These are usually lump sum payments, life annuities (inflation-indexed or not) and programmed withdrawals.18 Payments from annuities and programmed withdrawals are calculated according to the life expectancy at retirement given by the most recent life tables for both sexes in the Human Mortality Database (the expected age of death is therefore assumed to be fixed).19
2.A1.3. Personal income tax system
The analysis uses the tax schedule and tax brackets in place in each country in 2015 to calculate income tax and derive marginal tax rates. Both national (respectively federal) and local (respectively state) personal income tax systems are taken into account. Personal allowances and tax credits are also taken into account when they are available to all taxpayers. The income limits for all tax brackets, the allowances and the credit amounts are assumed to be indexed to inflation going forward, unless country-specific rules indicate otherwise.
2.A1.4. The calculation of contributions and their taxation
The analysis assumes the same amount of pre-tax contributions for both the private pension plan and the benchmark savings vehicle. The amount of money saved in a private pension plan can comprise employee, employer and government contributions, while the amount saved in a benchmark savings vehicle generally only comprises the individual contribution. Assuming different levels of contributions to both plans would prevent distinguishing between the impact of different contribution levels and the impact of the tax treatment of private pension plans on the overall tax advantage. The analysis therefore assumes that the individual pays the full equivalent total employee and employer contribution in the savings vehicle.20
State contributions only accumulate in the relevant plan for eligible individuals. State matching contributions and state subsidies are increasingly common ways to promote savings for retirement in private pension plans. These amounts are deposited in the private pension plan for eligible individuals. As this type of contribution is not part of the wage bill, there is no reason to count them as well for the benchmark savings vehicle. In addition, the analysis considers state contributions as a negative tax on contributions to private pension plans, which allows identifying their impact on the overall tax advantage.
Funded private pension plans based on accumulated rights (occupational DB plans)
Contribution rates in occupational DB pension plans at the national level are not easily available. In a DB plan pension benefits are defined according to a formula based on an accrual rate, the salary and the length of employment. The level of benefits obtained for a given contribution is not known. However, the analysis calculates the contribution rate that would be needed in a plan with asset accumulation to reach the same level of benefits than the DB pension plan. To that end, the analysis proceeds with the following steps:
-
Calculate the pension income received from a DB plan according to the country-specific formula;21
-
Calculate the equivalent amount of assets accumulated at retirement to get this annual payment by reversing the annuity formula;
-
Calculate the after-tax contribution rate needed to provide the same amount of assets at retirement with a plan with asset accumulation (e.g. DC plan or a savings vehicle) by dividing the amount of assets calculated under step 2 by the amount of assets that would have been accumulated in a plan with asset accumulation had the whole salary been invested over the career;
-
Taking into account the tax treatment of contributions for the DB pension plan, calculate back the tax due on contributions to the DB pension plan and the pre-tax contribution rate;
-
Use this pre-tax contribution rate for the benchmark savings vehicle. The benchmark savings vehicle and the private pension plan therefore receive the same pre-tax contribution.22
Even though actual contributions made to the DB pension plan are not known for certain (because there is no direct link in DB plans between contributions and benefits), step 4 uses the contribution rate calculated under step 3 to estimate how much may have been contributed to the DB plan and to approximate the tax due on these contributions, when relevant.
Funded private pension plans based on assets accumulated (DC, hybrid and personal plans)
The analysis assumes a constant contribution rate during the career for occupational DC plans, personal pension plans and occupational hybrid DB plans (in which benefits depend on a rate of return credited to contributions). A 10% contribution rate is assumed, except for private pension plans in which mandatory contribution rates and minimum contributions rates apply. Caps on contributions are applied when relevant.
Taxation of contributions
The analysis applies the specific tax treatment in place in each country for contributions to the private pension plan and the benchmark savings vehicle respectively. When contributions are made from income that has already been taxed, as is usually the case for savings vehicles, the analysis multiplies the pre-tax contribution by the appropriate tax rate to calculate the tax already paid. The appropriate tax rate can be the individual’s marginal rate of income tax (which varies depending on the level of income) or any flat tax rate defined by regulation. When contributions are tax-exempt up to a limit (expressed either as a percentage of the salary or as an absolute amount), any excess contributions, when allowed, are taxed at the appropriate tax rate. Tax credits are calculated as a proportion of the pre-tax contributions and considered as a negative tax on contributions.
2.A1.5. The taxation of returns on investment
The amount of assets accumulated at the end of each year is the sum of the amount of assets accumulated at the beginning of that year, the new after-tax contributions and the investment income earned. This amount is reduced by the tax due on returns on investment earned when they are taxed.
The tax treatment of returns on investment may depend on the portfolio composition. The analysis assumes a portfolio composed of 60% government bonds and 40% equities. When capital gains and dividends attract a different tax treatment, the analysis assumes that investment income derives one-third from dividends and two-thirds from capital gains. The analysis assumes a holding period of securities of 6.7 years when this criteria matters for the tax treatment of investment income.23
2.A1.6. The calculation of withdrawals and their taxation
For DB plans, only life annuities are considered, as such plans usually promise a regular payment for life. The life annuity payment is calculated according to the country-specific formula when available. Otherwise, expected benefits from the DB pension plan are calculated as the product between the career length, a 1.5% accrual rate and the final salary.
For DC plans, personal plans and savings vehicles, the analysis calculates the annuity payment by transforming the estimated assets accumulated at retirement into a stream of annual payments. It calculates the benefit payment of an annuity certain priced using the annuity formula, based on the life expectancy at the age of retirement and a constant discount rate. The annuity payments can either be fixed in nominal terms or inflation-indexed.24
In the case of programmed withdrawals, the expected age of death is assumed to be fixed and is defined by adding the remaining life expectancy at retirement to the age of retirement. The rate of return on investment remains constant, at the same level as during the accumulation phase. The same tax treatment than the one applied during the accumulation phase is assumed to continue applying during the pay-out phase, unless country-specific rules indicate otherwise.
After-tax withdrawals are calculated as before-tax withdrawals minus the tax due on withdrawals, calculated by applying the appropriate tax rate. The analysis takes into account the impact of public provision when calculating the tax due on withdrawals. This means that it accounts for the fact that retired individuals may also receive a public pension. To that end, the analysis first estimates the level of the public pension that the individual may receive, according to the level of income while working. The OECD pension models provide the gross replacement rates from mandatory public pension schemes, taking into account potential coverage by private schemes (cf. Table 6.4 in the 2015 edition of the OECD Pensions at a Glance for three income levels). The analysis applies the different replacement rates to final earnings depending on the individual’s level of income. Public pension payments are indexed according to country-specific rules. The derived public pension income is added to withdrawals from the private pension plan and from the benchmark savings vehicle. The total taxable income is then run through the personal income tax brackets to determine the tax due on that income.
2.A1.7. The taxation of funds accumulated
Some countries also tax the total amount of funds accumulated in private pension plans. This tax can take several forms. In some countries (e.g. Belgium), funds accumulated (returns on investment and past contributions) are taxed at a given age. In some other countries (e.g. the United Kingdom), the total amount of funds accumulated at retirement is taxed upon withdrawal when it exceeds a certain limit. In all cases, the analysis adds this tax to any tax due on withdrawals.
2.A1.8. Stylised tax regimes
Coverage of the analysis
The analysis considers a funded private pension plan in which benefits are calculated based on assets accumulated (e.g. occupational DC plans and personal plans). The stylised tax regimes are the results of the combination of different tax treatments for contributions, returns on investment and withdrawals for that private pension plan.
The benchmark savings vehicle is a traditional savings account for which the “TTE” tax regime applies, i.e. contributions and returns on investment are subject to personal income tax, and withdrawals are tax-exempt.
Personal income tax system
The analysis assumes a common hypothetical personal income tax system to compare the stylised tax regimes. It uses the tax rates and income tax brackets in force in France in 2015 (see Table 2.A1.2), although some specificities of the French system are not taken into account.25 The income limits for all brackets are assumed to be indexed to inflation. The average earner in the hypothetical personal income tax system is the average earner in France (earning EUR 36 491 in 2015 according to the OECD Average annual wages database).
Construction of the stylised tax regimes
The different stylised tax regimes result from the combination of different tax treatments for contributions, returns on investment and pension payments/withdrawals, as presented in Table 2.A1.3. Each stylised tax regime is symbolised by the combination of three letters representing the tax treatment for contributions, returns on investment and withdrawals. For example, the “EET” stylised tax regime assumes that contributions are tax-deductible up to EUR 7 300 a year, returns on investment are tax-exempt and withdrawals are subject to personal income tax. Partial tax relief on contributions can be given in two ways, either assuming that only part of the contributions is tax-deductible or that a tax credit is calculated based on the amount contributed. For example, the “tEE” stylised tax regime assumes that 20% of the contributions are tax-deductible up to EUR 7 300 a year, while the “tEE (tax credit)” stylised tax regime assumes that contributions are subject to personal income tax with a tax credit equivalent to 10% of the contributions up to EUR 7 300 a year. In both cases, returns on investment and withdrawals are tax-exempt.
In addition, the analysis considers that individuals may be entitled to state financial incentives, either subsidies or matching contributions. In the case of state subsidies, the analysis assumes that a maximum flat-rate subsidy of EUR 365 is paid into the pension account if the individual contributes at least 5% of wages. The flat-rate subsidy, which represents 1% of wages for the average earner in 2015 and grows in line with inflation, is proportionately reduced to zero for lower contribution rates. In the case of state matching contributions, the analysis assumes that 20% of individual contributions are matched by the state and paid into the pension account, up to a maximum state contribution of EUR 1 825 (this limit represents 5% of wages for the average earner in 2015 and grows in line with inflation).
The analysis focuses on 16 selected stylised tax regimes based on their relevance and importance in different OECD countries, as described in Table 2.2. Combining all the possible options for the tax treatments of contributions, returns on investment and pension payments/withdrawals and the type of state financial incentive would lead to 108 stylised tax regimes. Most of those combinations have no counterpart in the real world.
Payments from annuities and programmed withdrawals are calculated according to the life expectancy at retirement given by the 2013 French life table for both sexes from the Human Mortality Database. The level of mandatory public pension that the individual may be entitled to is calculated using the OECD pension models for the OECD average. The analysis assumes that public pensions grow in line with inflation and are fully subject to personal income tax.
Notes
← 1. The statistical data for Israel are supplied by and under the responsibility of the relevant Israeli authorities. The use of such data by the OECD is without prejudice to the status of the Golan Heights, East Jerusalem and Israeli settlements in the West Bank under the terms of international law.
← 2. Contributions to private pension plans and savings vehicles, as well as benefits paid by these plans, can be subject to social contributions. These social contributions are usually levied on gross income to finance, among others, health care insurance, unemployment insurance, public pensions and disability pensions. They are not taken into account for the calculation of the overall tax advantage.
← 3. Annex 2.A1 provides the full description of the framework and assumptions to calculate the overall tax advantage.
← 4. As a consequence, the individual’s wage may move to a higher income tax bracket over time, therefore increasing the marginal tax rate.
← 5. Table 2.5 in Section 2.2 shows the tax regimes applying to different types of plans in OECD countries. Thirty-one different potential stylised tax regimes could have been selected from the regimes that exist in OECD countries. Only the most relevant ones have been selected for the analysis.
← 6. Section 2.A1.8 in the annex provides a full description of the assumptions used to build the stylised tax regimes.
← 7. With an annuity certain, individuals receive a fixed number of payments, determined according to a fixed and equal for all life expectancy defined at the age of retirement. This is different from a life-long annuity, with which individuals receive payments until death.
← 8. In the case of the “EET” stylised tax regime, the overall tax advantage is actually equalto the tax advantage on returns on investment, as the tax advantage on contributions is compensated by the tax due on withdrawals (the same average tax rate applies during the working life and during retirement for the average earner).
← 9. The overall tax advantage even ends up negative for individuals earning eight times the average wage or more in the case of the “Ett” and “EtT” stylised tax regimes. The preferential tax treatment on contributions (reduced because of the limit on tax deductibility) and on returns on investment does not compensate for the tax paid on withdrawals.
← 10. The seemingly opposite result for the “ETE” stylised tax regime is only due to the construction of the indicator. The present value of tax saved (the numerator of the indicator) actually increases with longer contribution periods, as for the other stylised tax regimes. However, the present value of contributions (the denominator of the indicator) also increases with longer contribution periods, leading to a smaller indicator.
← 11. Early retirement and late entry for the same length of the contribution period provide similar results.
← 12. With an annuity certain, individuals receive a fixed number of payments, defined according to life expectancy at the age of retirement. This is different from a life-long annuity, with which individuals receive payments until death. With programmed withdrawals, assets remain invested during retirement and the analysis assumes that individuals receive a fixed number of payments, defined according to life expectancy at the age of retirement.
← 13. The analysis however still considers a fixed time horizon for the calculations, corresponding to the remaininglife expectancy at the age of retirement.
← 14. OECD (2015b) describes the tax treatment of private pension plans in all member countries.
← 15. Solidarity savings enjoy a very generous state matching programme, as the federal government contributes 3.25 pesos for each peso contributed by the individual.
← 16. In Canada, tax rates vary according to the province or territory. The calculations assume that the individual lives in Ontario.
← 17. Also other countries not shown in Figure 2.5, such as the Czech Republic, Denmark, Finland, Greece, Hungary, Iceland, Ireland, Latvia, Mexico, and the Slovak Republic.
← 18. The model does not consider lump sum payments and programmed withdrawals for DB pension plans.
← 19. More information on the Human Mortality Database can be found at www.mortality.org/.
← 20. In addition, the same cap on contribution applies to both plans if excess contributions are not permitted in one of them.
← 21. When the formula is not available, expected benefits from the DB pension plan are calculated as the product between the career length, a 1.5% accrual rate and the final salary.
← 22. The resulting benefit at retirement may however differ as the tax treatment of the benchmark savings vehicle most likely varies from the one for the DB pension plan.
← 23. This is equivalent to assuming that 15% of the securities held in the portfolio are sold every year. Admittedly, this is based exclusively on US observations for shares (see Burman, L.E. and P.D. Ricoy (1997), “Capital gains and the people who realize them”, National Tax Journal Vol. 50, No. 3).
← 24. The annuity formula is given by 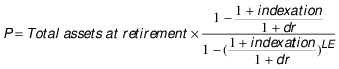 where P is the
periodic payment, indexation is equal to 0 in the case of fixed nominal payments and is equal to inflation in the case of inflation-indexed payments, dr is the discount rate and LE is the life expectancy at retirement.
← 25. The standard allowance for work-related expenses (10% of net pay), the tax credit for low-income individuals and the exceptional contribution for high-income individuals are not taken into account. Social taxes (CSG and CRDS) are disregarded as well for the stylised tax regimes.