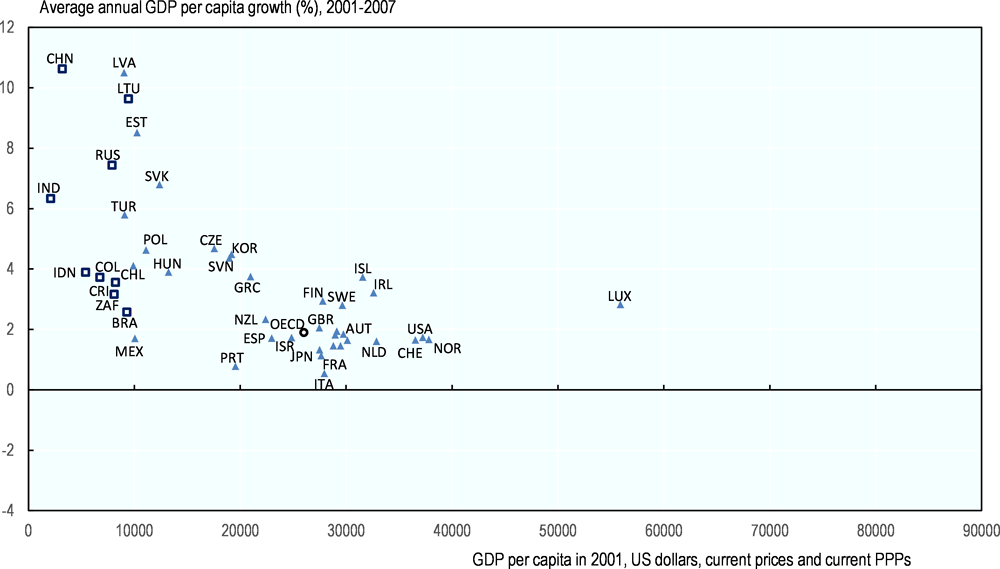
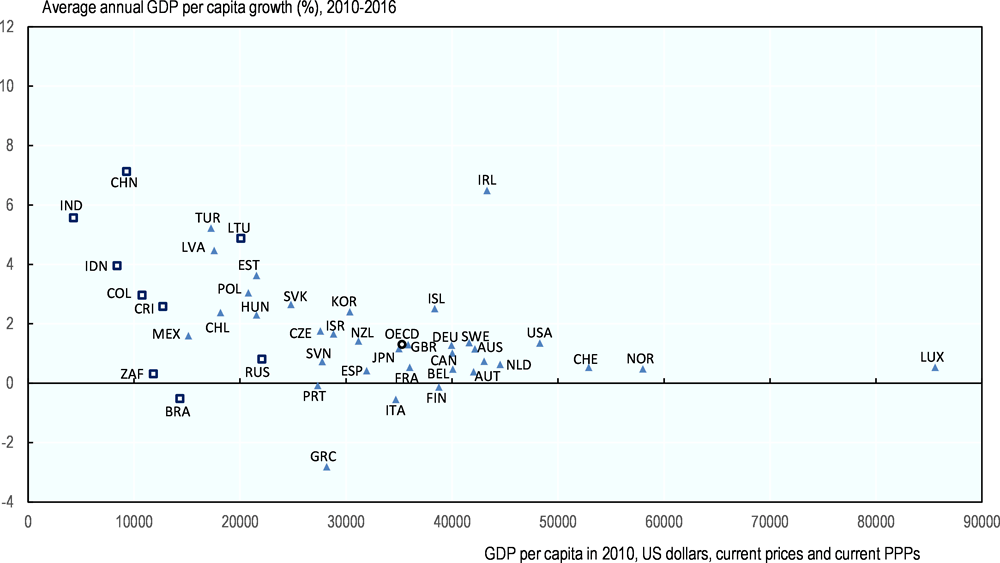
GDP per capita convergence
GDP per capita convergence, often described as the catch-up process, refers to the process by which less advanced economies with lower-income per capita converge towards more advanced economies through higher growth rates, as they capitalise on technology transfer, inward investment, and relatively lower labour costs.
Pre-crisis trends pointed to a rapid pace of convergence of countries with below average GDP per capita levels towards the OECD average. However, post-crisis trends point to a slowdown in the pace of convergence in many economies, particularly in Eastern Europe.
Definition
GDP is measured as gross value added in market prices. Data on GDP at current prices are sourced from the OECD National Accounts Statistics (database). For international comparisons, these data are converted to a common currency, US dollars, using Purchasing Power Parities (PPPs). Unlike currency exchange rates, the PPPs are currency converters that control for differences in the price levels between countries, making possible to compare absolute volumes across them (Chapter 7. ).
Information on data for Israel: https://doi.org/10.1787/888932315602.
Comparability
For Colombia, indicators are based on the System of National Accounts 1993 (1993 SNA). For the Russian Federation, the indicators are on a 1993 SNA basis for data up to 2010 and 2008 SNA thereafter. For all the other countries, the indicators presented are based on the 2008 SNA. The 2008 SNA includes items such as the capitalisation of research and development (R&D) and military weapons systems which increase GDP levels (Chapter 7. ).
Population estimates are comparable across countries and are also sourced from the OECD National Accounts Statistics (database). However, some care is needed in interpretation as countries like Luxembourg and, to a lesser extent, Switzerland, have a relatively large number of frontier workers that contribute to GDP but are excluded from the population figures. In this context, cross-country comparisons of income per capita based on gross or net national income are also relevant.
Sources and further reading
OECD Productivity Statistics (database), https://doi.org/10.1787/pdtvy-data-en.
OECD National Accounts Statistics (database), https://doi.org/10.1787/na-data-en.
OECD (2001), Measuring Productivity – OECD Manual, https://doi.org/10.1787/9789264194519-en.