Chapter 5. Productivity trends in G7 countries
Trends in labour productivity growth
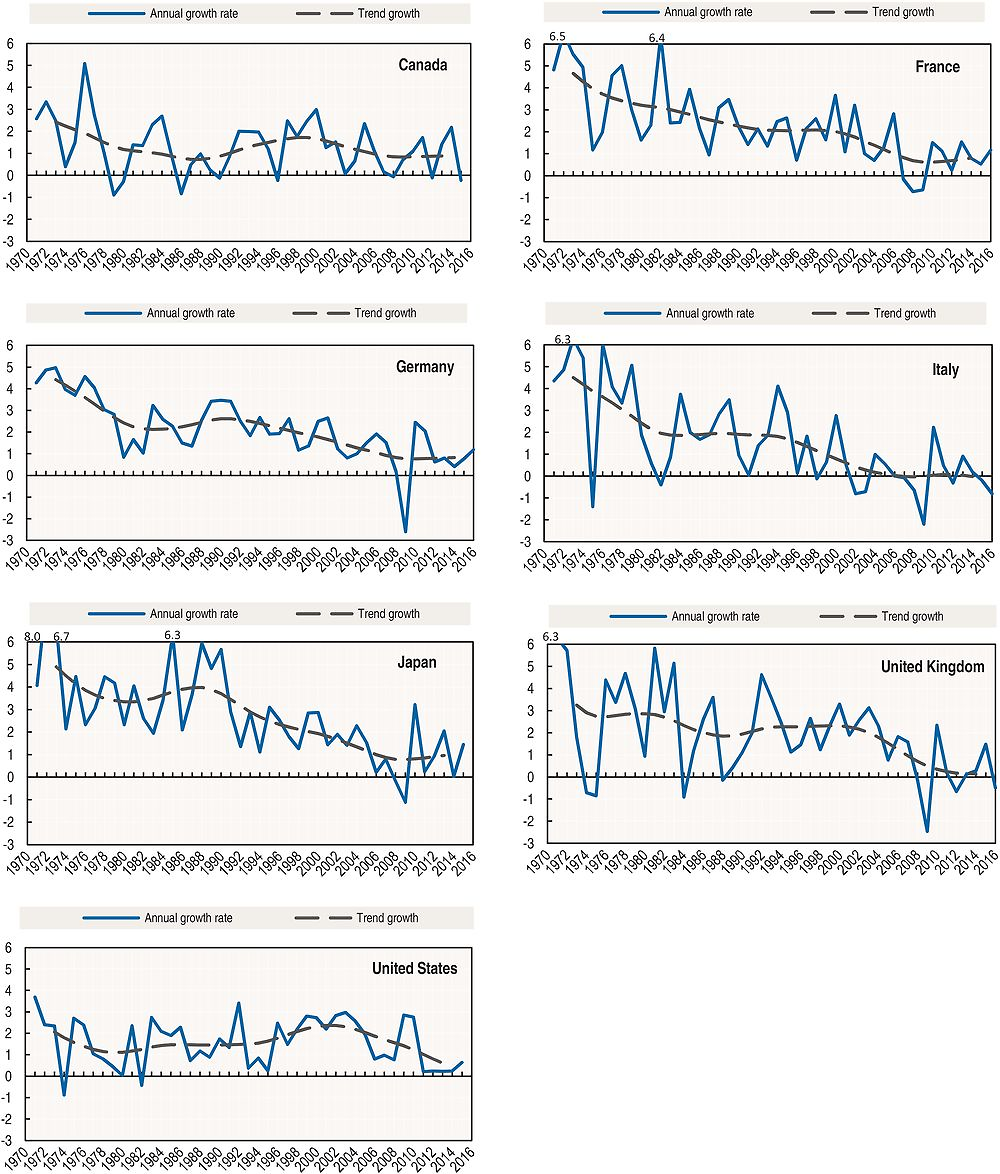
Labour productivity is a key driver of economic growth and living standards. Understanding whether the slowdown in productivity growth has been driven by structural factors and/or by reactions to the economic cycle is hence important for policy makers. This requires decomposing the time series of actual annual labour productivity growth into a trend (or structural) component and a cyclical component.
The slowdown in labour productivity growth is a common feature of all major advanced economies and underlying long-term trends suggest that it was underway prior to the crisis. Indeed, over the 10 years preceding the crisis, trend labour productivity growth declined in all G7 countries, particularly in France, Italy and the United Kingdom. In the case of Canada, the United Kingdom and the United States, the decline since the end of the 1990s marked a reversal of growth that coincided with the IT revolution. In other countries, trend labour productivity growth has shown a gradual decline over the past 40 years from relatively high rates. The volatility in the cycle introduced by the crisis necessitates some caution in interpreting recent trends.
Definition
Labour productivity is defined as GDP per hour worked and its growth rate is calculated as its first natural-log difference. The decomposition of labour productivity growth into a trend and a cyclical component is done by applying the Hodrick-Prescott (HP) filter (Hodrick and Prescott, 1997), where the trend component is meant to capture the long-term growth of the series and the cyclical component is the deviation from that trend. In the HP filter, the smoothness of the trend depends on a parameter usually identified as λ. The larger the value given to λ, the smoother is the trend.
Comparability
Like other filters, one limitation of the HP filter is that the estimated trend is more sensitive to transitory shocks or short-term fluctuations at the beginning and at the end of the sample period. This results in a sub-optimal performance of the HP filter at the endpoints of the series (Baxter and King, 1999). In view of this property, trend series are not published for the first and last two years for which data on actual labour productivity growth are available.
An important aspect of the HP filter is the value of the smoothing parameter λ. While for quarterly data it has been typically assumed a value of λ = 1600 (as recommended by Hodrick and Prescott, 1997), there is less agreement on the value to be used when the filter is applied to other frequencies (e.g. annual, monthly). The value of λ selected here is 54.12 and has been determined by calibrating the Hodrick-Prescott filter in such a way that cycles shorter than 9.5 years are attenuated by 90% or more (Chapter 6).
Official data for Germany after unification are available only from 1991 onwards. Estimates for Germany as a whole back to 1970 have been derived by applying the relevant growth rates for West Germany to 1991 data.
Sources and further reading
Baxter and King (1999), “Measuring business cycles: Approximate band-pass filters for economic time series”, The Review of Economics and Statistics, Vol. 81, No. 4.
Hodrick, R. and E. Prescott (1997), “Postwar U.S. business cycles: An empirical investigation”, Journal of Money, Credit and Banking, Vol. 29, No. 1.
OECD Productivity Statistics (database), https://doi.org/10.1787/pdtvy-data-en.
OECD (2001), Measuring Productivity – OECD Manual, https://doi.org/10.1787/9789264194519-en.
Trends in multifactor productivity and capital deepening
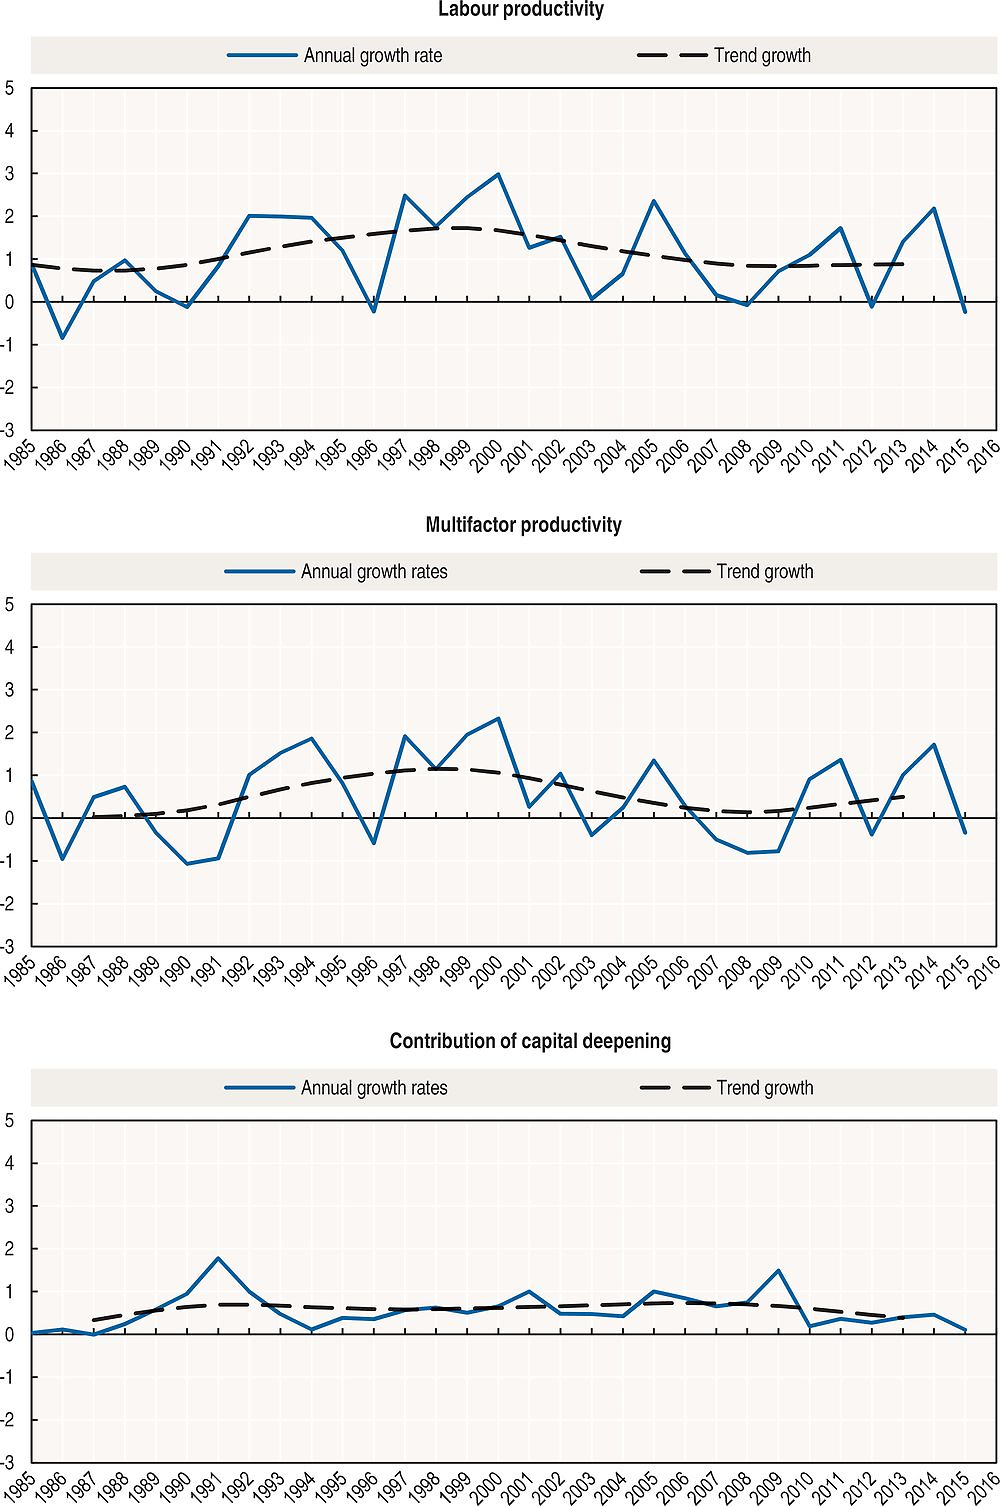
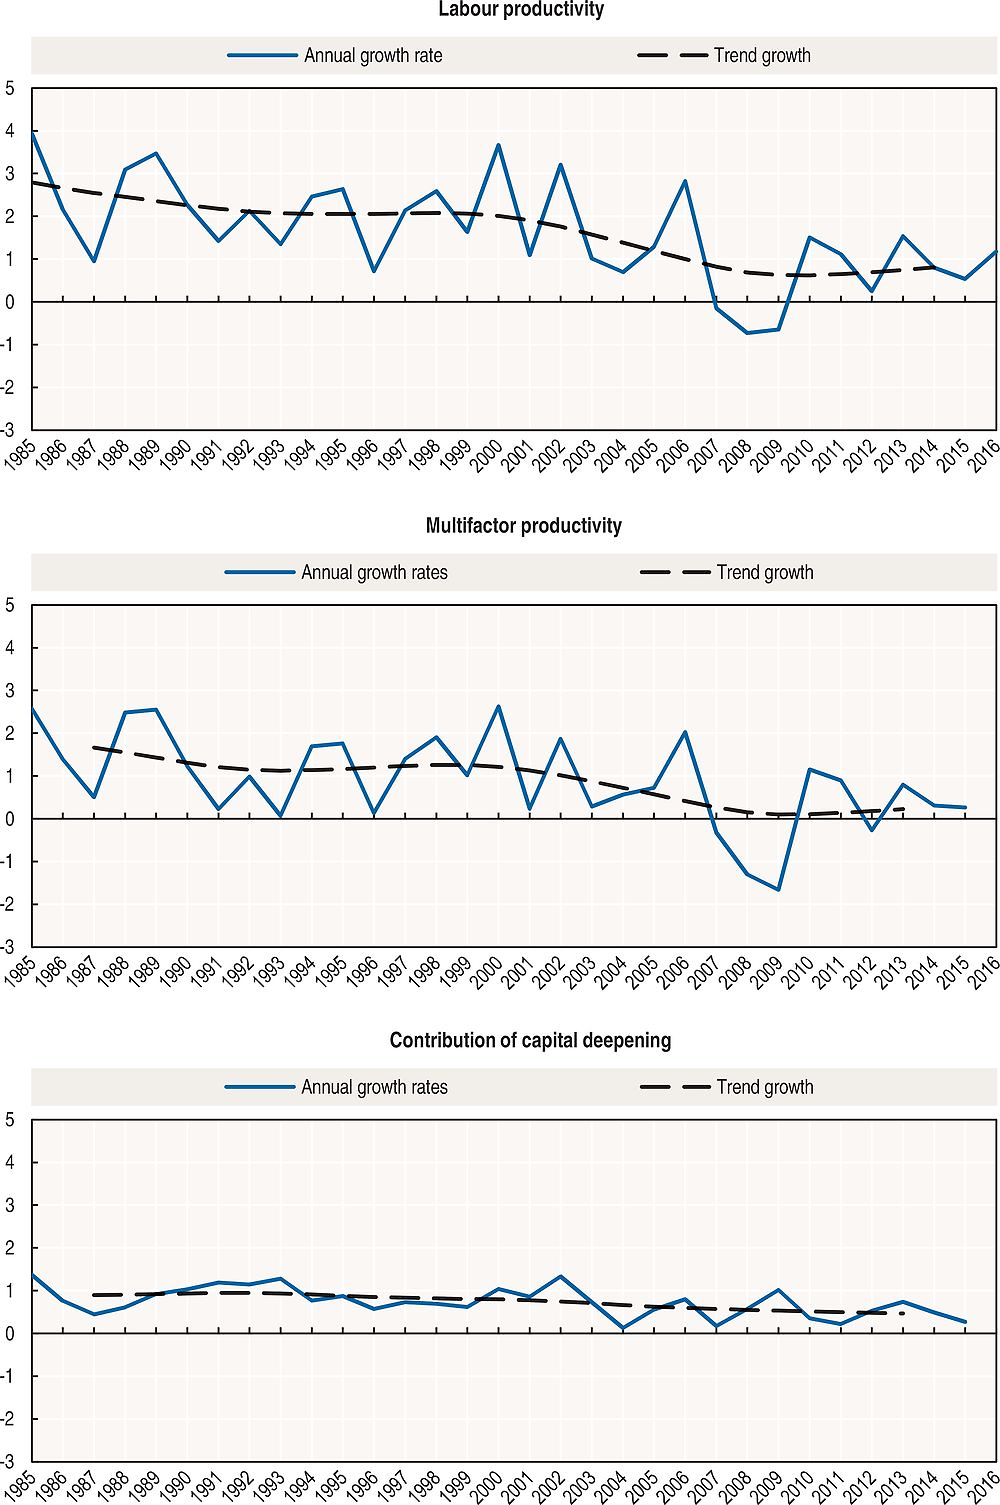
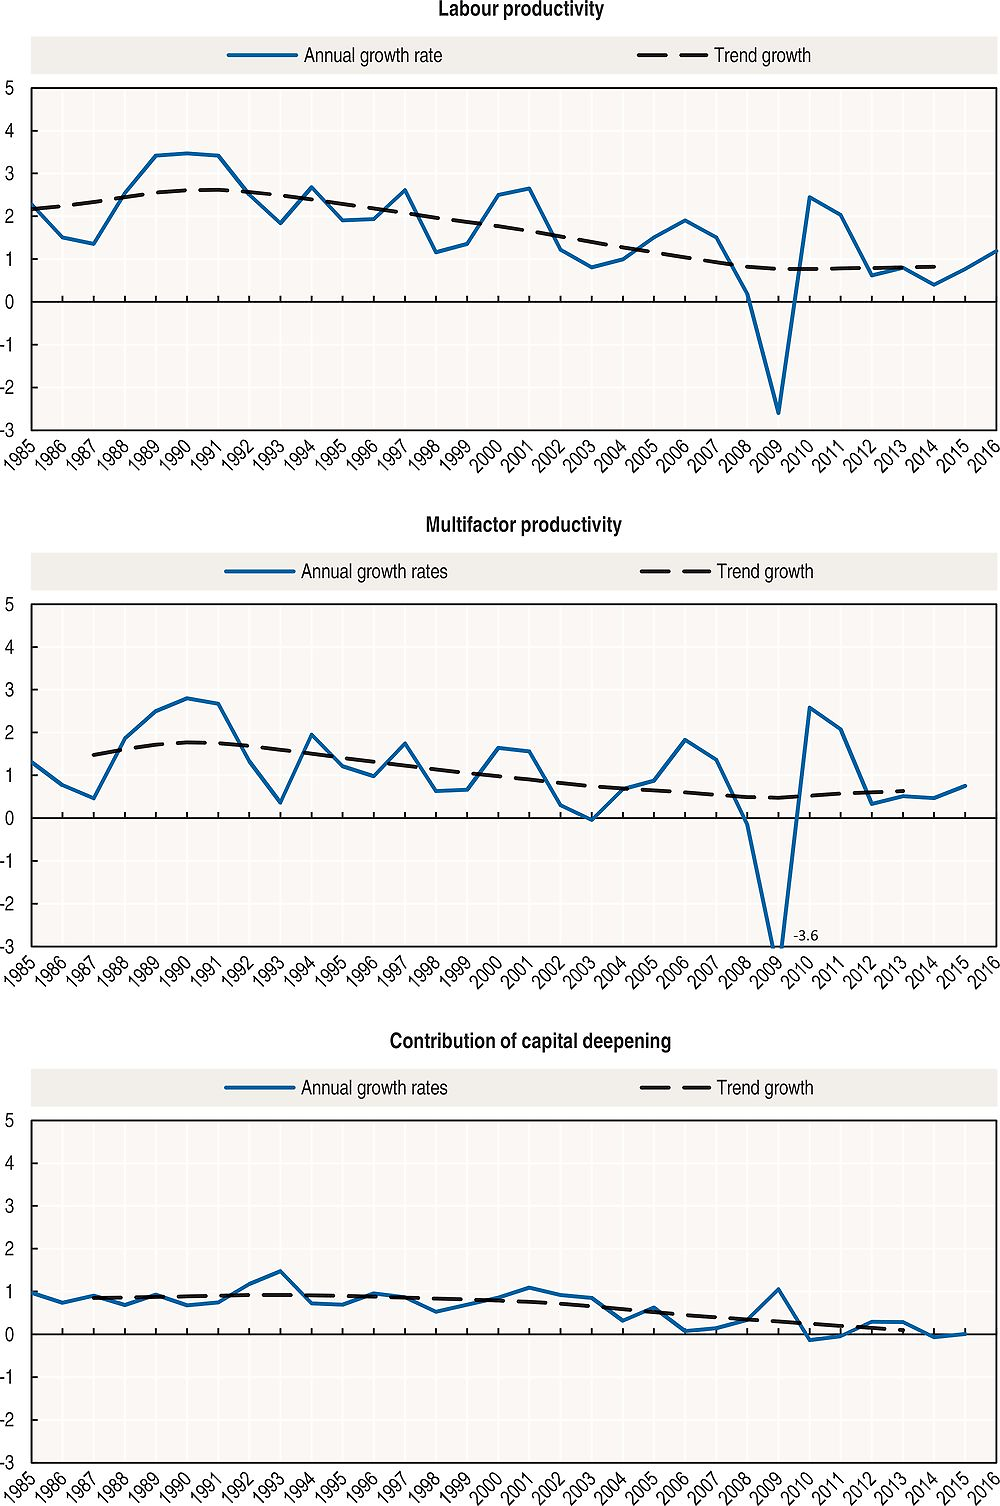
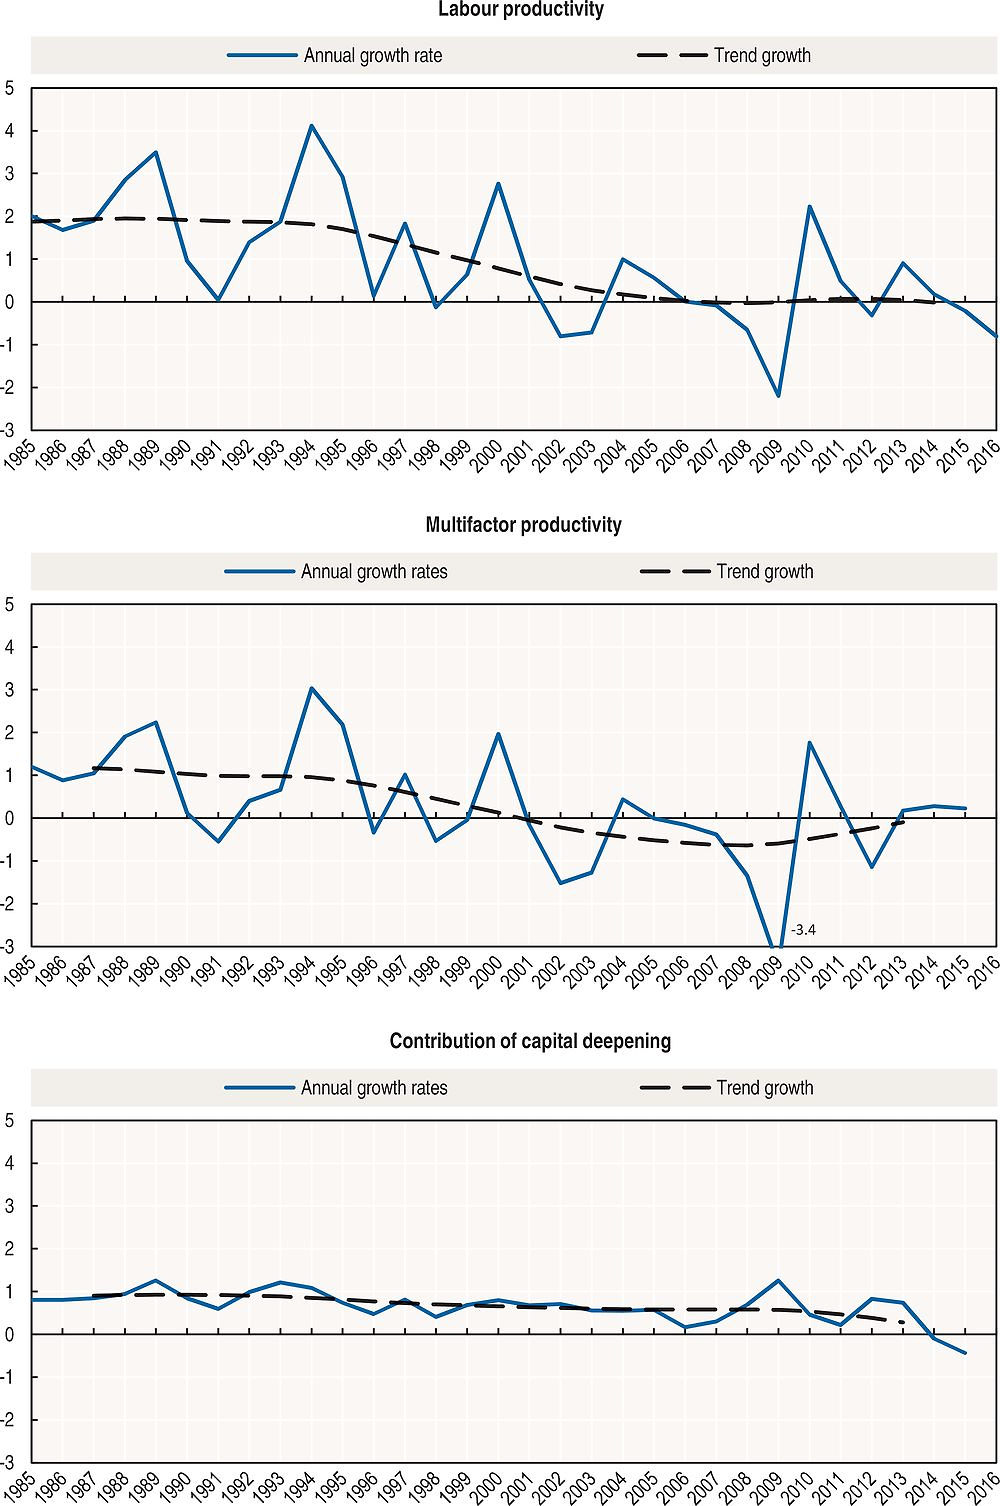
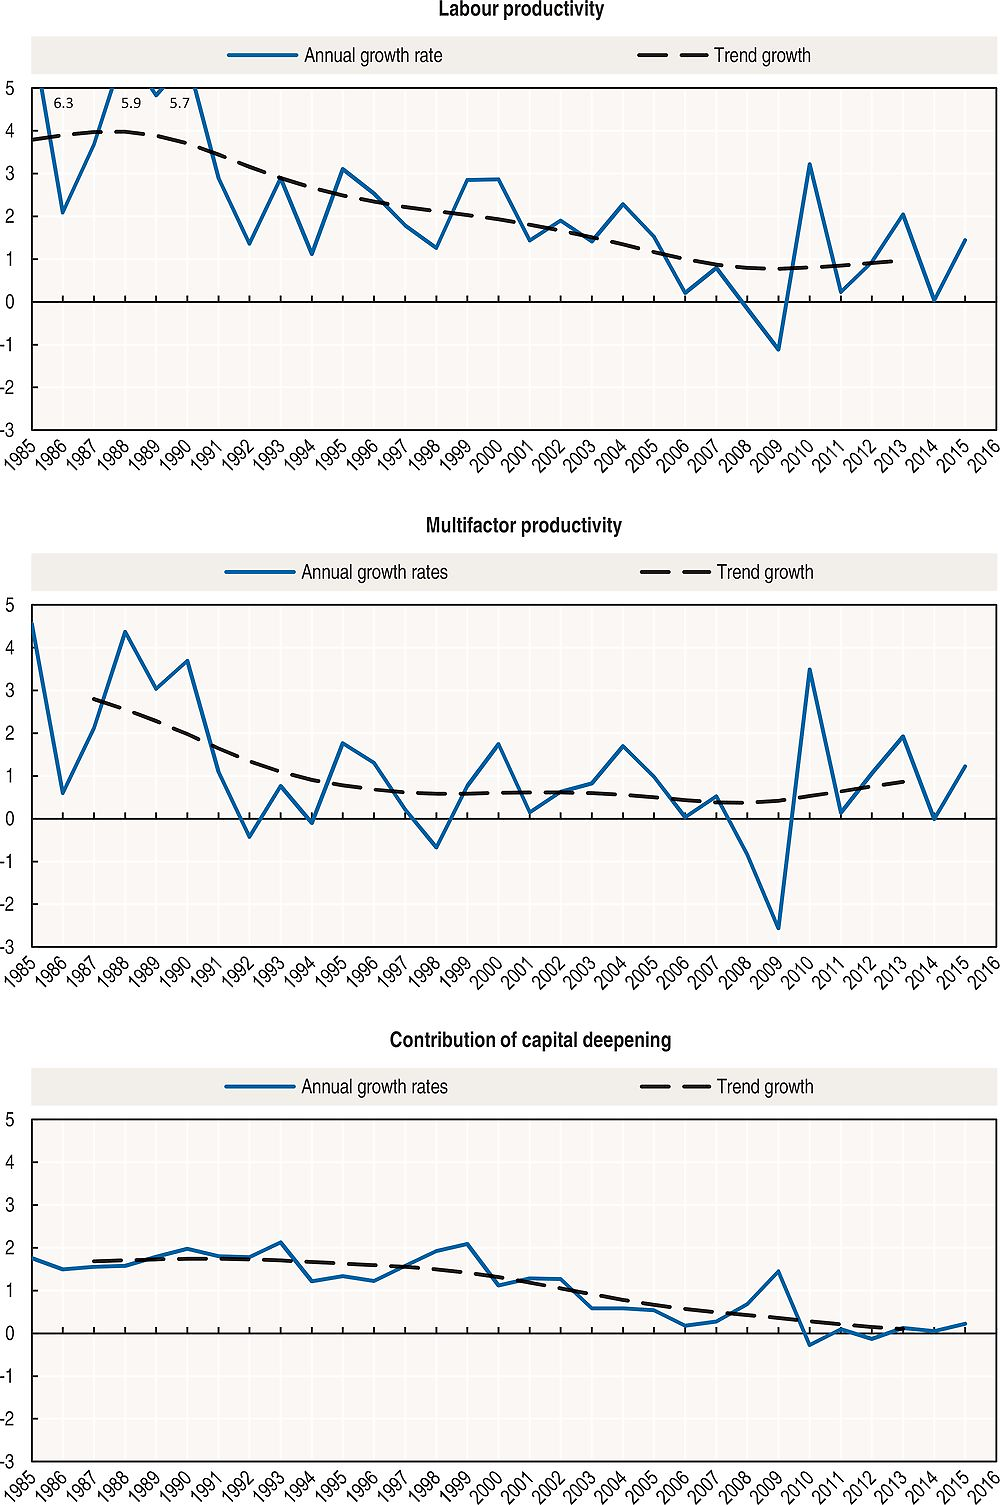
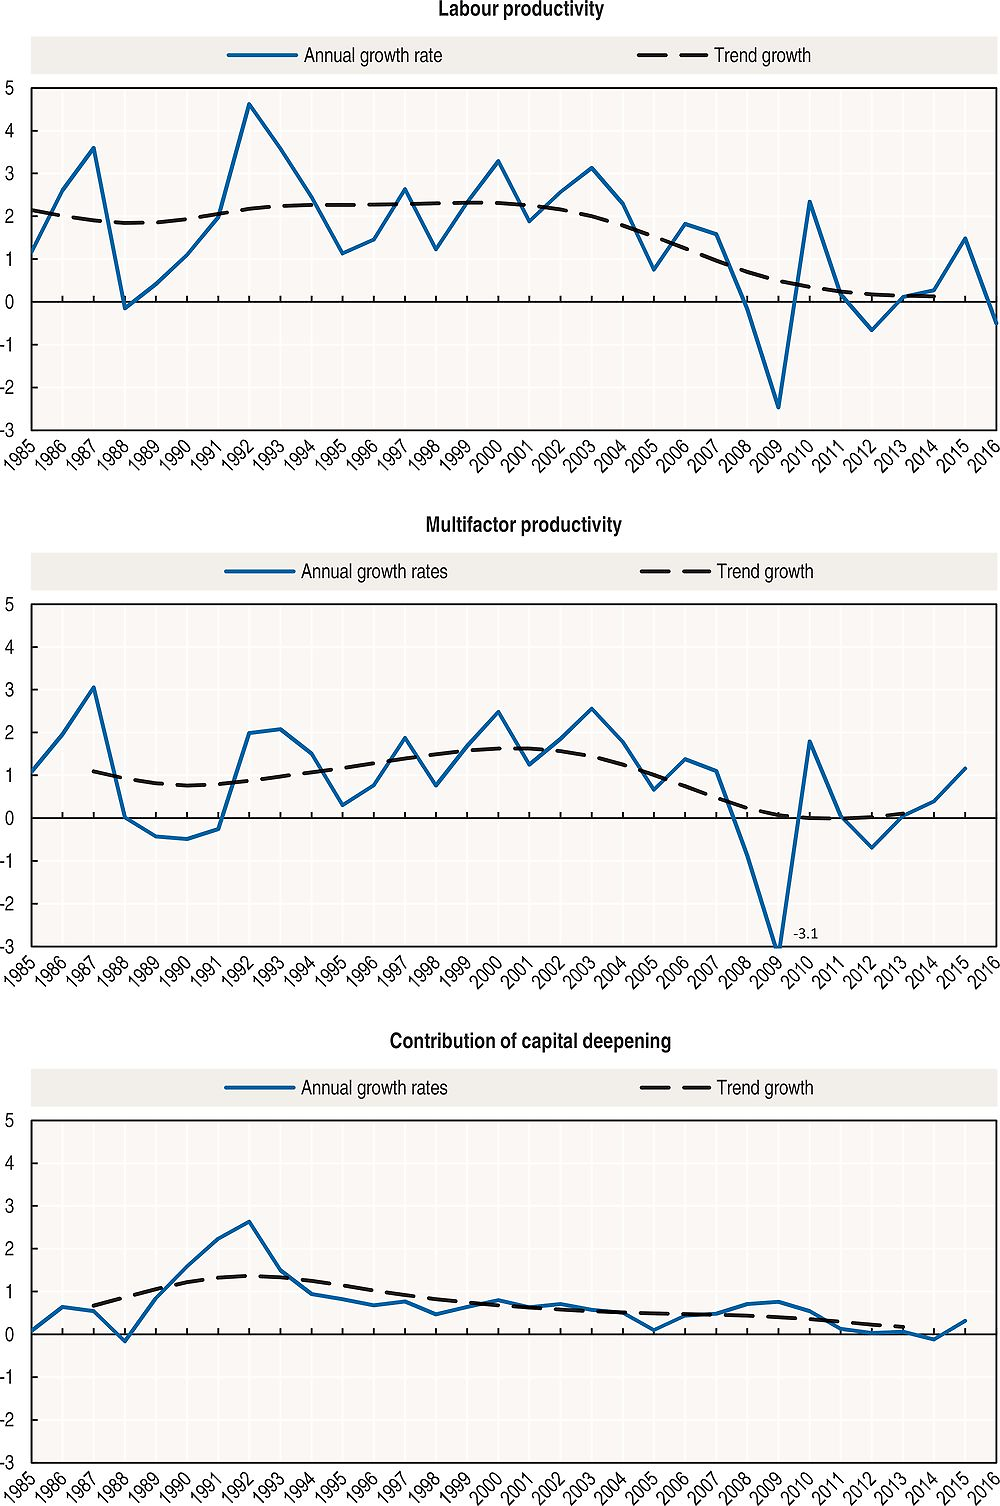
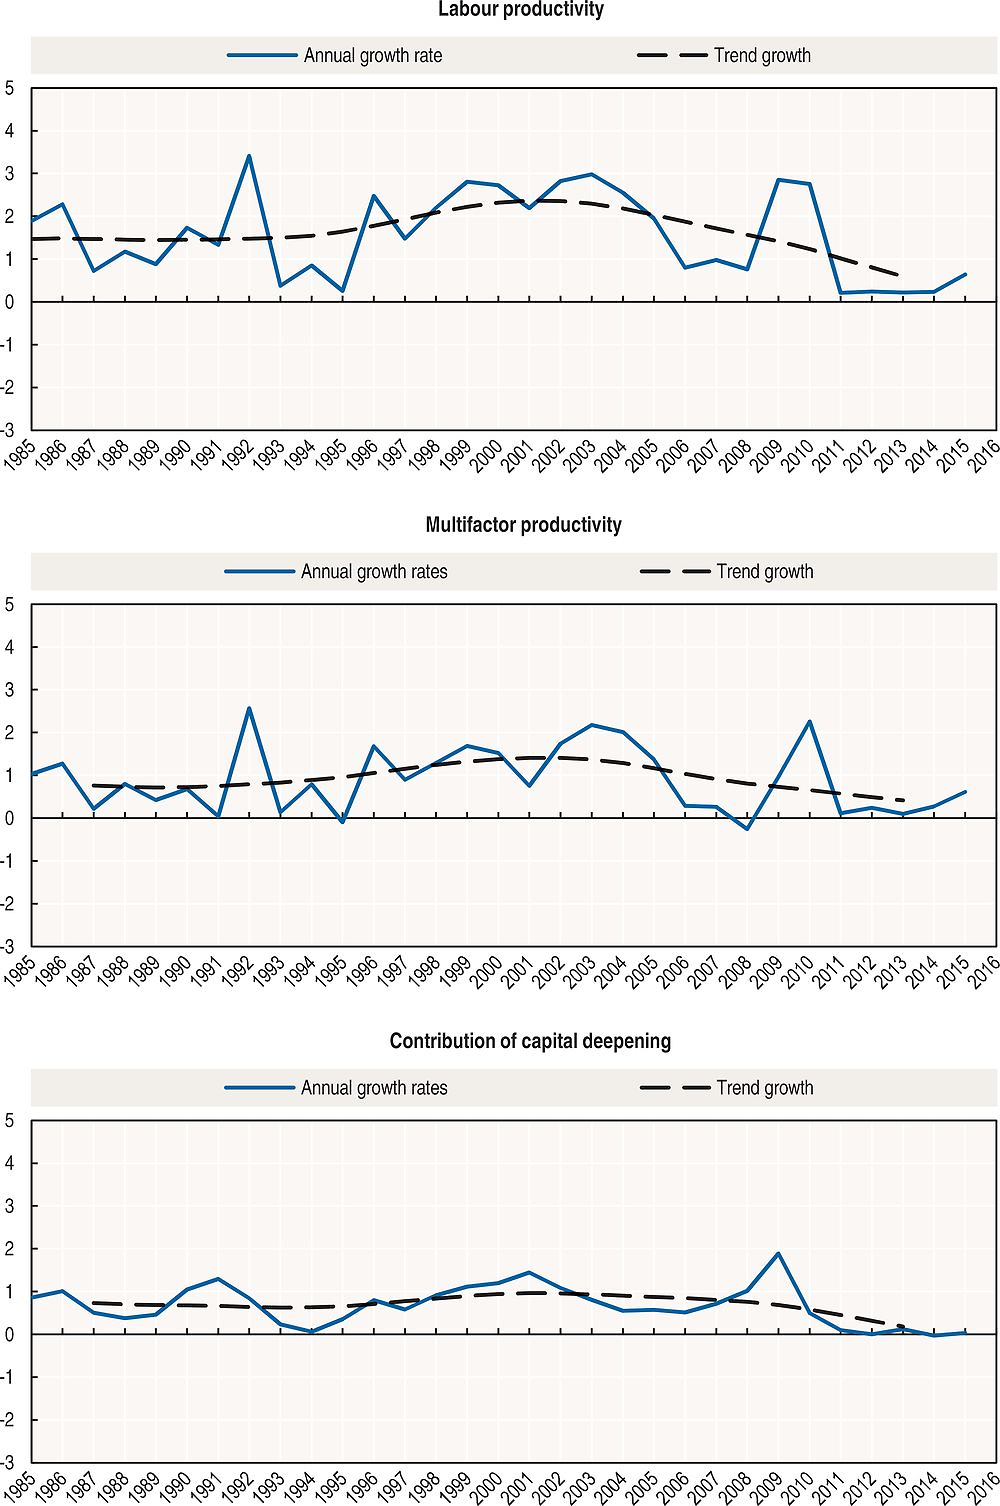
Policy makers are interested in the structural factors that may have accentuated the recent slowdown in labour productivity growth. The declining trend labour productivity growth may be driven by declining investment in capital relative to hours worked (capital deepening) or could be indicative of factors that hampered growth in multifactor productivity (MFP), such as low innovative activity, skills mismatches and inefficiencies due to barriers to competition. To shed light on these structural factors, one can decompose the time series of labour productivity growth as well as its drivers, i.e. the contribution of capital deepening and MFP, into a trend and a cyclical component.
While nearly all G7 countries show a decline in trend labour productivity growth since the end-1990s or before in some cases, the sources for this decline vary. In Canada, the downward trend of MFP growth contrasted with the flat trend observed in the contribution of capital deepening. In Germany, trend MFP growth has declined continuously since the beginning of the 1990s and flattened after the crisis. In Italy, trend MFP has been negative since the early 2000s and has been coupled in recent years with a declining contribution of capital deepening. Japan saw a drastic decline in trend MFP growth over the second half of the 1980s and the 1990s and has seen a flat trend since then, coupled with a downward trend in the contribution of capital deepening. In France, the United Kingdom and the United States, the downward trend of labour productivity growth since the early 2000s was driven by a slowdown in MFP growth in France, a sharp decline in MFP growth in the United Kingdom and by a combination of declining MFP growth and capital deepening in the United States.
Definition
Labour productivity is defined as GDP per hour worked and its growth rate is calculated as its first natural-log difference. The contribution of capital deepening is constructed as changes in the volume of capital services per hour worked (i.e. capital deepening) weighted by the cost share of the capital input. Growth in multifactor productivity is measured as a residual, i.e. that part of GDP growth that cannot be explained by growth in labour and capital inputs. The decomposition of these series into a trend and a cyclical component is done by applying the Hodrick-Prescott (HP) filter (Hodrick and Prescott, 1997), where the trend component is meant to capture the long-term growth of the series and the cyclical component is the deviation from that trend (Chapter 6).
Comparability
To ensure cross-country comparability of capital services and MFP data, the OECD applies a common computation method to all countries that uses harmonised ICT investment deflators and assumes the same average service lives for any given asset irrespective of the country.
MFP growth is the residual part of GDP growth that cannot be explained by growth in either labour or capital input. Conceptually, it can be seen as technological change. In practice, some part of technological change, including improvements in the design and quality of new vintages of capital, is embodied in physical, notably, ICT capital. Then, MFP only picks up disembodied technical change, e.g. network effects or spillovers from production factors, the effects of better management practices, brand names, organisational change and general knowledge. Moreover, linked to the assumptions of the production function and data constraints hampering a precise measurement of labour and capital inputs, MFP also captures other factors, e.g. adjustment costs, economies of scale, effects from imperfect competition and measurement errors.
Official data for Germany after unification are available only from 1991 onwards. Estimates for Germany as a whole back to 1970 have been derived by applying the relevant growth rates for West Germany to 1991 data.
Sources and further reading
Hodrick, R. and E. Prescott (1997), “Postwar U.S. business cycles: An empirical investigation”, Journal of Money, Credit and Banking, Vol. 29, No. 1.
OECD Productivity Statistics (database), https://doi.org/10.1787/pdtvy-data-en.
OECD (2001), Measuring Productivity – OECD Manual, https://doi.org/10.1787/9789264194519-en.
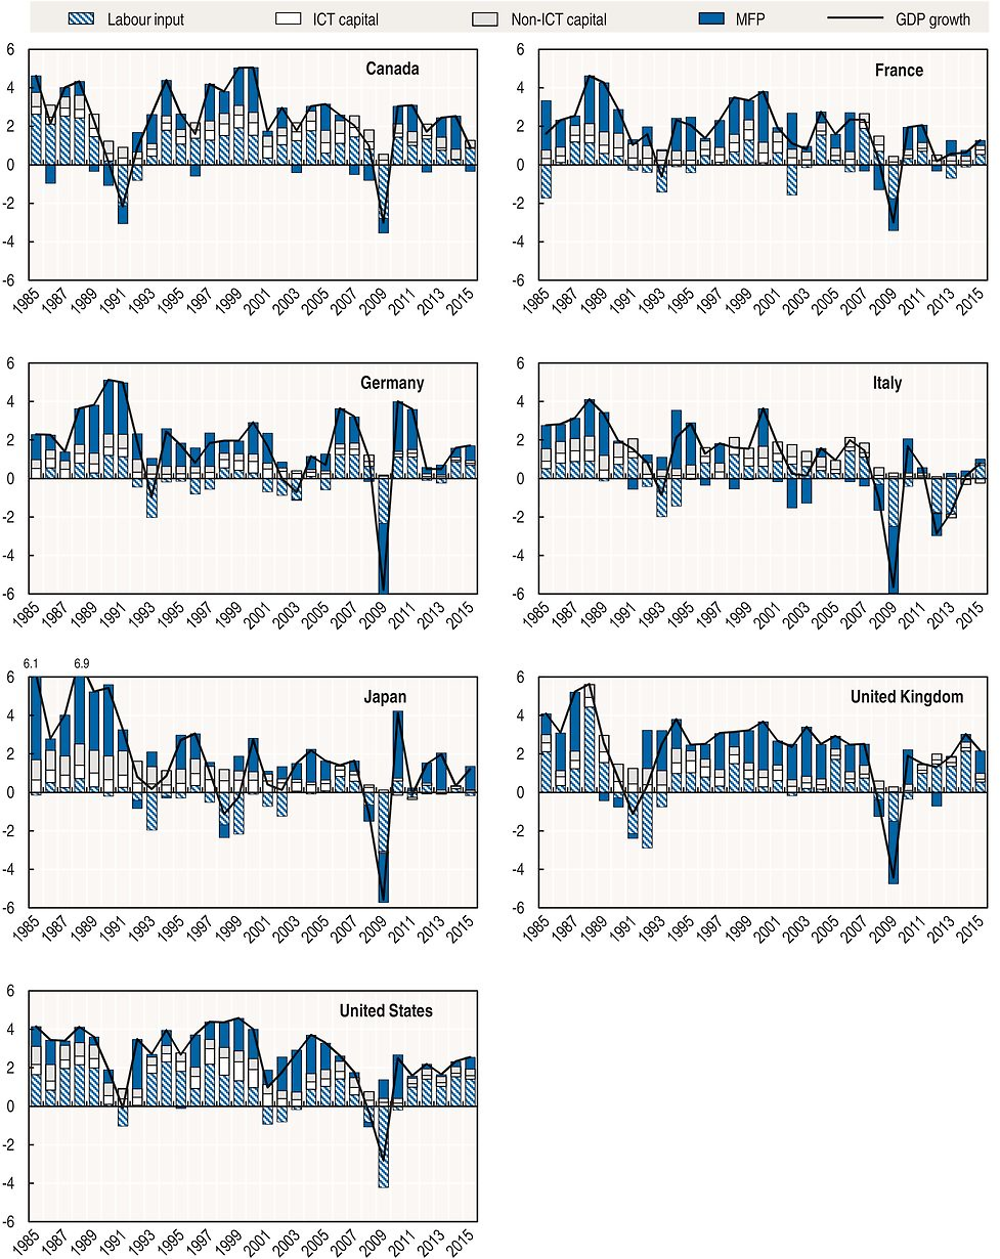
Multifactor productivity over the cycle
A number of studies indicate that multifactor productivity growth (MFP) behaves cyclically, i.e. it increases in upturns and declines in downturns. This has sometimes been interpreted as a paradox, as MFP has traditionally been perceived as exogenous technological change, which should typically not behave cyclically.
The empirical evidence confirms the cyclical pattern of MFP. In fact, MFP follows GDP growth very closely, not only in terms of the direction but also in terms of the size of the change. While the contribution of labour fluctuated relatively strongly for most G7 countries, up to 2007, adjustments in labour input typically lagged. The contribution of capital input changed little over the cycle, possibly reflecting adjustment costs. Capital input reflects the accumulation of past investment of all firms in the economy. Hence, although investment is typically relatively volatile, capital stock and capital services estimates are less so. However, the contribution of capital input to GDP growth declined significantly after the crisis, possibly reflecting the sluggish recovery of investment.
Definitions
Four factors help explain this cyclical movement and each of them is related to the definition of MFP as the part of GDP growth that cannot be explained by changes in labour and capital inputs (Chapter 6). First, cycles in productivity growth may relate to imperfect competition and the potential to capitalise on increasing returns to scale during upturns. Second, labour input typically adjusts with a lag in downturns, as firms seek to retain workers even if not needed for current production so as to keep the human capital (labour hoarding). Third, adjustment costs prevent an immediate up- or downsizing of production and capital, resulting in lower utilisation of existing capital stock in downturns. Fourth, the reallocation of resources to production of goods and services with higher or lower marginal productivities may be pro or counter cyclical.
Comparability
The appropriate measure of capital input for productivity analysis and within the growth accounting framework is capital services (Chapter 6). While these take into account the productivity of the different capital assets, no account is taken of the extent to which the existing capital stock is actually used, i.e. the rate of capital utilisation, which may affect comparability over time and space.
Theoretically, measuring labour input by the total actual hours worked of persons employed should capture the rate of labour utilisation and hence account for the cyclical effects of labour input. Continuous labour force surveys provide a basis for measuring this. However, in practice, total hours worked are often measured based on hours typically worked or actual hours worked during a reference week, which are then extrapolated over the year using additional data sources. These may not capture sufficiently variations in actual hours worked over the cycle (Chapter 6).
Official data for Germany after unification are available only from 1991 onwards. Estimates for Germany as a whole back to 1970 have been derived by applying the relevant growth rates for West Germany to 1991 data.
Sources and further reading
OECD Productivity Statistics (database), https://doi.org/10.1787/pdtvy-data-en.
OECD (2001), Measuring Productivity – OECD Manual, https://doi.org/10.1787/9789264194519-en.
OECD (2009), Measuring Capital – OECD Manual, https://doi.org/10.1787/9789264068476-en.
Wölfl, A. and D. Hajkova (2007), “Measuring Multifactor Productivity Growth”, OECD STI Working Papers 2007/05, https://doi.org/10.1787/246367010342.