Chapter 3. A portrait of family migration in OECD countries1
This chapter presents key trends and issues in family migration to OECD countries, drawing on a wide range of data sources, and highlighting current and emerging challenges for the management of family migration. Family is the single largest category of migration. Family migration accounts for almost 40% of flows and a quarter to half of the stock of migrants, even if their share of total migration flows has declined in recent years. Family migration comprises different components, of which family formation is an increasing part. The recent evolution of policies to manage their admission is discussed, underlining how family migration is allowed everywhere but regulated, especially for non-national sponsors, and restrictions apply to non-dependent non-direct family. The chapter describes the demographic characteristics, education, language abilities and labour market integration of family migrants in comparison to other migrant categories.
Introduction
Migrants who move primarily for family reasons constitute the largest group in migration inflows to the OECD area and, in some countries, represent as much as three-quarters of yearly inflows. However, they form a heterogeneous group, which includes among others people accompanying migrant workers or refugees, people reuniting with family members who have migrated previously or people forming new family units with nationals of the destination countries. Family migrants also have diverse types of family links with their counterparts in the destination country, as spouses, children, parents or siblings.
Despite its relative importance, little is known about the recent dynamics of family migration and about the impact of migration policies in shaping it. Evidence is also particularly scarce regarding the socio-demographic characteristics of family migrants; for some countries, such as the United States, the most recent surveys date from the 2000s. This chapter addresses this information deficit by offering, for the first time, a comprehensive portrait of family migrants in OECD countries. It answers the following questions: How many are they? Who are they? How are they faring in the labour market of the destination country? What are the most recent trends and key upcoming policy challenges associated with family migration?
The first section examines the evolution of family migration flows to OECD countries over time and explores which family members make up these flows. In the following section, policies on family migration are discussed and the trade-offs highlighted. The third section turns to the stocks of family migrants in OECD countries and provides more detailed information on their characteristics, their staying behaviour, and their labour market integration. The last section considers current and emerging challenges in family migration policy.
Main findings
-
Family migration has been the main channel of migration to the OECD area in recent years. More than 1.6 million family migrants received a residence permit in the OECD area in 2015, representing almost 40% of the total permanent migration inflow. In addition, in Europe, about 30% of intra-European movements are estimated to be associated with family reasons – around 400 000 people in 2015 alone.
-
Family migrants typically account for a quarter to a half of the migrant population residing in OECD countries in 2014.
-
The United States accounted for close to half of all family migrants (46%) moving to the OECD area in 2015. However, family migration flows to the United States declined in recent years, driving the overall decline in these flows to the OECD area. Settlement countries (United States, Canada, Australia and New Zealand) account for about two-thirds of the family migration inflows to the OECD.
-
Children under 15 years of age accounted for more than one-quarter of all family migrants moving to the OECD in 2015, exceeding a total of 400 000, or almost 10%, of all permanent migrants, and a fourth of all family migrants. At least 130 000 of these children in 2015 were under four years.
-
Family migrants differ in age, categories of entry and a wide range of other characteristics. There are many young adults and children as well as older persons, spouses and partners as well as grandchildren and grandparents.
-
Family migrants have different education levels, with large variations by migration subcategory. Over recent years, education levels of family migrants have tended to improve overall. The increase in the share with a high education level and decrease in the share with a low education level has also been greater than for the native-born.
-
Among the various types of family migrants across OECD countries, women are almost always the majority but they rarely comprise more than 60% of the total.
-
Compared to other groups of migrants, adult family migrants integrate slowly in the labour market of the host country. In Europe, based on historical evidence, they only reach average employment levels similar to those of other migration categories and natives after more than 20 years.
-
Family migration is firmly linked to labour migration. Where accompanying migrants are allowed, about one enters for every principal economic migrant. Flows of accompanying family migrants directly depend on labour or economic class migration flows and therefore on economic migration policies.
-
Family reunification occurs after a time lag compared to economic migration categories, but also responds to policies regarding conditions, processing times, and rules for other migration channels. In some southern European countries for example, where labour migration declined sharply after the 2007/08 economic crisis, family reunification is only now also shrinking.
-
Family formation is an increasingly important driver of family migration. In many OECD countries, more than 10% of all marriages occur between a citizen and a foreigner, usually leading to a residence permit on the grounds of family. In some OECD countries, this has become the main reason for family migration.
-
While family migration provisions are in place in all OECD countries, family migration is not an entirely non-discretionary migration category, since there are regulations that govern the numbers, characteristics and conditions. Categories such as spouses and children of citizens are generally least restricted, while more conditions apply to family members of foreign residents, and those of temporary migrants are often not eligible for admission.
-
Over the past decades, family migrants have benefited from an expansion of rights accompanied by increasing conditions being imposed on eligibility and on the residence permits. Family migration of spouses and children of foreigners is subject to income or housing requirements in most OECD countries. Such restrictions are less common for citizens’ spouses and children, but are in place in some countries. Language and integration requirements have also been added by a number of OECD countries in the past decade, though with little evidence of an effect on employment outcomes.
-
At the same time, due to competition for highly skilled migrants, the rules for family members of highly skilled labour migrants have begun to include exemptions from stricter rules and constraints that apply to other categories of foreign sponsors.
-
In light of the magnitude of family migration and its implications, a number of key challenges for current policies on family migration can be identified. One is how to better anticipate the levels of family migration flows. Another is how to balance rules for family migration against the need for countries to remain attractive to targeted labour migrants. A further issue is how to use conditions for family migrants to accelerate their integration. Finally, there is a growing concern about how to deal with unaccompanied minors.
-
No country contemplates a total restriction on family migration, but most are struggling to balance the different objectives associated with regulation of family migration.
An analysis of family migration flows
Migration flows are typically decomposed into main categories of entry (labour, family, humanitarian, free movement,2 study, others) that correspond broadly to the main types of permits issued in OECD countries. The “family” category encompasses four main subcategories: family formation, accompanying family, family reunification and international adoption. Table 3.1 provides commonly used definitions for these subcategories of family migration. These subcategory groups are based on structural similarities of migration events, such as the specific reason for migration (e.g. to form a couple or family with a recently married partner vs. continuing a couple or family that had already been together in another country) and the timing of migration compared to the migration of a principal migrant (accompanying the principal migrant vs. later reunifying with the principal migrant).
This section looks at recent trends regarding total family migration flows in an international comparison and in relation to overall migration. It then analyses the composition of these flows by subcategory of family migration and by main characteristics of family migrants.
Family migration accounts for the largest part of total migration to OECD countries
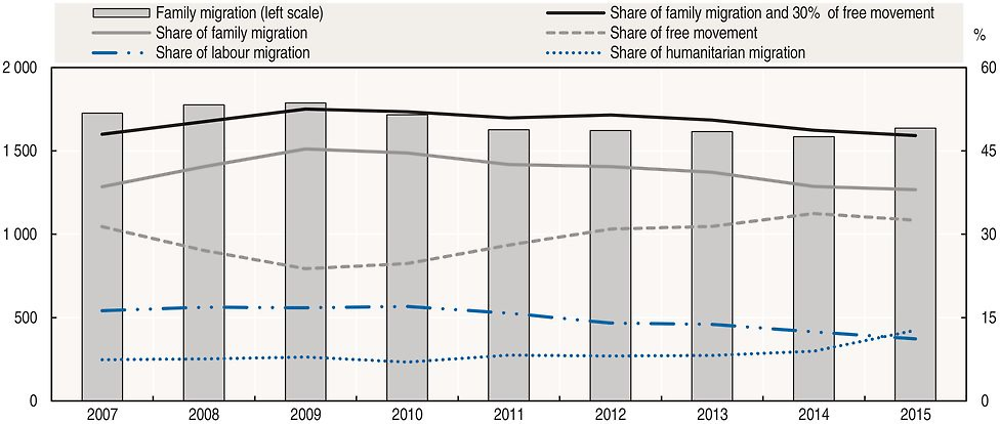
Family migration is the main channel of migration to OECD countries. In 2015, more than 1.6 million migrants moved to OECD countries on the basis of residence permits for family migrants (Figure 3.1). This number was close to 1.8 million in 2008/09 but declined slightly until 2014.
Note: All figures for family migrants include accompanying family of workers.
Source: OECD International Migration Database, https://doi.org/10.1787/data-00342-en.
In 2015, family migrants accounted for 38% of all permanent migrants to OECD countries. In recent years, this share has generally exceeded 40% and approached half of the total permanent migration inflow in 2009. Family migrants have been the largest share of permanent migration, well ahead of labour migrants and humanitarian migrants who accounted for 11% and 12% of the total permanent migration inflow in 2015, respectively. Migration within free movement areas, notably within the European Union (EU) and European Free Trade Association countries (EFTA), was the second largest immigration category in 2015, but this may include many migrants who moved for family reasons and are not counted as such because they do not formally hold a residence permit under this category.
The European Labour Force Survey (Eurostat) ad-hoc module 2014 indicates that about 30% of the EU citizens who have settled in another EU country within the preceding five years self-declared “family” as the main reason for migration (see Box 3.6 for details). It suggests that about 400 000 persons who exercised free movement in 2015 can be considered as family migrants. Adding this group to family migrants suggests that the share of family migrants may approach 50% of total migration inflows to OECD countries (Figure 3.1).
As this example shows, family migrants may be defined in at least two ways: as persons who possess a residence permit for family migrants and as persons who migrate for family reasons. The rest of this chapter defines family migrants based on their residence permit whenever data on migration flows is used (Box 3.1), but has to use the definition based on self-declarations whenever stock data is used (Box 3.5).
The figures on family migration flows in this chapter still underestimate total flows of family migrants as they refer only to permanent migration. Indeed some categories of temporary migrants, notably intra company transferees and other selected categories of highly skilled temporary migrant workers, are entitled in most countries to bring their spouse and children with them. Rough estimates suggest that at least 200 000 persons annually are entitled to bring their family members to OECD countries under these categories.
This chapter draws on a number of data sets to characterise and analyse the annual flows of family migrants, also in comparison to flows of other migrants and as a share of total migration flows. In addition to national data sources, two datasets are used to analyse family migration flows.
OECD International Migration Database (IMD)
The International Migration Database standardises data on the legal migration inflows that countries record on a yearly basis. The database covers most OECD member countries. Standardised data are not available for Hungary, Greece, Iceland, Israel, Latvia, Poland, the Slovak Republic, Slovenia and Turkey. For most countries, yearly data are available from about 2000 up to 2015, but for some countries the series is limited to a few recent years.
In addition to total annual inflows, the International Migration Database provides inflows by category of migration. Based on types of residence permits, flows of family migrants are recorded under two categories, “family migrants” and “accompanying family of workers”. However, the latter category is separately reported only for a few countries. While the database provides counts for both temporary and permanent migration flows, only the counts for permanent migration flows are used in this chapter.
Eurostat Residence Permit Data Collection (EU Resper)
Eurostat assembles a data collection on residence permits (“Resper”) by drawing on national sources in member countries of the European Free Trade Association (EFTA), which comprises EU member countries and Iceland, Liechtenstein, Norway and Switzerland. As citizens of the EFTA countries do not need residence permits to stay in another EFTA country, the data on residence permits only cover third-country nationals, i.e. citizens of non-EFTA countries. From 2008, yearly information is available on the number of first residence permits issued in each country and on the total number of residence permits that were valid on 31 December. These data also provide information on some key variables such as migration category (family/remunerated activities/education/other), sex, age, and citizenship of the third-country national who received the residence permit, as well as the length of the permit’s validity.
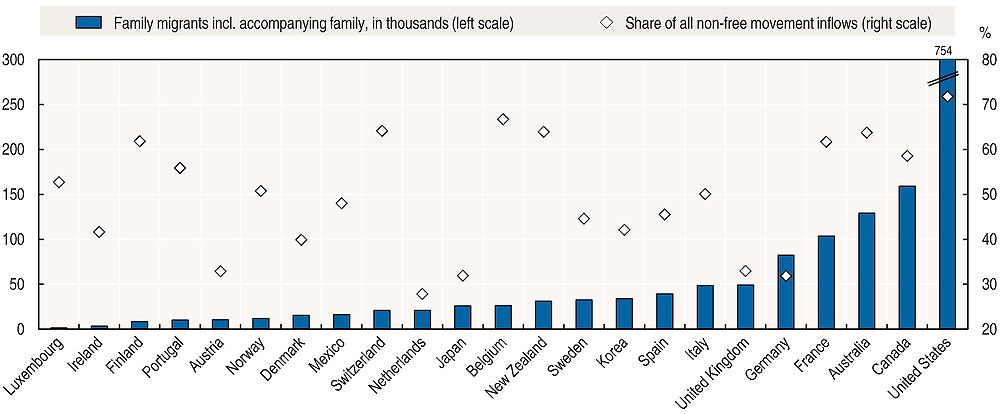
The finding that family migrants account for the largest migration inflows to the OECD area is driven by particularly high numbers of family migrants in several large OECD countries (Figure 3.2). Settlement countries (United States, Canada, Australia and New Zealand) account for about two-thirds of the family migration inflows to the OECD. The 754 000 family migrants who moved to the United States – including accompanying family – accounted for close to half of the family migration inflows to the OECD area in 2015. In the same year, 159 000 family migrants moved to Canada and 129 000 to Australia.
Note: Only permanent migration inflows are included.
Source: OECD International Migration Database, https://doi.org/10.1787/data-00342-en.
A second group of key destination countries for family migrants consists of the most populous European OECD countries: France, Germany, Italy and the United Kingdom. With more than 104 000 family migrants in 2015, similar to the previous year, France recorded the fourth-highest inflows of family migrants among OECD countries. Germany, with 82 000, saw a significant increase compared with 2014 (64 000). About 50 000 moved to each of the United Kingdom and Italy, down from about 60 000 in 2014.
Across OECD countries, the highest share of family migrants was observed in the United States (72%). While the corresponding share in France was also comparatively high (62%), the share in Germany (32%) was the second lowest observed in the OECD after the Netherlands (28%). In Korea, family flows accounted for 42% of inflow. In Mexico, a relatively low number of family migrants nevertheless accounted for almost half of the country’s permanent migration inflows.
In many OECD countries, family migration has become less prevalent over recent years
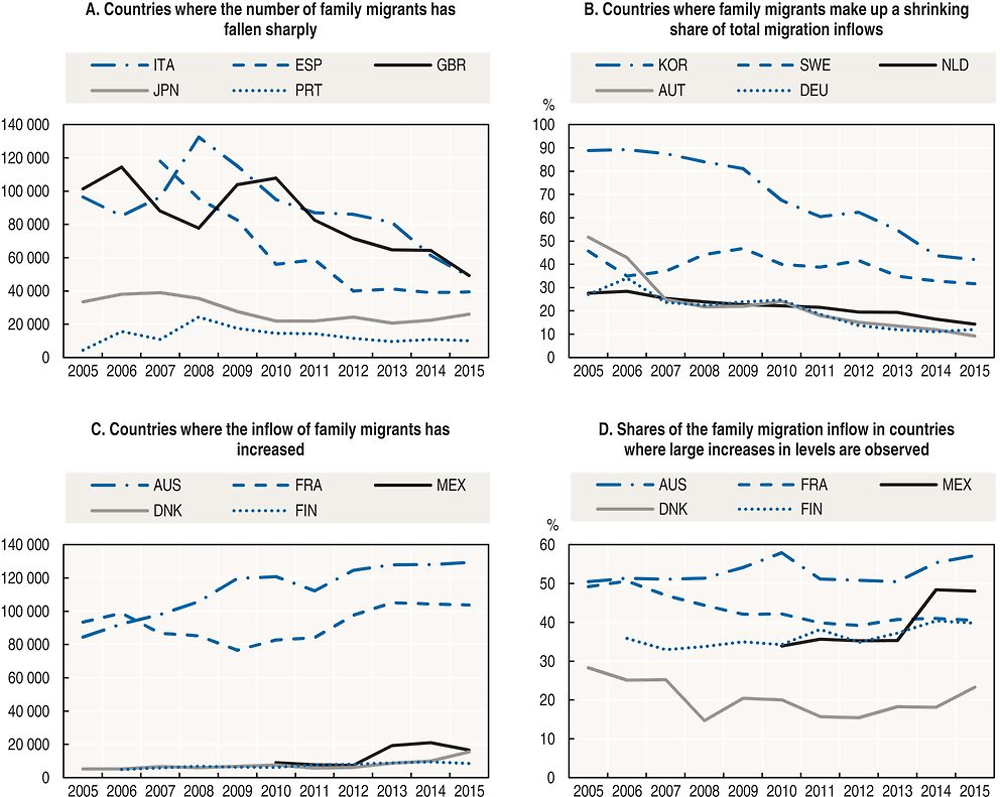
Family migration in general follows overall migration trends, with some exceptions. The reduction in yearly inflows of family migrants between 2008 and 2014 is visible in both the United States (-10%) and European OECD countries (-20%). Within Europe, large decreases of family migration inflows took place especially in the southern European OECD countries of Italy, Spain and Portugal: in all three countries, family migration inflows fell by more than half between 2008 and 2015 (Figure 3.3, Panel A). This happened in the context of an overall decline of migration to these countries as a result of the 2008 global financial and economic crisis. The same observation holds to some extent for the United Kingdom, where total migration fell sharply between 2010 and 2013 before rebounding in 2014 and 2015. On the contrary, family migration rose in France from 85 000 in 2008 to 104 000 in 2015 (Figure 3.3, Panel C). Rapid growth of family migration was also observed in Denmark and Finland.
Note: Values before 2010 are not available for Mexico, and the value in 2005 is not available for Finland. All flows include accompanying family of labour migrants.
Source: OECD International Migration Database, https://doi.org/10.1787/data-00342-en.
Decreasing shares of family migration were observed in Sweden, the Netherlands, Austria and Germany (Figure 3.3, Panel B). As absolute levels of family migration inflows were stable or even slightly increasing in these countries, the falling shares of family migration resulted from growth in other channels of migration over this period, primarily free movement.
Outside Europe, the fall is particularly striking in absolute terms in Japan where the number of family migrants halved between 2007 and 2013 in the context of declining overall migration. In Korea, the inflow of family migrants was relatively stable during that period but its share of total permanent migration fell sharply due to an increase in the number of ethnic Koreans acquiring permanent-type residence. By contrast, the inflows of family migrants to Canada fluctuated between about 150 000 and 170 000 over this period and those to Australia exhibited a clearly rising trend both in absolute and in relative terms (129 000 in 2015, +22% since 2008). 3
Accompanying family of labour migrants make up a large but highly volatile category of entry
Little information is available on the detailed components of family migration inflows, such as the subcategories defined in Table 3.1. Data are however available for eleven OECD countries4 on accompanying family of labour migrants, in many of them a significant but volatile share of total and family migration (Figure 3.4).
Note: Values for 2005 are not available for Ireland.
Source: OECD International Migration Database, https://doi.org/10.1787/data-00342-en.
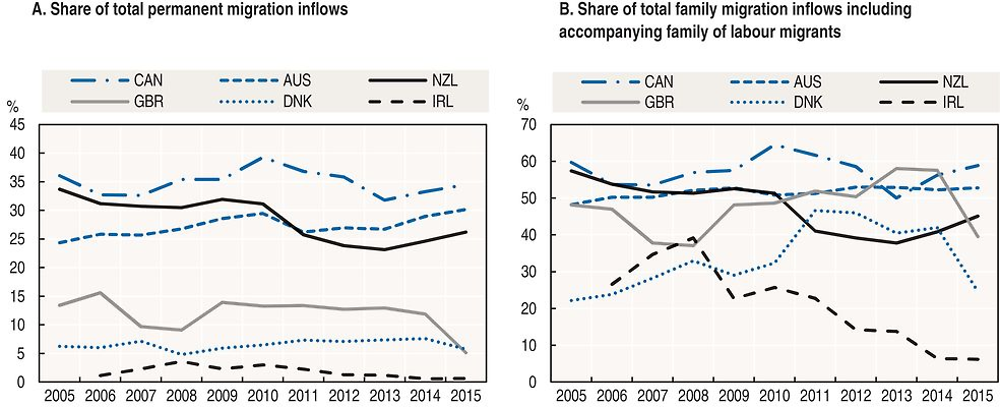
Accompanying family of labour migrants came to dominate family migration inflows to the United Kingdom in 2014 to an extent otherwise only observed in Canada and Australia, where they respectively accounted for 58 and 53% of total family migration flows (Figure 3.4, Panel B). Throughout recent years, the share in Australia rose only slightly and that in Canada fluctuated between 50 and 65%. In New Zealand, the share of accompanying family of labour migrants in family migration has been declining progressively and was by 2015 somewhat lower (45%) than in the past. In Denmark and Ireland, accompanying family of labour migrants has in the past accounted for high shares of the family migration inflow but recently fell considerably.
In contrast to the significant changes observed for the countries shown in Figure 3.4, comparatively low and stable shares have been observed for accompanying family of labour migrants in Austria, Italy, Korea, Sweden and the United States. In these countries, accompanying family of labour migrants represented less than 10% of the permanent migration inflow in every year from 2005 to 2015, and at most 17% of the family migration inflow. In the absence of shifts within migration inflows, these shares can be expected to be roughly stable over time: the inflow of accompanying family of labour migrants is closely linked to the labour migration inflow, so that they often evolve in the same direction, with a corresponding effect on the total permanent migration inflow.
The close association between inflows of labour migrants and inflows of accompanying family could be observed in the setting of a natural experiment in the United States. After authorities had granted unusually few visas for labour migrants in 2003, the remaining places from several previous years were “recaptured” in 2005 (Jefferys and Rytina, 2006). This led to a sharp rise in visas for labour migrants between 2003 and 2005, as shown in Panel A of Figure 3.5. The number of visas for accompanying family followed this evolution very closely – not only the inflow of accompanying family as a whole but also within the specific skill categories of labour migrants (Figure 3.5, Panel B). Across skill categories, the number of accompanying family increased very much in line with the increase in labour migration, so that the composition by skill class barely changed despite the strong increase in overall numbers. If this is in a way stating the obvious as labour migration and accompanying family of workers are linked by definition, evidence shows that family migration more broadly defined is related to labour migration (see Box 3.2).
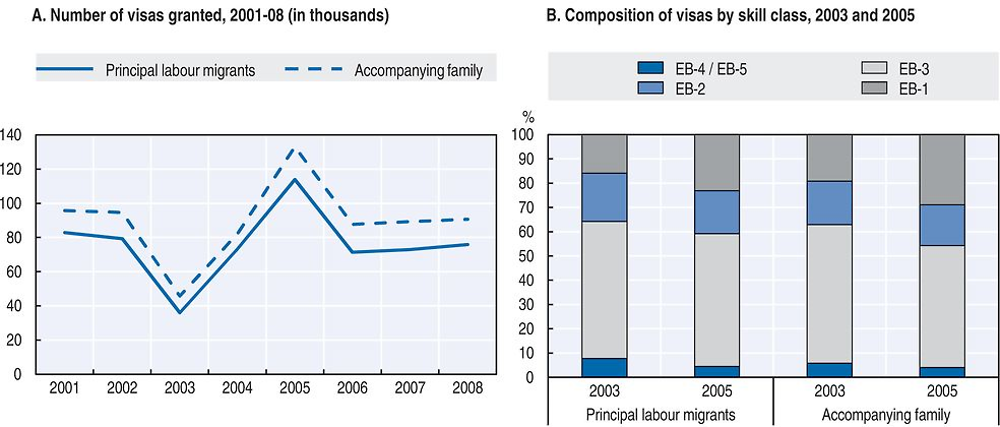
Note: EB-1, EB-2, EB-3 and EB-4/EB-5 refer to different skill categories within the class of labour migration, and accompanying family are counted towards the respective class of the principal labour migrant.
Source: National sources.
To further investigate the linkages between labour migration and family migration more broadly defined, Table 3.2 shows countries where inflows of labour migrants have been strongly correlated with inflows of family migrants in the years 2000-15. Where data specifically on accompanying family of labour migrants are available, Table 3.2 distinguishes this part from the remainder of the family migration inflow, and the correlations between each of these parts and labour migration inflows are considered. Given the limited number of observed years, spurious correlations might easily arise. While the results can therefore only serve as indications, roughly the same results are obtained after including earlier years where possible.
According to the results in Table 3.2, inflows of accompanying family of labour migrants strongly correlate with inflows of labour migrants in Australia, Austria, Denmark, Sweden and the United States. Weaker but still high correlations are observed in Canada, Italy and New Zealand. As might be expected a priori, inflows of labour migrants and inflows of accompanying family of labour migrants thus appear to have been linked in a number of OECD countries over the years 2000-15, but not in all: the correlations do not appear particularly high in Ireland, Korea and the United Kingdom.
Inflows of labour migrants also appear to be linked with total family migration inflows, including accompanying family of labour migrants (Table 3.2). Strong correlations over the years 2000-15 arose in Australia, New Zealand and Portugal, while milder correlations arose in Canada, Italy, Japan and Norway. This suggests that family migration inflows to these countries are partly driven by labour migration inflows. At least in some countries, the link likely passes through the inflow of accompanying family of labour migrants, since the inflow of family migrants without accompanying family of labour migrants rarely reaches a high correlation with labour migration inflows (only in Australia and Italy). In most OECD countries shown in Table 3.2, however, correlations between the labour migration and family migration inflows are not particularly high, so that family migration inflows more often appear to evolve independently of labour migration inflows.
Further analyses using the same approach cannot discern a lagged effect from labour migration on family migration, which suggests that inflows of labour migrants do not drive the inflows of family migrants one or two years later. Inflows of refugees appear entirely unrelated to the reported categories of family migration inflows in OECD countries, with two notable exceptions: in Denmark and the United States, the inflows of refugees over the years 2000-15 strongly correlate with the inflows of family migrants both with and without accompanying family of labour migrants.
In some OECD countries, family migration inflows are correlated with inflows of international students over the years 2000-15. In Denmark and Norway, mild correlations are observed between inflows of international students and inflows of family migrants with and without accompanying family of labour migrants. Overall, such links between different migration inflows underline that family migration inflows are not as independent as is often thought.
Family formation makes up an increasing part of family migration in several OECD countries
Family formation, usually the marriage of a resident (native-born or foreign-born, citizen or foreigner) with a foreigner (resident or non-resident) is an important driver of family migration. These marriages have a direct implication for the residence status of the foreign spouse, since marriage confers on the citizen the ability to sponsor the spouse for a family permit.5
Specific permit data on family formation are unfortunately available only in a handful of OECD countries. In France, spouses of citizens make up almost half of total family migration (48%). In Germany this percentage reaches 28%, compared to just 9% in the United States (plus 22% for children of US citizens, some of whom are children of foreign spouses). In Japan spouses and children of Japanese citizens also exceed a quarter (28%) of total family migration.
Figure 3.6 shows the share of marriages between a citizen and non-citizen – “mixed marriages” – in selected OECD countries. These marriages are not necessarily international marriages per se (i.e. do not always induce new migration flows) but may reflect in some countries the importance of foreigners in the prime marriage-age resident population.
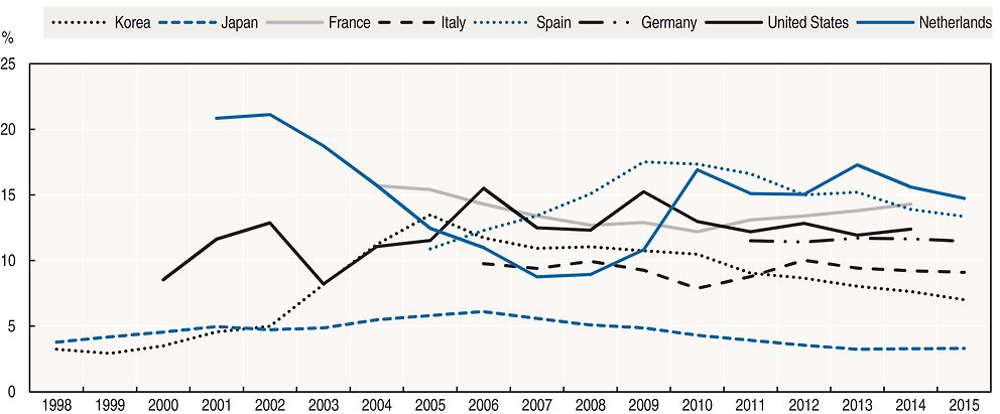
Note: Figures for France, Germany, Italy, Japan, Korea, and Spain refer to marriages between one citizen and one foreign spouse as a share of total marriages. In the Netherlands, it refers to the share of “Migration Marriages” between a prior resident and a foreign spouse who arrives at the time of marriage; the denominator includes marriages to resident foreigners. For the United States, it refers to the total number of Green Cards issued to spouses of citizens (Fiscal Year) is divided by the total number of marriages (Calendar Year).
Source: National statistical institutes; United States: Centers for Disease Control and Prevention, and Department of Homeland Security.
It is not surprising, for example, that as the younger unmarried foreign population increased in Spain in the 2000s, the share of mixed marriages would increase as well. The presence of long-standing immigrant communities may also drive mixed marriages; in the Netherlands, for example, most marriages involving foreigners are between foreigners and residents, often of migration background, and 15% of marriages in 2015 involved a spouse who arrived in the Netherlands for the purpose of family formation. It should be noted, however, that the total number of marriages in the Netherlands has been declining faster than the number of international marriages, so the share of the latter has increased.
The high share of mixed marriages in Korea and Japan, however, is not grounded in a large share of foreigners in the marriage-age population, but rather due to international marriages in which the spouse migrates for the purpose of marrying a national. In the case of Korea especially, these marriages are often brokered (Chaloff, 2012). The decline seen in Korea following 2005 is due to the introduction of an alternative visa for ethnic Korean Chinese nationals, which provided an alternative channel to marriage migration to this group. Indeed, the share of Chinese among such international marriages fell from 60% in 2003-05 to 30% in 2011-15. An overview of historical developments in marriage migration to Japan and Korea is provided by Chung et al. (2016).
Many OECD countries do not have central marriage registries, so only stock data are available for the country of birth and nationality of couples through census or survey data. In these cases, it is impossible to know whether the spouse was a foreigner at time of marriage. Nonetheless, a large share of couples is mixed. In the United States, in 2013, 15.3% of all married couples were a US citizen with a foreign or naturalised spouse, in line with the trend shown in Figure 3.6. For other countries, only country-of-birth information is available, but this indicates a high share of marriages involving foreign-born spouses. In Canada, in 2011, 11.2% of married couples were composed of one spouse born in Canada and the other born abroad. In Australia (2015), fully 32% of couples were composed of individuals born in different countries (either in Australia and another county, or two different countries abroad). Family formation is therefore an important driver of family migration. On the contrary, international adoptions make up a very small – and declining – part of family migration inflows to OECD countries (Box 3.3).
International adoptions make up a very small part of family migration inflows to OECD countries – in 2014, the number of international adoptions was below 500 in most OECD countries, according to national data compiled by Selman (2016). Exceptions were the United States (6 400 in 2014, 5 600 in 2015), Italy (2 200 in both 2014 and 2015), France, Canada and Spain (around 1 000 each). In Italy and Spain, international adoptions were thus equivalent to 4% and 2% of family migration inflows in 2014, respectively, but to less than 1% in Canada, France and the United States. The demographic contribution of international adoption may also be non-negligible in some countries: in Italy international adoptions were equivalent to 0.5% of total births in 2015. China, Russia and Ethiopia were the main origin countries in recent years as well as for the entire period 2004-14. In earlier decades and up to 2006, Korea had been a main origin country of international adoptions.
Numbers of international adoptions were particularly low in 2014: in all OECD countries for which data on international adoptions are available, the yearly number had begun to fall strongly at some point after 2001, as shown in Figure 3.7 for the main receiving countries of international adoptions. In Spain, international adoptions fell steadily from a peak of 5 500 in 2004 to 800 in 2015, and in Canada from 2 200 in 2003 to 900 in 2014; in France and Italy, numbers fell rapidly after 2010/11 (Figure 3.7, Panel A). The quantitatively largest fall occurred in the United States, from 23 000 in 2004 to 5 600 in 2015 (Figure 3.7, Panel B). Overall, the number of international adoptions in the five main receiving countries fell by 70% between 2004 and 2014.
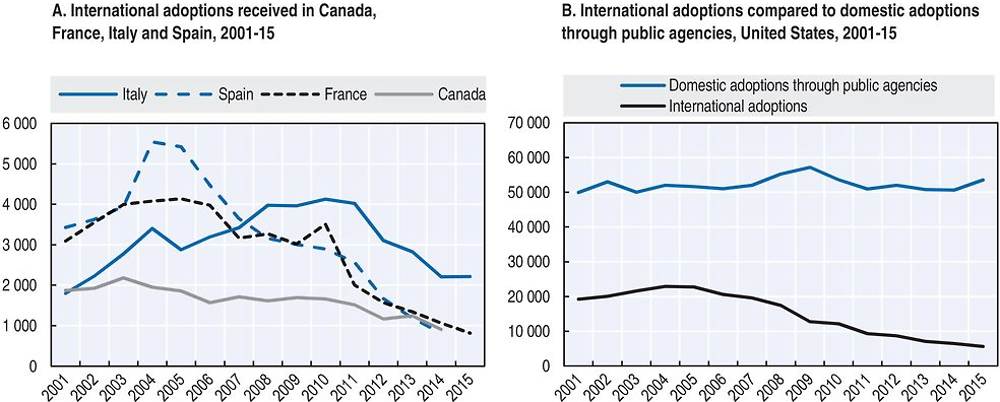
Note: Values for 2015 were not yet available for Canada and Spain.
Source: Selman, P. (2016), “Global Statistics for Intercountry Adoption: Receiving States and States of Origin 2004-15”, https://assets.hcch.net/docs/3bead31e-6234-44ae-9f4e-2352b190ca21.pdf (for 2004-2015); Selman (2009) (for 2001-03); AFCARS reports No. 10- No. 23, www.acf.hhs.gov/cb/research-data-technology/statistics-research/afcars (series for public agencies in the United States).
The rapid decreases in international adoptions often contrast with comparatively stable numbers of domestic adoptions, as for example adoptions from the public child welfare system in the United States (Figure 3.7, Panel B). The reasons for the decline in international adoptions can be found both in origin countries and in receiving countries. Several important origin countries such as China, Russia and Korea have relied more strongly on domestic adoptions. China introduced a number of conditions for adoptive parents in 2007, essentially requiring a heterosexual couple in a favourable socio-economic situation (Vandivere et al., 2009) which notably excluded single women as adoptive parents. In the case of Russia, one of the reasons behind the shift towards domestic adoptions were scandals that occurred in the context of international adoptions (Selman, 2009).
Concerns about international adoptions had been voiced in many countries. Against this background, the Hague Adoption Convention sought to establish standards and guidelines for international adoptions. According to this convention, priority is to be given to adoptions by members of the child’s extended family and to possibilities for domestic adoptions, deprioritising international adoptions. In practice, the Hague Adoption Convention has altogether stopped international adoptions from certain origin countries. For example, Guatemala had been a main origin country of international adoptions, which were almost exclusively directed to the United States (Selman, 2009). Implementing the Hague Adoption Convention, the United States suspended international adoptions from Guatemala because the system there did not comply with the Convention (Shuman and Flango, 2013). As origin countries, Guatemala and Viet Nam also halted international adoptions for this reason (Mignot, 2015).
In addition to the rapidly falling number of children available for adoption, some factors may have decreased the number of adoptive parents available. These factors include the increasing availability of fertility treatments as an alternative to adoption, as well as the economic crisis that might have made it more difficult to afford the costs involved in international adoptions (Shuman and Flango, 2013). The Department of Health and Human Services (2016) of the United States places the costs of international adoption in the range of USD 20 000 to USD 50 000, pointing out that often higher costs arise than for domestic adoptions, due to expenses related to travel and immigration.
Better understanding the socio-demographic composition of family migration flows
The migration flows labelled as family migration comprise a large variety of migrants: from newborns to the very aged, persons of every skill level and from any country of origin. This diversity distinguishes family migration from other migration channels: free movement and humanitarian migration involve migrants from a limited range of origin countries, while labour migrants and international students are drawn from certain age groups and skill profiles. At the same time, this makes family migration a complex phenomenon with a multitude of potential migration circumstances, addressed by a host of different rules and provisions in the family migration policies of OECD countries.
Family migrants: a flexible concept
If family migration goes well beyond the notion of nuclear family (i.e. spouse/partner and minor children), it is also largely grounded in it. This is due to the fact that the members of a nuclear family very often live in the same household, forming a core structure for which it is difficult, even painful to separate. Figure 3.8 depicts the different categories of family relations used in legislation regulating family migration. The relations to members of the nuclear family are typically considered a person’s closest family ties (direct relations), so that they receive highest priority in legislation on family migration.
The concentric circles in Figure 3.8 illustrate the notion of direct family relations. A person’s children are therefore the only descendants considered as direct family relations, and only a person’s parents are direct ascendants. By the same reasoning, siblings are not direct family relations because the connection to them arises only via common parents. Being neither ascendants nor descendants, a person’s siblings are placed in parallel at the same genealogic level. Since spouses are direct relations, the legal implication is that spouses of children may be treated the same way as directly related adult children, and spouses of siblings can be treated the same way as siblings.
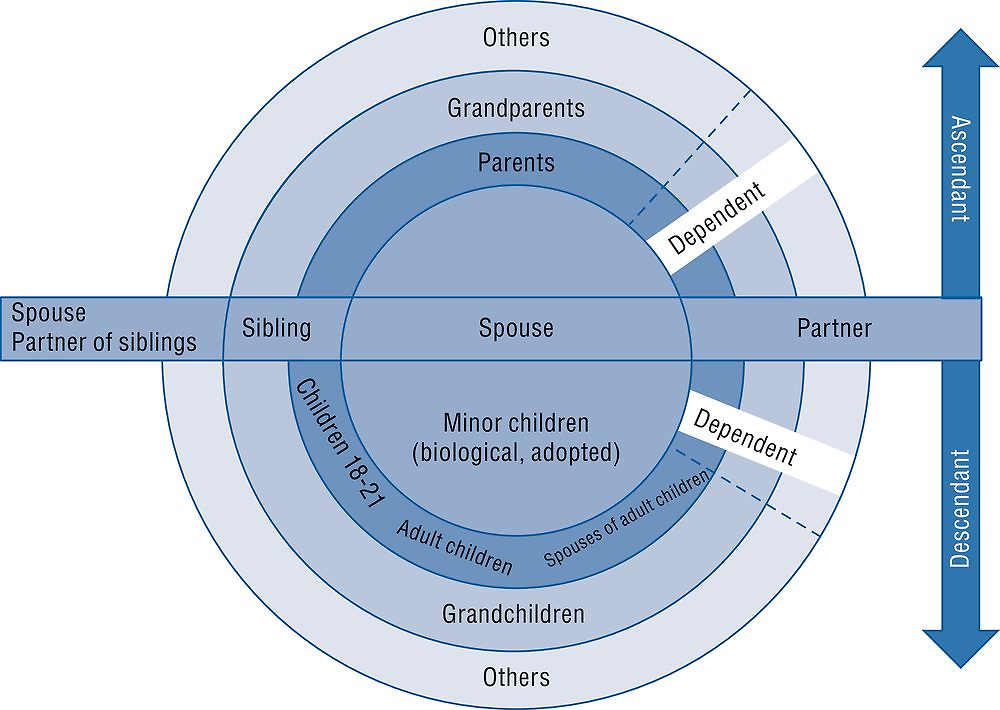
Note: Dependent means non-self-sufficient, disabled, no other support.
Source: OECD Secretariat.
Legislation often makes a distinction between a person’s dependent and non-dependent children. Minor children are considered dependent due to their age, while adult children are considered non-dependent unless they are disabled, cannot support themselves or otherwise depend de facto on their parents. Other relatives might also be legally recognised as de facto dependants. Notably parents or grandparents might become dependants due to advanced age, disability or poor health. In practice, dependence is usually correlated with belonging to the same household. Married children, for example, are not generally considered part of the nuclear family, as they represent their own separate household and would generally not be considered as potentially dependent.
However, the notions of nuclear family, direct relations and dependants are ultimately not clear-cut. A range of situations can arise as part of family life that may or may not lead to different treatment in family migration legislation. To mention only a few examples, if a person is not married to a partner but linked through some form of registered partnership or long-term marriage-like cohabitation, the partner may or may not be treated like a spouse. When partners are treated as a spouse, a minimum duration of the relationship may be required to demonstrate it. Whether or not the partner is a parent of common children can be legally relevant. Minor children of a spouse or partner in the case of recomposed households can be considered under special conditions. Among several spouses in a polygamous marriage, only one might be treated as spouse. Next, children may be adopted rather than directly related. Children who have reached majority (notably at the age of 18 to 21) can be considered either as minors or as adults. Orphaned grandchildren might be treated the same way as children, and even a distant relative of a minor child who is not otherwise supported might be recognised as legal guardian and therefore treated like a parent.
To obtain a first overview of how legislation on family migration in OECD countries has responded to the variety of family situations, Table 3.3 shows, for each OECD country, which members of a person’s family may be eligible for family reunification. A family member is indicated as eligible whenever either a citizen of the OECD country or a legal foreign resident is entitled to reunify with this family member. While the entitlements of citizens sometimes extend to more extended family members than in the case of legal foreign residents, entitlements of legal foreign residents are often the same as for citizens after a certain period of legal residence.
Without exception, spouses and dependent children are eligible for family reunification in all OECD countries, highlighting a universal recognition of the ties within the nuclear family. At the same time, Table 3.3 also attests to the variety in family migration policies regarding non-married partners, non-dependent children, grandchildren, and other adult family. While registered partners are eligible for family migration in more than half of all OECD countries, fiancés are rarely eligible. Dependent adult relatives are about as often eligible as registered partners. While non-dependent parents are eligible in only one-third of all OECD countries, they are still more often eligible than other non-dependent adult family such as siblings, grandparents, aunts or uncles. In the European Union, for example, the 2003 Directive (Box 3.4) allows for some flexibility.
The European Council’s Directive 2003/86/EC on the right to family reunification grants third-country nationals residing lawfully in a member state of the European Union on a residence permit for a period of validity of one year or more the right to bring their spouse, minor (including adopted) children and the children (including adopted ones) of their spouse to the country in which they are residing. This right applies both to family relationships established before and after the sponsor arrived in the member state.
The Directive leaves it up to member states to decide whether or not to allow third-country nationals to reunite with further, non-nuclear family members. These further categories include dependent relatives in the direct ascending line, unmarried or registered partners, adult dependent children and the dependent minor children of further spouses and the sponsor in the event of a polygamous marriage. Moreover, in acknowledgement of children’s capacity for integration at early ages, the Directive spells out the possibility for Member States to limit the right to family reunification of children over the age of 12, whose primary residence is not with the sponsor, and to require that the application for family reunification of minor children be submitted before the minor reaches the age of 15. Finally, in order to support better integration and to prevent forced marriages, member states may require the sponsor and his/her spouse to be of a minimum age (no higher than 21 years) before the spouse is able to join the sponsor.
The family members who are least often eligible per se are adult or married children, despite their direct family relations: they can enter through family reunification only in the Czech Republic, Germany, Latvia, Norway, Sweden, Switzerland and the United States (Table 3.3). In several countries, non-dependent children are not eligible while grandchildren or non-dependent adult relatives beyond the parents may be eligible under certain conditions: this is the case in Australia, Canada, Finland, Ireland and the Slovak Republic. Conditions include that the grandchild is dependent (the Slovak Republic) or, for non-dependent adult relatives, that they are needed as caregiver (Australia) or are the last surviving family members (Canada). While non-dependent children might apply under the latter two provisions, it appears overall that non-dependent children are treated less favourably than non-dependent parents and are not treated more favourably than other non-dependent adult relatives or grandchildren.
As another dimension of differences highlighted by Table 3.3, legislation on family migration can comprise of all or most types of family members, or can be limited to very few. All types of family members shown are eligible for family reunification in Sweden and the United States, and most of them are eligible in Australia, Germany, Norway and Switzerland. By contrast, very few types of family members – by and large only the nuclear family – are eligible in Japan, Korea, Luxembourg, Poland and Turkey. In Israel, spouses of Israeli citizens are generally eligible, with some exclusions based on citizenship, while spouses of foreign residents are not.
For selected OECD countries, Figure 3.9 shows the composition of family migration inflows by the kind of family member, drawing on national statistics for 2015. In both Australia and Canada, accompanying family (spouses and children) of economic migrants comprised more than half of inflows. Excluding accompanying family, spouses or partners represented about 80% of the family category inflow in Australia, while children only accounted for 5%. In Canada, children under the age of 15 accounted for about 43% of accompanying family and almost all child family migrants. Similarly, children made up large shares of the family migration inflows to the United States and Germany (at least 40% and 34%, respectively). Among the countries that reported spouses of citizens separately, this group accounted for a prominent part in France and to a lesser extent in Germany. Parents (and grandparents where applicable) accounted for substantial shares notably in Canada (10% of total family flows) and the United States (19%), but also in Australia and Germany (7% each). Among the countries shown in Figure 3.9, siblings only accounted for a significant share in the United States. The family migration inflow to Japan was dominated by family members of migrants who are not permanent residents, while family members of permanent residents only accounted for 6% of the inflow.
The main origin countries of family migration inflows, as indicated in Figure 3.9, often include the origin countries of major long-standing groups of immigrants: Mexico in the case of the United States, China and India in the case of Canada, Turkey and the Russian Federation in the case of Germany. In the case of France, all three main origin countries coincide with those of main immigrant groups. Two countries seem to appear regularly among the main origin countries: China is one of the three main origin countries for family migration inflows in Australia, Canada and Japan. The Philippines is a main origin country in Canada, Japan and the United States.
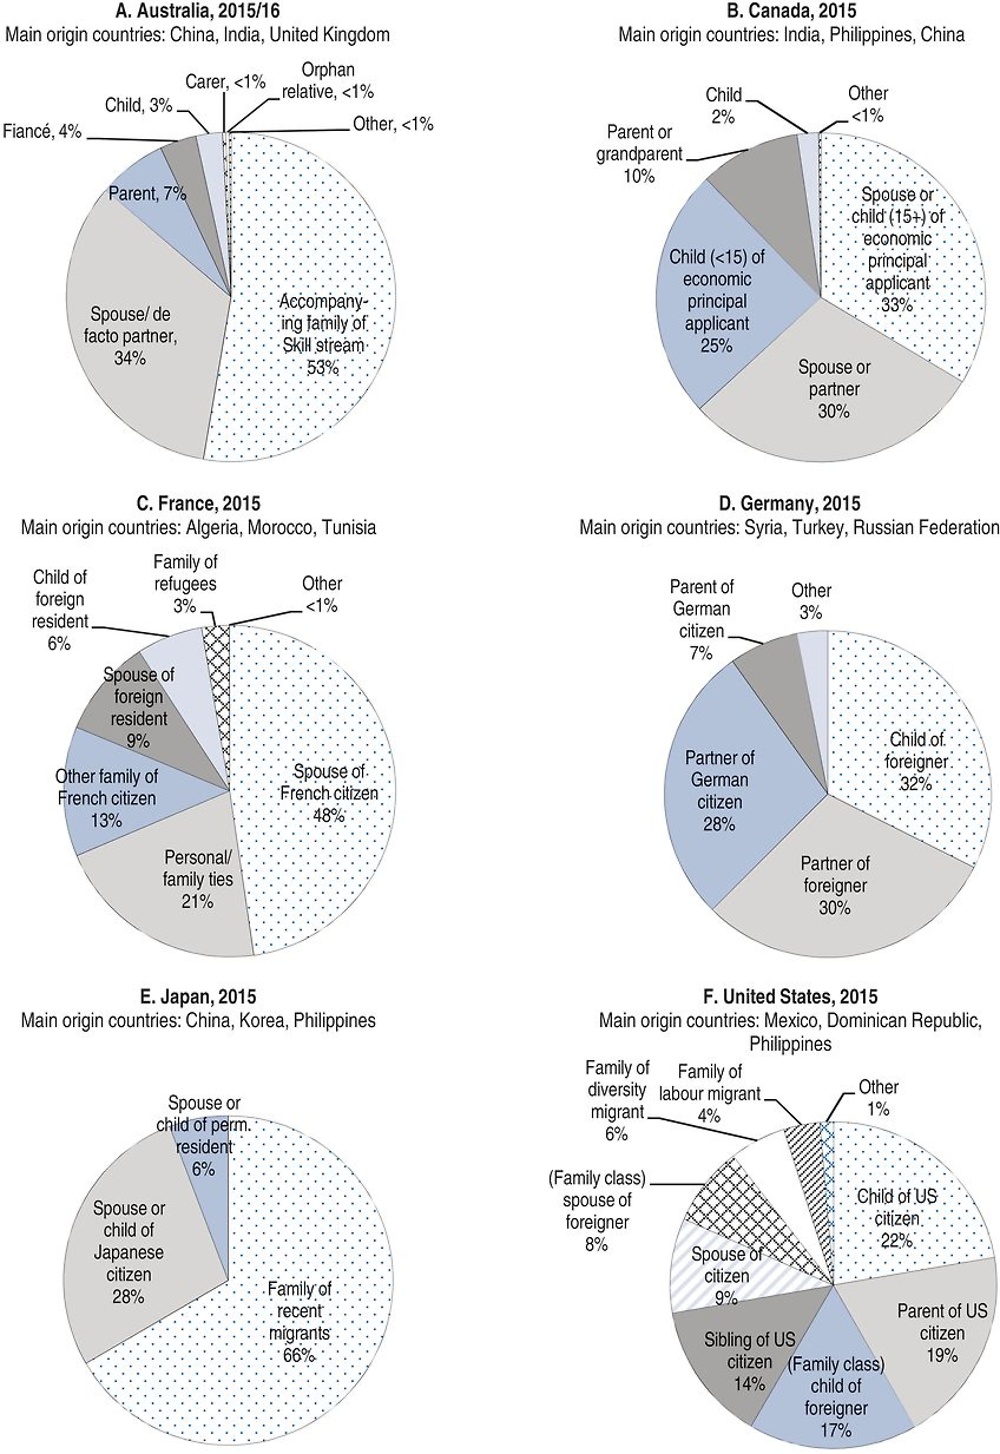
Note: Main origin countries for Australia and Canada refer to the family stream and sponsored family, respectively. Figures for the United States only include new arrivals. Main origin countries for the United States are based on family class and immediate relatives of US citizens including adjustments of status. Main origin countries for Japan are based on spouses of Japanese citizens, and “recent migrants” refers to migrants who are not permanent residents in Japan.
Source: National sources.
Although women dominate family migration flows, men typically comprise at least 40%
Despite the large heterogeneity of people covered by family migration, one characteristic holds true across OECD countries: family migration flows predominantly consist of women. Figure 3.10 shows that the share of women in family migration flows consistently exceeded 50% in 2015. Women accounted for 53% of family-sponsored migrants who moved to the United States in this year, and for 60% of those admitted as immediate relatives of US citizens. Likewise 60% of family migrants moving to European OECD countries were women, 57% of sponsored family arriving in Canada and two-thirds of the family stream in Australia.
In all cases, the share of women in family migration inflows (including both family-sponsored preferences and citizens’ immediate relatives in the United States) was larger than in other types of inflows, notably the inflows of labour migrants. In the United States, Canada and Australia, these other inflows also include accompanying family migrants, e.g. as dependent family of labour migrants. For flows to Australia in 2010-11, the share of women among dependents of principal migrants is available (Department of Immigration and Citizenship, 2011). While women accounted for 47% of the skill stream in 2010-11, they comprised only 35% of the principal migrants but 60% of the dependents. Figure 3.11 similarly shows the predominance of women among accompanying family in New Zealand, Norway and Sweden. These figures suggest that women also make up the majority among accompanying family counted towards other migration inflows than family migration.
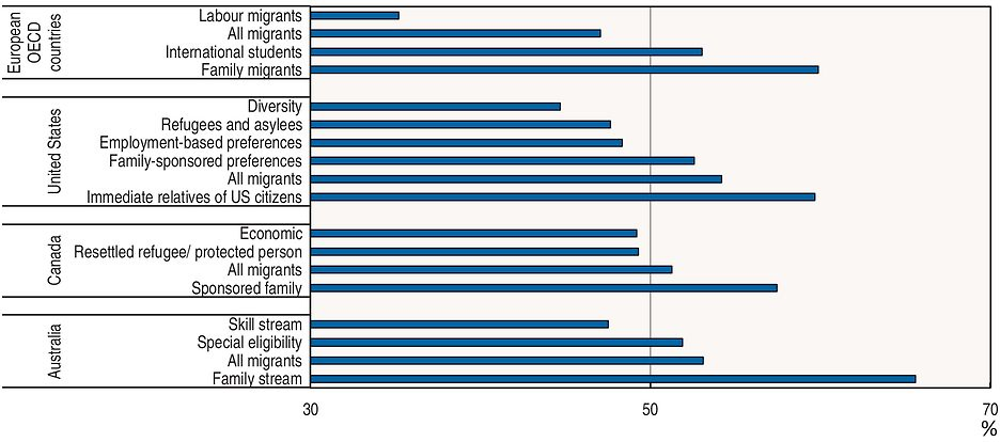
Note: Figures for Europe do not include Germany, Finland and the Netherlands. Figures for diversity, refugees and asylees, and employment-based preferences in the United States include accompanying family, and the same applies to figures for Canada and Australia.
Source: Eurostat Residence Permit Data Collection (Europe), national sources (United States, Canada and Australia).
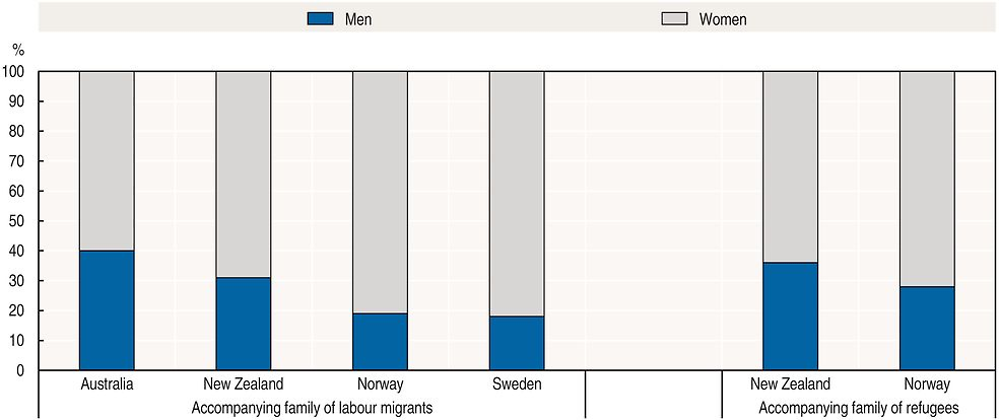
Note: Figures for Australia refer to 2010-11. Figures for New Zealand refer to 2012/13 and exclude persons younger than 20 years. Figures for Norway exclude persons younger than 18 years.
Source: National sources.
Since migrants’ children are as likely to be female as to be male, the predominance of women in family migration likely reflects particularly high shares of women among adult family migrants: spouses and partners. Known as the phenomenon of “trailing wives”, this suggests that a male partner in a couple is more likely than a female partner to be the principal migrant, while a female partner is considerably more likely to be a family migrant who accompanies or later reunifies with the principal migrant (e.g. Cooke, 2008). As one cause of these differences, empirical studies of couples’ migration behaviour point to the couple’s beliefs about gender roles, with the effect that men are more likely than women to take up job opportunities that require the couple to move (see e.g. Bielby and Bielby, 1992). Such gender-related differences in response to opportunities for migration are also still observed in countries perceived to have achieved a high degree of gender equality (see Nivelainen, 2007 for Finland; Brandén, 2014 for Sweden, and Junge et al., 2014 for Denmark). Recently, the pattern has started to change. Partly as a result of women achieving higher education levels in countries of origin and because of increasing demand for foreign labour in female-dominated sectors (such as domestic services, care and health), the share of migrant women among principal applicants for economic migration and study has increased (OECD 2017a). This may be the start of a rebalancing in the gender composition of family migration in the future. Indeed, recent data for selected European countries suggest that the gender of sponsors of family migrants is evenly divided between male and female (European Migration Network, 2017).
Family migration inflows to the OECD include more than 400 000 children annually
Large numbers of children under 15 years of age move to OECD countries through family migration. In 2015, more than 120 000 children were among family migration inflows to the United States, 40 000 in the case of Italy and almost as many in the case of Canada (Figure 3.12). With totals of 22 000 children under 18 moving to Germany through family migration and at least 16 000 moving to France, family migration flows to the European OECD countries shown in Figure 3.12 included about 200 000 children under 15. A figure for Spain is not available but is likely to significantly increase this number. At least another 14 000 children were among the flows to Australia and New Zealand. The total figure for all OECD countries together therefore likely exceeds 400 000 children under 15, not counting children in inflows of refugees.
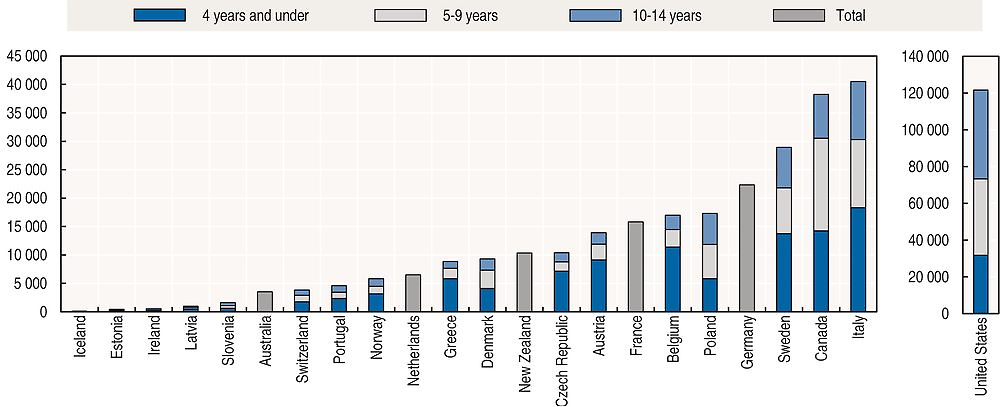
Note: Totals are given where information by age group is unavailable. Figures by age group for European OECD countries also include children with a residence permit for reasons other than family, employment, education and asylum. The figure for the Netherlands refers to children under 18 in these categories in 2011. Figures for the United States and Canada include all categories except refugees. The figure for Germany refers to children under 18, the figure for France does not include children in the category “Liens personnels et familiaux”, and the figure for New Zealand includes all secondary applicants aged up to 19.
Source: National sources and Eurostat Residence Permit Data Collection, http://ec.europa.eu/eurostat/statistics-explained/index.php/Residence_permits_statistics.
At least 130 000 of these children were under four years of age. Due to data limitations, this figure does not include infants arriving in major destination countries such as France and Germany. Infants under four years were considerably less frequent in family migration inflows to the United States than in those to European OECD countries: infants accounted for roughly one-quarter of the children arriving in the United States compared with more than half of the children arriving in those European OECD countries for which information by age group is available.
Family migration policies in OECD countries
The framework for family migration is governed by international, supranational and national legislation, with the legislation and regulations in some OECD countries determined to a large extent by international commitments.
International commitments governing family reunification
The framework for individual rights to family life has been developed in a number of international agreements. The Universal Declaration of Human Rights (1948) affirms (Art. 16) that all individuals have the right to marry and found a family, and the United Nations Convention on the Rights of the Child (1989) commits signatories to ensure that children will not be involuntarily separated from their parents.6
The ILO Migrant Workers Convention 143 (1975), ratified by 23 countries (including five OECD countries: Italy, Norway, Slovenia, Portugal and Sweden), allows – but does not obligate – signatories to “facilitate the reunification of the families of all migrant workers legally residing” (Art. 13).7
Within Europe, a number of instruments establish the general framework. The European Convention for the Protection of Human Rights (1950) affirms (Art. 8) that everyone has the right to respect for his private and family life; the European Social Charter (1961) affirms (Art. 19) that countries must make every effort to facilitate the family reunion of migrant workers who themselves have permission to stay in the country; and the European Convention on the Legal Status of Migrant Workers (1977) makes provision (Art. 12) for family reunification.
The European Union has been a driver of family reunification rights, starting with the 1964 Directive on the abolition of restrictions on the movement and residence of member states’ workers and their families (64/240/EEC) and several other directives in the same year. More recently, the European Council Directive on the right to family reunification (2003) established minimum criteria for family reunification legislation in the countries covered by the Directive (all EU countries except Denmark, Ireland and the United Kingdom). The Directive requires that non-EU nationals holding permits valid for at least one year and potentially eligible for long-term residence be allowed to bring family members (see Box 3.4). Maintenance, integration and residence conditions may be imposed, but no more than two years of legal residence may be required.
An additional important driver of family reunification in the European Union is Council Directive 2004/38 on Freedom of Movement and of Residence, meant to ensure that EU nationals whose family members are not EU nationals are able to move within the European Union without their family members’ nationalities being an obstacle. It includes children up to age 21, parents who are dependent, and other dependent family members.
National legislation
National legislation governing family migration has developed in parallel to these international instruments, often influenced by the international framework. In most OECD countries, “family grounds” have long been a reason for admission, although discrete legal categories of admission appeared largely in the post-war period.
In the United States, for example, the right of citizens to bring certain family members was ensured in 1924. It was subject to country-of-origin caps benchmarked to the 1890 census, effectively imposing racial restrictions. In 1952, relatives of US citizens were exempted from caps. In 1965, origin restrictions were eliminated and quotas were established for the family members of lawful permanent residents, as well as siblings and adult married children of citizens.
In Australia, family migration appeared as a distinct admission category in 1989. In Canada, the 1952 Immigration Act allowed discretion for family reunification for non-European foreigners who had previously been subject to exclusion. Broader categories for family were created in 1976. In Switzerland, family migration was already covered in the 1931 law on the residence of foreigners.
In Western Europe, family migration policies evolved in the post-war period through 1990 alongside guestworker and labour migration programmes in the main destination countries. Family reunification policy developed especially following the decline in labour admission programmes. Germany, for example, imposed a labour migration recruitment stop in 1973, but continued to admit family members of resident workers under the responsibility of individual Länder. In 1998, family reunification came under German federal jurisdiction. Family reunification was codified in Belgium in 1980. In France, while settlement of families of foreigners was allowed under a 1945 Decree, regulations governing family reunification were introduced only in 1976. In the Netherlands, family reunification appears in the implementation regulations of the 1965 Aliens Law.
Countries of more recent immigration incorporated specific provisions for family migration later: Spain in 1985 and Italy in 1989. In most countries in Central and Eastern Europe, family migration was written into new Aliens Laws in the early to mid-1990s, following the end of communism. The Czech Republic and Slovak Republic, for example, drafted their first explicit family migration provisions between 1994 and 1997.
Key features of family migration regulations
Family migration regulations are based on several parameters: the status of the sponsor (whether a national or foreigner, and in the latter case, the type of permit); the relationship with the family member (as discussed above); and the individual characteristics of the family member. Requirements may include a minimum residence period, income and accommodation resources, age ranges for partners and children, and language or integration requirements. These policy measures are summarised in Table 3.A1.1.
Sponsor status
As noted above, citizens may sponsor spouses and minor children without restriction in almost all OECD countries. Restrictions on reunification with minor children by citizen sponsors tend to be the least onerous, and in many cases there are no requirements beyond proof of a genuine connection. Family formation, on the other hand, may be subject to a range of requirements, and reunification with family members contingent on the resources and characteristics of both sponsor and family members.
Non-citizens’ ability to sponsor family members depends on their residence status. Permanent-type migrants – those with long-term and renewable permits, or those granted permanent residence – generally have some access to family reunification. Temporary categories where the status is not renewable generally do not, although there are exceptions for students, researchers and temporary workers in most countries. Examples of categories where no family reunification is allowed include seasonal workers in all OECD countries, and temporary workers in time-limited programmes such as the H-2A and H-2B in the United States, the Employment Permit System for non-professional workers in Korea, technical interns in Japan, and care and construction workers in Israel. Family members may however qualify independently for a temporary visit visa or permit, without residence or work rights.
There may also be a minimum residence period before foreigners may sponsor their family. In EU countries covered by the Family Reunification Directive, this is no more than two years, although most EU countries impose a one year residence requirement (e.g., Belgium and the Netherlands) or less than two years (15 months in the Czech Republic). Greece requires two years. Denmark, which is not bound by the EU Directive, imposes a three year residence requirement. Norway has, since 2010 required four years of residence before certain groups of migrants may sponsor a family formation migrant. Exemptions apply for most permits for highly qualified labour migrants, who may bring accompanying family; this is the case for the EU Blue Card, which grants family reunification within six months.
Restrictions on age for sponsored family
For core family members, age limits may apply. The age limit for marriage migration is generally intended to reduce the risk of forced marriages. This applies both to the sponsor and to the sponsored spouse, due to a concern that residents might be forced into marrying someone from their own families’ home country. Minimum age requirements apply in all OECD countries for the family migration of spouses or partners. In most cases, they are set at the age of majority (18 years), but the trend has been to raise this age. In 2010, for example, the threshold rose from 21 to 24 years in the Netherlands, and from 18 to 21 in Austria. In the Czech Republic, it is 20. In Denmark, it is 24 for both the sponsor and the partner. In Norway, the age was increased to 24 for both spouses in 2017, with exemptions possible for couples where the authorities are convinced the marriage was undertaken by free will. In Belgium and the Netherlands, the limit is 18 years for couples which pre-date the sponsor’s migration and 21 years for newly formed couples. In New Zealand, the minimum age may drop to 16 years if the couple has parental support.
For children, the maximum age is generally majority (18 years), although it may vary. In Denmark, the maximum age for children is 15 years, although those between 15 and 18 may qualify on the grounds of special exemptions. In Canada, the maximum age is 19 years, while in the United States it is 21 years. Married children aged 16-18 may be ineligible. In New Zealand, unmarried children 18-24 are eligible. In Ireland, children up to age 23 may be considered if they are dependent on the parent and in full-time education.
In most cases, children are eligible for family reunification even if one of the parents lives abroad. Denmark weighs requests for reunification of children over age 8, who have one parent with them in a foreign country, against their “potential for successful integration”. If the family is not considered to have sufficient ties to Denmark and the instruments necessary for integration, the application may be denied.
In OECD countries where family migration is allowed for relatives other than the applicant’s immediate family, admission is generally subject to a minimum age requirement and, often, proof of dependency. For example, family migration for ascendants has been restricted to family members above the age of 65 years in Spain, with some flexibility since 2011. In 2012, the United Kingdom extended dependency conditions for family reunification of relatives over age 65 from financial dependency to care or medical dependency.
Restrictions to avoid forced marriages and marriages of convenience
Most OECD countries have devoted efforts to deter marriages of convenience. Nonetheless, not all countries require an in-person interview or other mechanism to determine whether a union is real or of convenience. Disincentives for abuse of the family formation channel include, for example, a Canadian rule preventing new permanent residents, sponsored as a spouse or partner, from sponsoring a new spouse or partner if they have rapidly abandoned their own sponsor. Many spouse and partner permits are conditional, and are reassessed after a period of time to determine whether the relationship is genuine before permanent residence is granted. Australia, for example, conducts such an assessment after two years. Not all countries have a legal definition of marriage of convenience, even if all countries take steps to detect fraudulent unions. Within Europe, such measures vary, although techniques for risk triage and fraud prevention are converging (European Migration Network, 2012).
Brokered international marriage, where couples are introduced through commercial services, is one area where policy has been increasingly active to address potential abuses and exploitation. In Korea, the government became concerned about the high divorce rate and the risk of abuse in brokered marriages where the foreign spouse could not speak Korean (Chaloff, 2012). When the industry was regulated in 2012, about one in four marriages between a Korean and a foreigner was brokered through an agency. From 2014 foreign spouses have been required by the Ministry of Justice to pass a Korean language test before a visa can be issued. Applicants who fail must wait six months to take the test again. An income requirement was also imposed on the Korean sponsor. The Ministry of Justice may exempt the spouse from the language test if there is evidence that the couple is able to communicate.
Income and self-support
Sponsor or household income requirements are based on the idea of preventing benefit dependency and poverty, but actual income requirements vary according to the country and the circumstances. The trend has been to maintain or tighten the threshold. Thresholds can be set by poverty level, minimum wage or the threshold for public benefit. In the Netherlands, for example, the minimum resource requirement is usually at least equal the statutory minimum wage. In Norway, it is to have an adequate life on the basis of the “reference person’s” earnings without public support; Norway considers the expected minimum future income and proof of a similar past income. In the United States, the sponsor must demonstrate household income of at least 125% of the national poverty level for the household size, based on tax declarations and proof of income. In Denmark, applicants must prove they have not received public means-tested support in the previous three years and also set aside a bank deposit to cover any social benefits their spouse might receive. The United Kingdom introduced a fixed threshold for family migrants in 2012. It sets a minimum gross annual income for settlement sponsorship, based on a calculation of how much is necessary to live “independently without them becoming a burden on the State” (Migration Advisory Committee, 2011). As this is not a fixed legislative threshold, the UK Migration Advisory Committee proposed a threshold based on certain means-tested benefits (this was set at GBP 18 600, about EUR 22 000).
In some countries, certain permits are available only to higher-income workers. Income tests are thus obviated for this group as a whole. This is the case for professional labour migrants in Japan and Korea, for example, as well as for the EU Blue Card and for family members of most skilled workers in the United Kingdom, where income thresholds are intrinsic to the sponsor’s permit.
In most cases, thresholds vary according to family size, with incremental increases in the requirement for additional family members. These incremental increases were not always part of the original thresholds; for example, Spain introduced additional thresholds only in 2011. Further, there are generally exemptions for certain cases, especially for citizens.
Housing and accommodation
Housing requirements are common, but not universal, since the income and means test may be considered sufficient proof that adequate housing can be provided. This is the case, for example, in Japan, Norway and the United States, which do not have housing requirements. Where there is a requirement to demonstrate accommodation, the principal consideration is that the dwelling is habitable and that there is no overcrowding, according to the national standard for overcrowding. This may require certification from municipalities or health boards, or inspection, procedures which can lengthen and complicate family reunification requests. Exceptions may be made from the obligation to demonstrate adequate housing for certain groups of sponsors, principally refugees and those with subsidiary humanitarian protection. Annex 4.A4 in Dumont et al. (2016) details the conditions applied to family migration when the sponsor is a refugee, a beneficiary of subsidiary protection or an unaccompanied minor.
Language and integration requirements
Language requirements may be imposed on potential family migrants, or on family migrants as a condition for renewal. In many OECD countries, language is a requirement further on in the residence process, either for acquisition of permanent residence or for naturalisation, but the conditions for permanent residence are generally similar across migration categories, with no separate treatment of family migrants.
Pre-admission language requirements are generally not imposed, and if so, are imposed only on the spouse and not minor children. The Netherlands applies a language test, under its 2006 Civic Integration Act Abroad, requiring at least A1 level of Dutch under the Common European Framework, the lowest level of language knowledge, for family migrants. Germany has imposed a pre-entry language test since 2007, requiring spouses to have a basic knowledge of German. The United Kingdom has a pre-entry A1 level English language requirement in place since 2010. Austria has had one since 2011.
New Zealand requires certain family members to demonstrate that they speak English, or to pre-purchase a language class, paying the New Zealand authorities in advance for their future course. The fee depends on the level of English demonstrated and ranges from NZD 1 700 to NZD 6 700 (EUR 1 100 to EUR 4 400). In Australia, family members of principal applicants in certain visa categories, who are assessed as not having functional English language skills, must pay a significant additional fee, of AUD 4 890 (EUR 3 500) per adult secondary applicant, prior to issuance of their visa.
Post-entry language requirements are in place in countries which use an Integration Contract model. For example, in both France and Italy, family migrants undertake to acquire a basic level of language proficiency after arrival. In the Netherlands, post-admission requirements have been in place since 1998. Migrants must acquire A2 level within a few years of entry. In the United Kingdom, since 2016, Non-EU/EFTA national partners (and parents) on the family route must pass a test at level A2 of English (oral only) after 30 months in the United Kingdom if they wish to extend their permit.
Benefits and rights offered to family migrants
The conditional grounds used to approve family migration, described above, often reflect a concern that family migrants may use public benefits. There may be, for this reason, restrictions on benefit use, especially during an initial period of residence.
The right to seek employment depends on the residence status. Labour market access is granted to adult family migrants in most OECD countries, although this is not universal and some restrictions may apply, at least until permanent residence is acquired. In settlement countries the family of permanent migrants have unrestricted labour market access.
Temporary skilled workers’ family members similarly enjoy full labour market access in most cases. A number of European countries impose a requirement for spouses to obtain work authorisation (e.g. Belgium), as does the United States for certain temporary workers (such as intra-company transfers and those who are awaiting a Green Card). Japan requires that accompanying family qualify for a work permit category in order to take up employment, except for family of the most highly qualified temporary workers.
Conditions are more complicated for family members of students, who generally must qualify for a separate work permit. Exceptions include Canada, which grants unlimited access; New Zealand, for partners of higher-level students; and Australia, which sets a limit to the number of hours a student’s partner may work, although there is no limit for partners of graduate students. In the United States and Israel, partners of students may not work.
Policy trade-offs
Family migration policy has to balance a number of overlapping and competing objectives, which explains the diversity in the conditions applied at different times and to different individuals and family constellations.
First, it has to balance a respect for the right to family life with the need to ensure programme integrity. This translates into efforts to identify marriages of convenience and forced marriages. It also explains the imposition of minimum age limits for marriage as well as “centre-of-gravity” requirements. “Centre-of-gravity” requires applicants to demonstrate that their family life is centred primarily in the country in which they wish to reunify, rather than the origin country or a third country. For example, in Denmark, the spouse residing in Denmark and the applicant’s “combined connection to Denmark” must be “greater than their combined connection to another country”. It may mean providing family formation migrants with provisional residence while the veracity of their relationship is demonstrated. Such provisional periods, however, make the spouse dependent on the sponsor and more vulnerable to possible abuse by their spouse. Canada, for example, introduced a two-year conditional residence for spouses (in the absence of children) in 2012 and eliminated it in 2017. Greater integrity measures can also lead to backlogs. Backlogs have negative consequences not only on the individuals who are waiting to be reunified, but can discourage migration and retention by the primary applicant, lead voters who are related to applicants or their sponsors to express their dissatisfaction at the polls, and take resources away from processing other migrant categories.
Second, family migration policy has to balance respect for family life with an interest in ensuring that the conditions exist for integration of family migrants. Integration and language requirements, such as those in Germany and the Netherlands, for example, reflect this concern. Ensuring that family migrants have a minimum knowledge of the language and familiarity with the society should favour their integration. Such requirements disproportionately affect the less educated family members, in terms of the cost to meet the requirements and the likelihood of passing. Further, the stricter the requirements, the more exemptions are needed for categories in need of protection and for targeted groups, such as the highly qualified, for whom the risk of social exclusion is judged to be low.
Third, an interest in ensuring economic stability of the family must be balanced against the risk that excessive requirements will only delay family reunification with negative consequences for the educational outcomes of the children and the occupation outcomes of the adult. Minimum housing and income requirements can ensure that the primary applicant is able to keep the family above any benefit threshold, out of poverty and with a reduced risk of exclusion. However, reaching and maintaining an income above the threshold may be difficult, especially in times of crisis. Income requirements penalise younger people, who have not moved up the earnings curve, and women, who may earn less and whose income is also affected by life events such as childbearing. Housing markets may be tight and migrant families, with lower home-ownership than the native born, are also at greater risk of overcrowding in many OECD countries. It may be many years before a migrant is able to meet these requirements. Exemptions may also have to be made in the interest of children who need guardians. Similarly, the minimum residence requirement serves to prove that a foreigner is anchored and settled enough in the country to justify bringing family, but this delay may have negative consequences on the family well-being and the outcomes of children. There may also be compliance issues with the creation of a market for fraudulent housing and income proof.
Finally, there is the trade-off that arises from allowing in more extended members of the family, and increasing the multiplier effect of migration. Extending eligibility to older family members, in particular, has less of an economic justification, but may be important for the economy of individual families where parents and grandparents play a major role in the distribution of unpaid work. A few countries, such as Japan, have experimented with the options of extended family migration for targeted categories. Others, such as Canada, have found means to ensure family presence without granting benefit access or residence rights, or applying a quota to categories of extended family members.
How family migrants fare: Evidence from stock data
If most OECD countries have made it easier recently for family members of highly skilled migrant workers to join them and access the labour market and maintain very open admission policies in cases of family formation through international marriages with their citizens, many others have tightened the conditions for family migration for other groups of foreign citizens. The implicit justification for this relies in part on the assumption that easier family migration could act as a push factor for future migration and in part on the perception that family migrants do not integrate sufficiently well in the destination country. Evidence supporting these two hypotheses is however particularly scarce and inconclusive. This section offers elements to further analyse family migrants’ socio-economic characteristics and labour market outcomes across OECD countries, as well as those changes that have taken place over time.
Data on stocks or cohorts are required to obtain insights on their situation after arrival and on changes over time (see Box 3.5 for more information on available data sources).
Beyond the data on migration inflows described in Box 3.1, very few data sources include the crucial information on migration category, without which family migrants cannot be identified. Stock or cohort data used here have the advantage that they include a rich set of variables, including socio-economic information on education, language skills and household characteristics.
The stock data used here include two international-level data sets for European OECD countries: the European Labour Force Survey and the Eurostat Residence Permit data base (see Box 3.1). National-level data sets are used for the United States, Canada and Australia. These data sets contain cohort rather than stock data: while they provide information on migrants several years after their arrival, this information always refers to migrants who had arrived in one or two particular years (i.e. particular cohorts). This means that all migrants in such cohort data exhibit a similar duration of stay. By contrast, the stock data for European OECD countries cover all migrants present at the time of the survey, irrespectively of when they arrived and how long they have stayed.
With both cohort data and stock data, one has to keep in mind that they do not cover migrants who have left the country. Because the characteristics of those who stayed might differ systematically from those who left, and because some characteristics change over time, results on migrants obtained from cohort data or stock data do not necessarily align with results obtained from data on migration inflows.
European Labour Force Survey (EU LFS)
To produce the annual European Labour Force Survey, Eurostat merges household survey data from the 28 member countries of the European Union, three EFTA countries (Norway, Switzerland and Iceland), as well as Turkey and the Former Yugoslav Republic of Macedonia. The stock data in the European Labour Force Survey notably cover the labour force status, age, sex, marital status and educational attainment of individuals aged 15 and above. Household identifiers allow linking adult persons living in the same household, so that comparisons can be drawn between the characteristics of two spouses in a married couple.
In two years (2008 and 2014), the European Labour Force Survey was extended by an ad-hoc module (AHM) that oversampled migrants and introduced a small number of additional questions specifically to explore the situation of migrants and their families. From these data, information on the self-reported main reason for migration (labour migrant, family migrant, international student, humanitarian migrant) can be cross-tabulated with several variables, including education, employment status and duration of stay. However, some European OECD countries are not covered in the ad-hoc module in 2014: this concerns Denmark, Ireland and the Netherlands. Data for Germany were not available at the micro level when this chapter was written. In the 2008 AHM, family migrants can only be identified in the pre-2004 EU Member States.
Self-declared reasons for migration might not always coincide with the migration motive suggested by the residence permit. Figure 3.13 highlights how numbers of family migrants can differ depending on the way they are identified: it compares the stocks of valid residence permits for family migrants to stocks calculated from the 2014 ad-hoc module of the European Labour Force Survey. The stocks of self-declared family migrants born outside the European Union are considerably larger in Spain and in France than the stocks of residence permits. The discrepancy is due to EU/EFTA citizens who were born outside the European Union. The same reason explains most of the difference between the stock of persons born outside the European Union and the number of residence permits in the United Kingdom. The remainder is due to the fact that the residence permit data do not enable to distinguish the initial category of entry of all long-term residents. By contrast, the total number of residence permits for family migrants in Italy exceeds the stocks of self-declared family migrants. The discrepancy between residence permits and self-declared family migrants who are not EU/EFTA citizens might reflect that many migrants who hold valid residence permits have left the country. It might also be due to the fact that the EU LFS often does not fully capture short-term migrants. Overall LFS data appears relevant to capture the stock of family migrants from third countries but should be taken with some caution as gaps remain with administrative data sources (which in turn suffer from shortcomings).
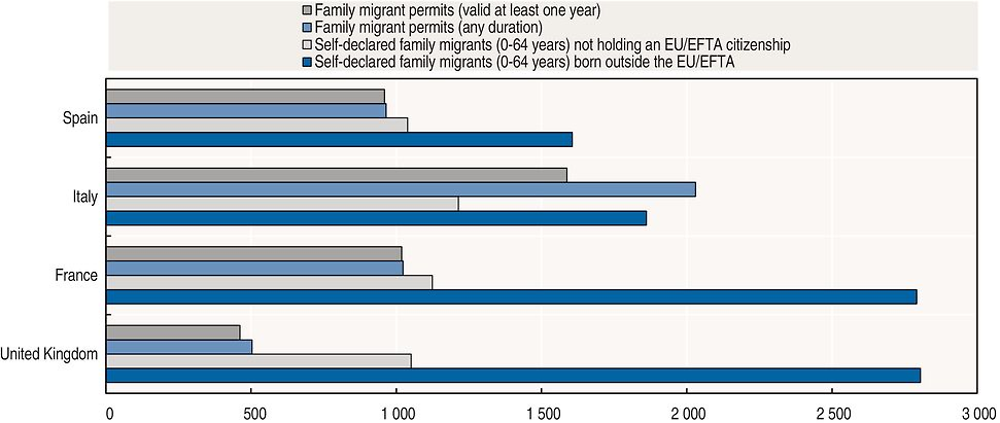
Note: Residence permits include all age groups while self-declared family migrants do not include persons older than 64. Family migrants born outside the European Union include all children born outside the European Union, and family migrants with non-EU/EFTA nationality include all children with non-EU/EFTA nationality.
Source: European Labour Force Survey (Eurostat) ad-hoc module 2014 on the labour market situation of migrants and their immediate descendants, http://ec.europa.eu/eurostat/statistics-explained/index.php/EU_labour_force_survey_-_ad_hoc_modules and Eurostat Residence Permit Data Collection, http://ec.europa.eu/eurostat/statistics-explained/index.php/Residence_permits_statistics.
Finally, in the 2014 ad-hoc module, all migrants who arrived as children (i.e. younger than 15 years) are coded as family migrants. In the 2008 ad-hoc module, their migration category was coded as a missing value. This difference becomes important after some years of residence, when those who arrived as children join the adult population and enter the labour market: when coded as family migrants, they become indistinguishable from family migrants who arrived as adults (the information on age and years of residence is not detailed enough to identify adults who arrived as children). This affects the results especially for adult family migrants with long durations of stay – many among them arrived as children and grew up in the host country. To ensure comparability between the 2008 and 2014 ad hoc modules, those who arrived as children are recoded to family migrants also in the 2008 ad-hoc module.
New Immigrant Survey (NIS)
The New Immigrant Survey (NIS) is a panel study of new legal immigrants to the United States. After a pilot survey in 1996, a representative sample of adult immigrants (18 years or older) was drawn in 2003 using administrative records at the US Immigration and Naturalization Service. All migrants in the sample had become lawful permanent residents in the period May to November 2003, including both newly arriving migrants and migrants who had arrived earlier (legally or illegally) but adjusted their status to lawful permanent residence in this period. The sample consisted of 8 600 principal migrants and 4 300 spouses.
Interviews were conducted in person or by telephone. The first round of interviews (NIS-2003-1) was held between June 2003 and June 2004. Response rates for principal migrants and spouses were 69% and 65%, respectively. As interview language, respondents could choose among seven languages in addition to English. The detailed questionnaire covered a wide range of socio-economic variables, information on family members and on the respondent’s migration history. The information on the respondent’s migration category was retrieved from administrative records. The second round of interviews (NIS-2003-2) was held between June 2007 and December 2009, so that each follow-up interview took place 4-6 years after the first interview, reaching a response rate of 45% among respondents from the first interview round.
Longitudinal Immigration Database (IMDB)
The Canadian Longitudinal Immigration Database (IMDB) links administrative records on individual immigrants to tax information. Since the early 1980s, migrants who obtain residence permits or permanent resident status have been included in the data set once they file a tax return. As their taxable income very often derives from wages, many migrants are included in the data only when they take up paid employment. Annual updates of the database not only include information about the newly-arrived annual cohort of immigrants but also new tax data for previous cohorts, so that cohorts are followed over time. The available information covers migration category, key demographic and socio-economic variables as well as language skills on arrival, earnings and benefit receipt.
Characteristics of Recent Migrants Survey (CORMS)
The Australian Bureau of Statistics (ABS) regularly conducts the Characteristics of Recent Migrants Survey as a supplement to Australia’s Monthly Population Survey. This chapter draws on information in the CORMS 2013 and in the CORMS 2007. Since 2007, the survey design has undergone only minor changes, so that results are comparable across time. These waves of the survey cover permanent migrants who came to Australia in the preceding 10 years and who were at least 15 years old when they arrived. Information is also available for temporary residents who intend to stay for at least 12 months. Foreign-born persons who already held Australian citizenship on arrival are excluded, as well as citizens of New Zealand (who benefit from free movement). Variables include demographic and employment characteristics, the type of visa on arrival, and language skills.
The analysis of stock data on family migrants reveals characteristics
Figure 3.14 uses the measure of self-declared family migrants born outside the European Union to provide totals for family migrants in European OECD countries. Four groups of countries can be distinguished in this figure. The United Kingdom, France, Germany, Italy and Spain all hosted large numbers of family migrants in 2014, ranging from 1.6 million in Spain to 2.8 million in France and the United Kingdom. Several populations of family migrants expanded noticeably between 2008 and 2014, with high growth rates observed especially in Germany (59%), but also in Italy (37%) and the United Kingdom (32%). A second group is made up by Sweden and Switzerland, hosting half a million family migrants each, as well as Luxembourg, hosting 21 000 family migrants. The much smaller populations of family migrants in these countries appear particularly dynamic, growing by 73% in Sweden and Luxembourg between 2008 and 2014, and by 39% in Switzerland.
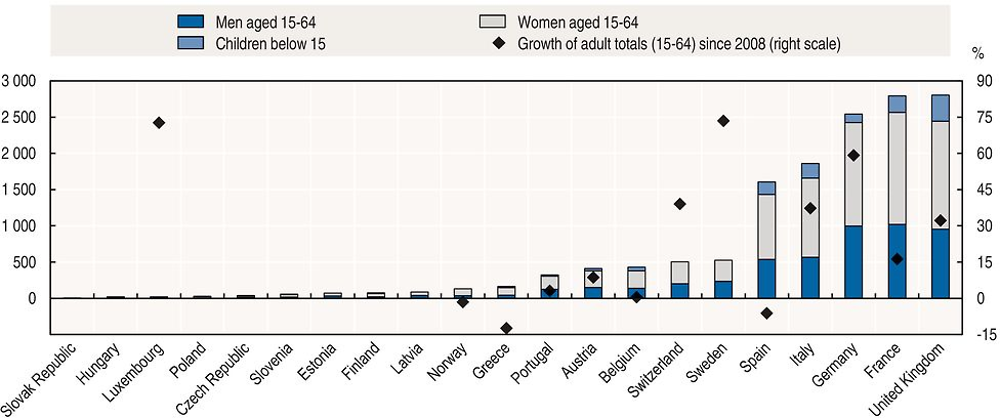
Note: Figures refer to self-declared family migrants born outside the European Union, and those aged above 64 cannot be identified. All children (aged below 15) born in non-EU countries are counted as family migrants, but growth rates are calculated without children. Information on children is not available for Norway, Sweden and Switzerland, and sample sizes are too small to identify their numbers in Estonia, Latvia and the Slovak Republic. Growth rates can only be calculated for countries included in both the 2014 and the 2008 ad hoc modules of the European Labour Force Survey.
Source: European Labour Force Survey (Eurostat) ad-hoc modules 2008 and 2014 on the labour market situation of migrants and their immediate descendants, http://ec.europa.eu/eurostat/statistics-explained/index.php/EU_labour_force_survey_-_ad_hoc_modules.
A third group of countries – Austria, Belgium, Greece, Norway and Portugal – combines family migrant populations between 150 00 and 450 000 with low or even negative growth rates (Figure 3.14). Comparatively few family migrants (below 100 000) were observed in OECD countries in Central and Eastern Europe, and growth rates are unknown in this case. For non-European OECD countries, comparable information on total stocks of family migrants is unavailable.
Family migrants are a high share of the migrant population
As in total migration inflows, family migrants generally also represent a large part of the total migrant population (Figure 3.15). Across OECD countries, they mostly accounted for 25%-50% of the total migrant population in 2014, while their share approached 75% in Estonia, Latvia and (in 2003) the United States. Shares below 20% were only observed in the Czech Republic, Hungary and Luxembourg. However, as shown in Figure 3.15, the shares of family migrants would be considerably higher in European OECD countries if free movement from EU countries was also excluded from the denominator.
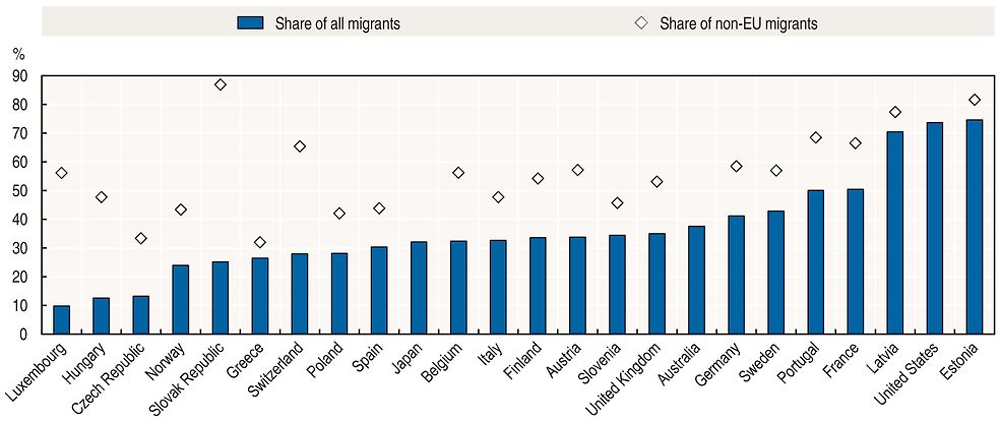
Note: Figures for European OECD countries refer to self-declared family migrants born outside the European Union, and those aged above 64 cannot be identified. The figure for Japan refers to non-permanent residents, the figure for Australia refers to recent permanent migrants not including citizens of New Zealand. The age ranges are for Australia: 15 and older, European countries: 15-64, United States: 18 and older, and all ages for Japan.
Source: European Labour Force Survey (Eurostat) ad-hoc module 2014 on the labour market situation of migrants and their immediate descendants, http://ec.europa.eu/eurostat/statistics-explained/index.php/EU_labour_force_survey_-_ad_hoc_modules, the New Immigrant Survey (US Immigration and Naturalization Service), http://nis.princeton.edu/index.html for the 2003 cohort of Legal Permanent Residents in the US, Characteristics of Recent Migrants (Australian Bureau of Statistics), www.abs.gov.au/ausstats/[email protected]/mf/6250.0 for Australia (2013), and the Japanese Ministry of Justice (2014).
Family reunification stands out, notably in Europe
The most recent available data on Japan and the United States allow for a more detailed decomposition of the total migrant population (Figure 3.16). In 2015, family migrants accounted for 30% of all non-permanent residents in Japan. Spouses or children of Japanese nationals made up half of this share (14%), and most of the remainder were dependent family of non-permanent residents (13%). While spouses of nationals thus represented a substantial share of the total migrant population, shares of other groups such as international students or principal labour migrants were considerably larger. By contrast, spouses of nationals made up by far the largest group in the United States, representing more than one-third of lawful permanent residents. Together with US citizens’ parents (10%), children or spouses of children (10%), and siblings or spouses of siblings (7%), family members of US citizens represent more than 60% of the total migrant population in the United States.
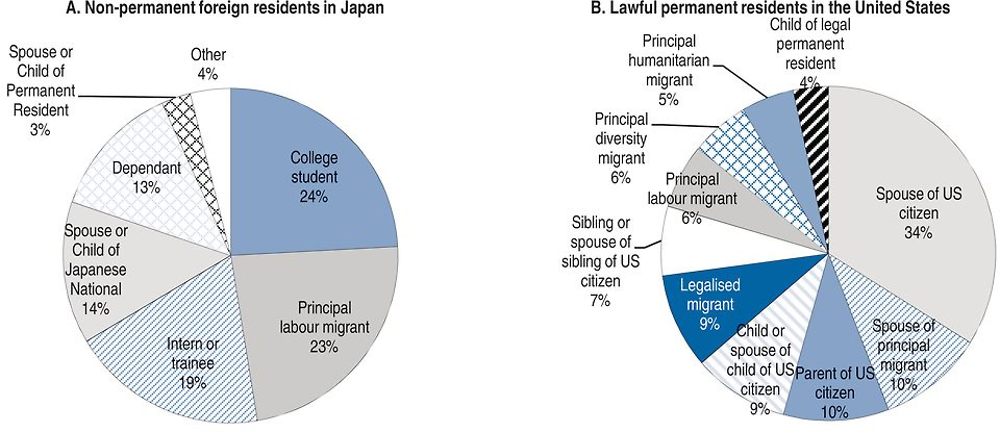
Source: The New Immigrant Survey (US Immigration and Naturalization Service), http://nis.princeton.edu/index.html and the Japanese Ministry of Justice.
Figure 3.17 presents a similar decomposition for a selection of European OECD countries. Estimates8 highlight the quantitative importance of family reunification for the stock of family migrants in European OECD countries: in 2014, family reunification accounted for about 30%-40% of stocks of recent family migrants in Austria, Belgium, France, and the United Kingdom, for almost 60% in Spain and for 70% in Italy. In all these countries, family formation with a foreign-born person was the second largest subcategory, mostly followed by family formation with a native-born ahead of accompanying family.
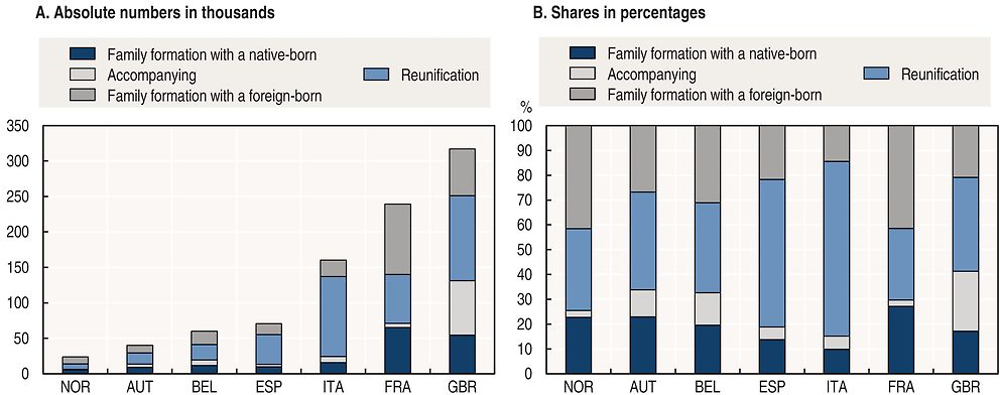
Note: Migrants are considered recent if they have arrived within the preceding five years. Family migrants (here only spouses) joining the principal migrant within five years of the principal migrant’s arrival in the host country are counted towards family reunification, while those joining later are counted towards family formation with a foreign-born. Data were unavailable for Denmark, Germany, Ireland and the Netherlands.
Source: European Labour Force Survey (Eurostat) ad-hoc module 2014 on the labour market situation of migrants and their immediate descendants, http://ec.europa.eu/eurostat/statistics-explained/index.php/EU_labour_force_survey_-_ad_hoc_modules.
In comparison to other migrants, recent family migrants are younger
The predominance of women in flows of family migrants presented above is confirmed by the analysis of stock data. Figure 3.18 shows that adult women (aged 15-64) represented the majority of family migrants in European OECD countries in 2014 as well as in OECD settlement countries, accounting for at least 60% of the stock.
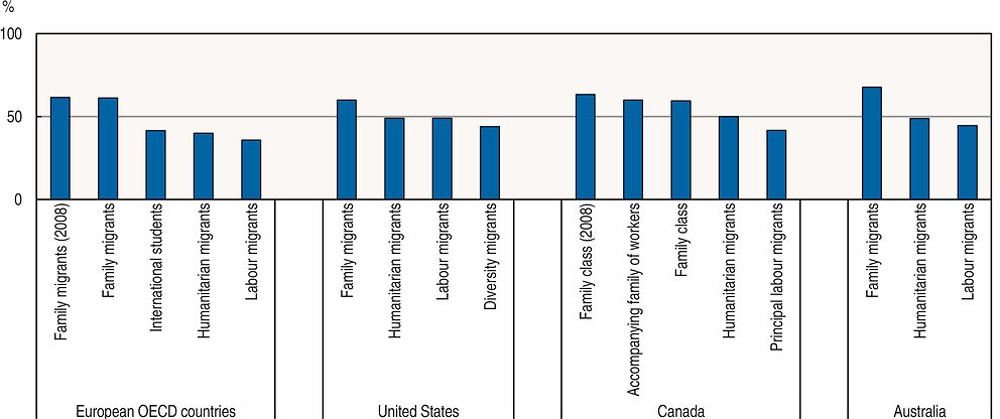
Note: Figures for family migrants in the United States refer to the family class (2003 cohort) and do not include family members of labour migrants, diversity migrants or refugees. For Canada, the 2014 figures refer to the 2010 cohort and the 2008 figures refer to the 2004 cohort. The figures for Australia (2013) refer to recent permanent migrants not including citizens of New Zealand. Figures for European OECD countries are for 2014. The age ranges are for Australia: 15 and older, European countries: 15-64, United States: 18 and older, and all ages for Canada.
Source: European Labour Force Survey (Eurostat) ad-hoc module 2014 on the labour market situation of migrants and their immediate descendants, http://ec.europa.eu/eurostat/statistics-explained/index.php/EU_labour_force_survey_-_ad_hoc_modules, the New Immigrant Survey (US Immigration and Naturalization Service), http://nis.princeton.edu/index.html, the Longitudinal Immigration Database (Statistics Canada), www23.statcan.gc.ca/imdb/p2SV.pl?Function=getSurvey&SDDS=5057 and Characteristics of Recent Migrants (Australian Bureau of Statistics), www.abs.gov.au/ausstats/[email protected]/mf/6250.0.
If one limits the analysis to recent migrants, i.e. those who arrived within the five preceding years, family migrants in European OECD countries and Canada notably tend to be significantly younger than recent labour migrants (Figure 3.19). There is also some evidence of an ageing of recent family migrants between 2008 and 2014, in European OECD countries as well as in Canada. This trend could be due, among other things, to changes in migration policies towards more selective economic migration and more stringent conditions for family reunification.
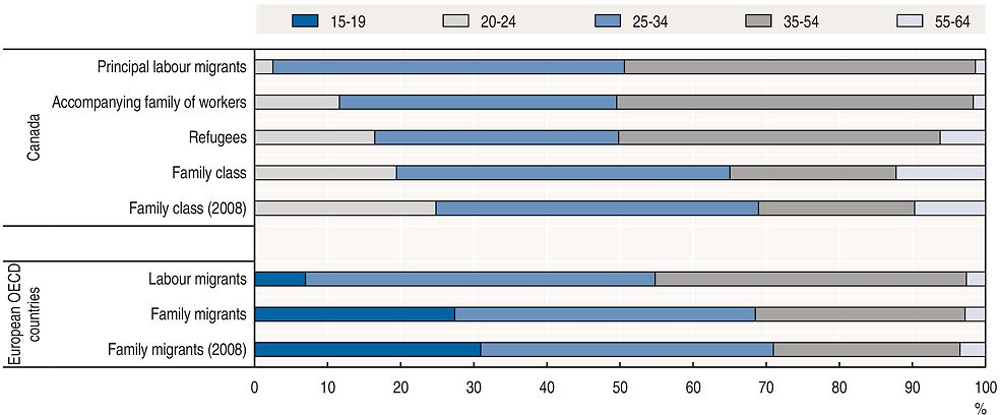
Note: Migrants are considered recent if they have arrived within the preceding five years. Family migrants include adult migrants who arrived as children. Sample sizes are not sufficient to obtain results for international students or refugees in European OECD countries. For Canada, the 2014 figures refer to the 2010 cohort and the 2008 figures refer to the 2004 cohort.
Source: European Labour Force Survey (Eurostat) ad-hoc module 2014 on the labour market situation of migrants and their immediate descendants, http://ec.europa.eu/eurostat/statistics-explained/index.php/EU_labour_force_survey_-_ad_hoc_modules, Longitudinal Immigration Database (Statistics Canada), www23.statcan.gc.ca/imdb/p2SV.pl?Function=getSurvey&SDDS=5057.
In the case of the United States, as reported by Jasso (2011), migrants who entered as spouses of US citizens are on average about 30 years old, which holds for spouses of native-born and foreign-born US citizens. The average age of spouses of permanent residents or humanitarian migrants is around 40 years. For spouses of labour migrants and spouses of diversity migrants, the average age falls in the middle of this range. A comparatively high average age – nearly 50 years – is observed for siblings of US citizens and their spouses.
Family migrants are likely to settle
In most European OECD countries, the majority of the family migrant stock has already spent 15 or more years continuously in the host country (Figure 3.20). This is notably the case in France and Germany but also in Baltic countries which host relatively large populations of persons born in other former Soviet Republics (OECD, 2015b). By contrast, in Italy, Luxembourg, Norway and Spain, comparatively low shares of family migrants having stayed for 20 years or more have the counterpart in comparatively high shares having stayed for up to 9 years. This composition reflects that family migration to these countries primarily occurred in recent years but may also reflect a lower tendency to settle.
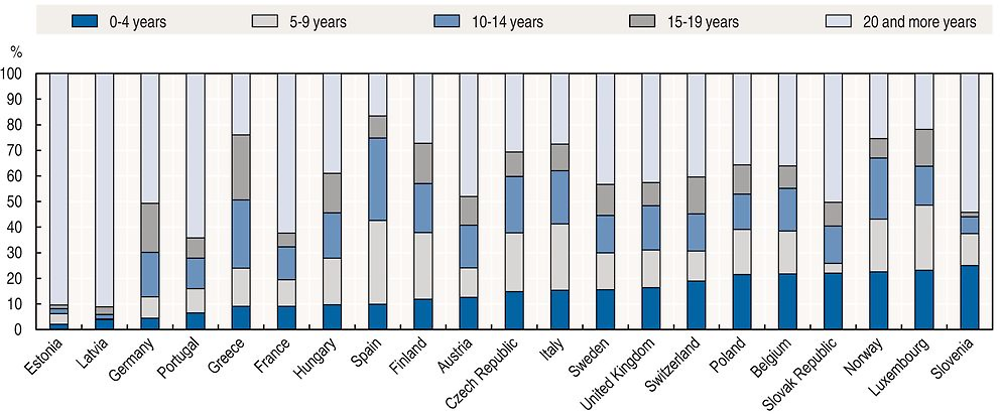
Note: Migrants who arrived as children are included.
Source: European Labour Force Survey (Eurostat) ad-hoc module 2014 on the labour market situation of migrants and their immediate descendants, http://ec.europa.eu/eurostat/statistics-explained/index.php/EU_labour_force_survey_-_ad_hoc_modules.
The educational attainment of family migrants was comparatively low but has improved
According to evidence for European OECD countries and the United States, the formal educational attainment of family migrants used to be low compared to migrants in other categories (Figure 3.21). In the United States, 40% of adult migrants in the family class had only a low education in 2003, a significantly higher share than observed for other migrant groups. At 25%, adult migrants in the family class had the lowest share of migrants with a tertiary diploma. In European OECD countries, close to half of all recent family migrants had a low education level in 2008, while only 20% were tertiary-educated.
However, the educational attainment of family migrants has improved significantly over recent years. Figure 3.21 shows this for European OECD countries: by 2014, the share of recent family migrants with a low education level had fallen to 40%, while the share with a high education level had risen to 32%. As a result, the stock of recent family migrants observed in European OECD countries in 2014 tended to have higher educational attainment than refugees.
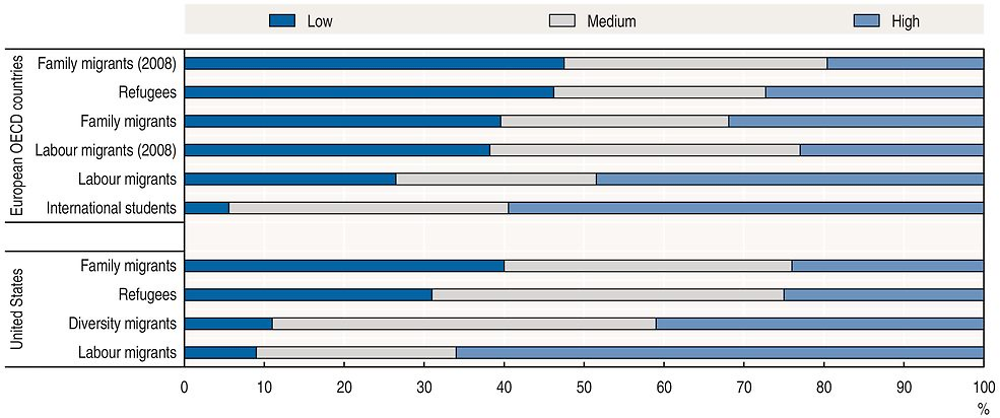
Note: Figures for family migrants in European OECD countries (2014) include adult migrants who arrived as children; all figures for migrants in European OECD countries are therefore limited to migrants who arrived within the five preceding years. Figures for family migrants in the United States refer to the family class (2003) and do not include family members of labour migrants, diversity migrants or refugees. The age ranges are 15-64 for European countries and 18 and older for the United States.
Source: European Labour Force Survey (Eurostat) ad hoc module 2008 and 2014 on the labour market situation of migrants and their immediate descendants, http://ec.europa.eu/eurostat/statistics-explained/index.php/EU_labour_force_survey_-_ad_hoc_modules and the New Immigrant Survey (US Immigration and Naturalization Service), http://nis.princeton.edu/index.html.
Figure 3.22 takes a closer look at the change in educational composition in the population of recent family migrants in European OECD countries. It shows that this change derived primarily from a change in the educational attainment of female family migrants: a sharp increase in the share with a high education level and a sharp decrease in the share with a low education level. The improvement in the educational attainment of recent female labour migrants has been more pronounced than among native-born persons over the same period, but Figure 3.22 shows an even more marked improvement over time for recent labour migrants.
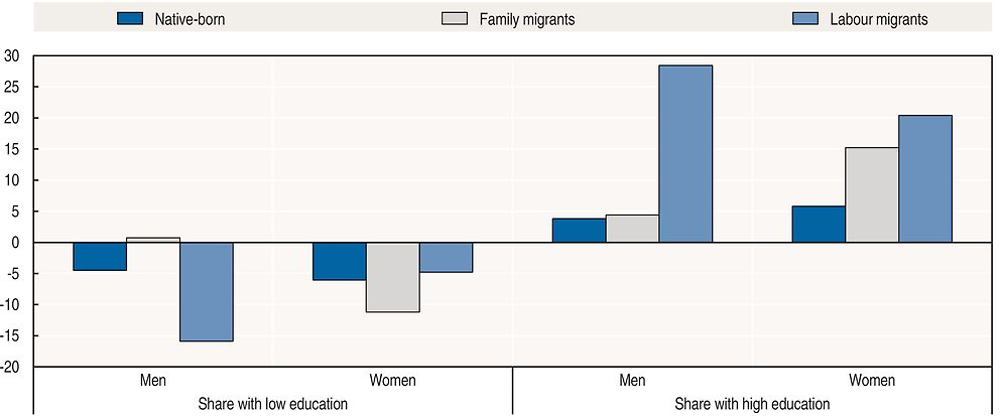
Note: Figures for family migrants include adult migrants who arrived as children; all figures for migrants are therefore limited to migrants who arrived within the five preceding years. Data were unavailable for Denmark, Ireland and the Netherlands. In addition, the 2008 data do not include Finland, and family migrants cannot be identified outside the EU 15 countries. Due to the small number of migrants living in the new EU member states in 2008, results should be by and large unaffected.
Source: European Labour Force Survey (Eurostat) ad-hoc module 2008 and 2014 on the labour market situation of migrants and their immediate descendants, http://ec.europa.eu/eurostat/statistics-explained/index.php/EU_labour_force_survey_-_ad_hoc_modules.
An overall improvement in the educational attainment of family migrants was also observed in Australia (Figure 3.23). In 2007, family migrants still exhibited a significantly lower educational attainment than labour migrants. By 2013, the educational attainment of family migrants and labour migrants was virtually the same. While the educational attainment of labour migrants has improved, that of family migrants has improved more strongly.
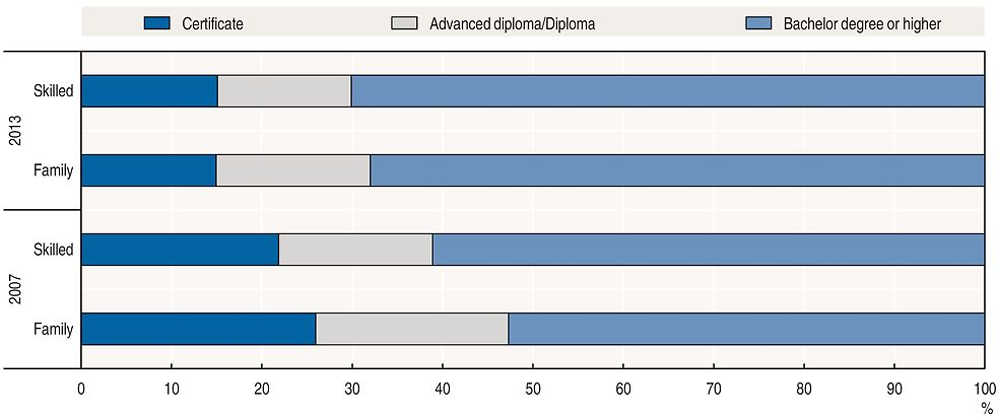
Note: Figures refer to recent permanent migrants not including citizens of New Zealand and indicate the highest non-school qualification obtained prior to arrival.
Source: Characteristics of Recent Migrants (Australian Bureau of Statistics), www.abs.gov.au/ausstats/[email protected]/mf/6250.0.
The improvements observed in Australia reflect an increasing tendency towards highly skilled labour migration that is observed in many OECD countries. This development may have raised the educational attainment especially of accompanying family migrants: the spouses and partners of highly educated labour migrants are often highly educated themselves, a phenomenon known as assortative matching (e.g. Mare, 1991). Aydemir (2011) reports evidence that such a mechanism changed the educational attainment observed in family migration flows to Canada.
Family migrants’ education is related to that of the spouse and differs across subcategories
The heterogeneity of family migrants that this chapter documents in several respects also extends to family migrants’ educational attainment. Estimated results for European OECD countries in Figure 3.24 suggest that accompanying family migrants and those who form a married couple with native-born persons tend to possess higher educational attainment than family migrants in other subcategories.
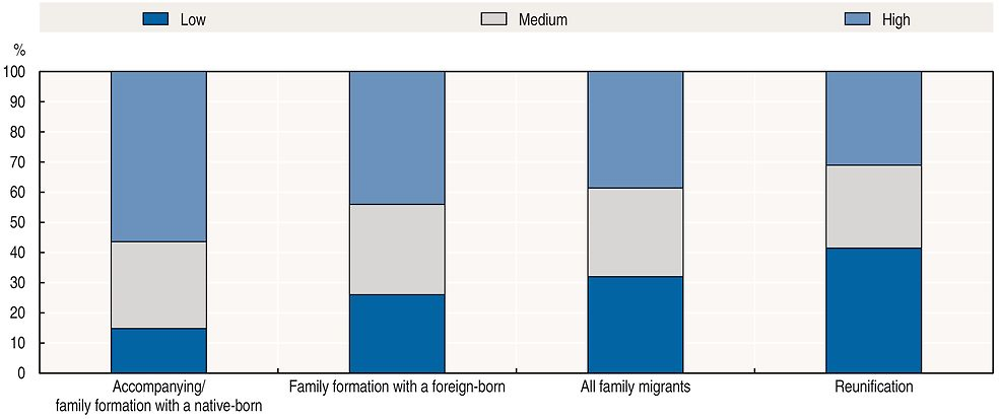
Note: Migrants are considered recent if they have arrived within the preceding five years. Family migrants (here only spouses) joining the principal migrant within five years of the principal migrant’s arrival in the host country are counted towards family reunification, while those joining later are counted towards family formation with a foreign-born. Data were unavailable for Denmark, Germany, Ireland and the Netherlands.
Source: European Labour Force Survey (Eurostat) ad-hoc module 2014 on the labour market situation of migrants and their immediate descendants, http://ec.europa.eu/eurostat/statistics-explained/index.php/EU_labour_force_survey_-_ad_hoc_modules.
In this group, the share with a high education level reaches 56%, while less than 15% have a low education level. Among family migrants who form a married couple with foreign-born persons, the share with a high education level is estimated to be substantially smaller (44%) while the share with a low education is estimated to reach one-quarter. Educational attainment tends to be lowest among reunifying spouses, according to these estimates: the estimated share of reunifying spouses with a low education level (42%) substantially exceeds the estimated share with a high education level (31%).
Earlier indications that family migrants’ education levels may reflect those of their spouse are supported by estimated results shown in Figure 3.25. Such assortative matching appears to be especially pronounced for accompanying family and those who form a married couple with a native-born person: close to 60% of family migrants in this subcategory exhibit the same level of educational attainment as their spouse. The corresponding shares are estimated to be only somewhat lower (54%) in the family reunification subcategory. Family migrants who form a couple with a foreign-born person, however, often have a lower educational attainment than their spouse.
Corresponding results for Canada in 2011 are reported by Bonikowska and Hou (2017). They find that women accompanying economic migrants tended to have higher education levels than married women admitted in the family class, reflecting an especially high degree of educational assortative matching between economic migrants and their accompanying spouses.
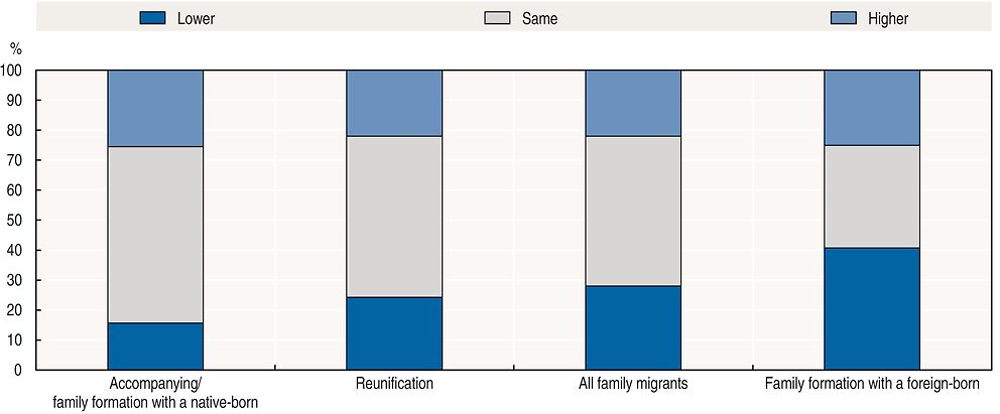
Note: Migrants are considered recent if they have arrived within the preceding five years. Family migrants (here only spouses) joining the principal migrant within five years of the principal migrant’s arrival in the host country are counted towards family reunification, while those joining later are counted towards family formation with a foreign-born. Data were unavailable for Denmark, Germany, Ireland and the Netherlands.
Source: European Labour Force Survey (Eurostat) ad-hoc module 2014 on the labour market situation of migrants and their immediate descendants, http://ec.europa.eu/eurostat/statistics-explained/index.php/EU_labour_force_survey_-_ad_hoc_modules.
Figure 3.26 compares native-born men in mixed couples to native-born men in non-mixed couples, and likewise for native-born women. Results for European OECD countries hardly differ between men and women: they indicate that native-born persons married to a foreign-born person have higher educational attainment than native-born persons married to another native-born person. This tendency applies roughly equally in the case of a spouse born outside of the European Union as in the case of an EU-born spouse. However, these results are at least partly driven by particular age groups: younger age groups not only tend to have higher formal education levels, but are also often more mobile, which raises the likelihood of meeting a spouse from abroad. This suggests a correlation between educational attainment and the probability to be in a mixed couple.
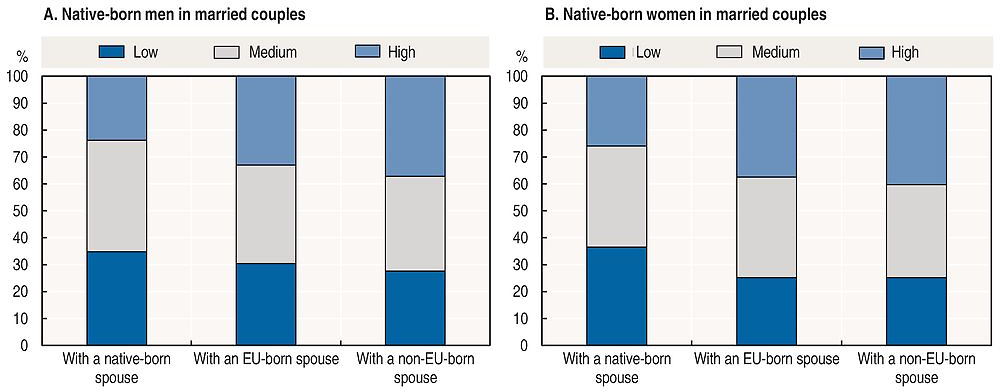
Note: The identification strategy required the exclusion of same-sex couples from the analysis. Data were unavailable for Denmark, Germany, Ireland and the Netherlands.
Source: European Labour Force Survey (Eurostat) ad-hoc module 2014 on the labour market situation of migrants and their immediate descendants, http://ec.europa.eu/eurostat/statistics-explained/index.php/EU_labour_force_survey_-_ad_hoc_modules.
The language skills of family migrants are initially poor compared with those of labour migrants
As shown in Figure 3.27, the share of persons who are found to have or declare to have advanced abilities in the host-country language (including both English and French in the case of Canada) is almost always lower for family migrants than for labour migrants. Within the group of family migrants, spouses or partners of citizens of the host country as well as family members of labour migrants exhibit relatively high shares with advanced language skills.
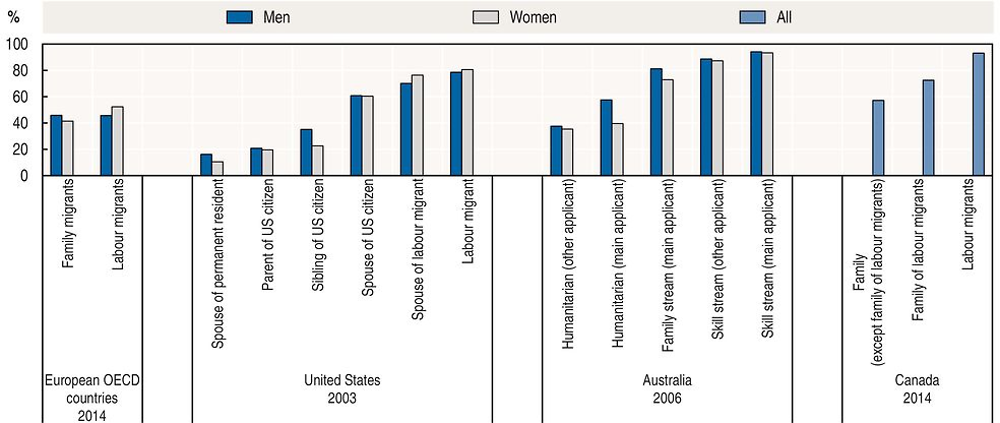
Note: Migrants are considered to have language skills where they self-declare them to be good or very good, where their abilities are labelled as advanced/native or where the interview was entirely held in the language in question. Figures for family migrants in European OECD countries refer to recent migrants only, i.e. those who arrived within the preceding five years. Figures for family migrants in the United States refer to the family class and do not include family members of labour migrants, diversity migrants or refugees. Figures for European OECD countries refer to persons aged 15-64, those for Australia refer to persons aged 35 and above and those for the United States refer to persons aged 18 and above.
Source: European Labour Force Survey (Eurostat) ad-hoc module 2014 on the labour market situation of migrants and their immediate descendants, http://ec.europa.eu/eurostat/statistics-explained/index.php/EU_labour_force_survey_-_ad_hoc_modules, the New Immigrant Survey (US Immigration and Naturalization Service), http://nis.princeton.edu/index.html, the Statistical Longitudinal Census Dataset (Australian Bureau of Statistics) and Facts and Figures 2014 (Citizenship and Immigration Canada), www.cic.gc.ca/english/resources/statistics/menufact.asp.
Figure 3.28 provides information on abilities in the host-country language for more detailed groups of family migrants. Drawing on data from the United States, it shows a considerable heterogeneity of language abilities across groups. For example, advanced abilities are substantially more frequent among spouses of native-born US citizens than among spouses of foreign-born US citizens. While only some migrants who entered as parents of US citizens possess advanced abilities, minor children of US citizens frequently speak quite good English. With the exception of spouses of labour migrants, fewer women than men appear to possess advanced abilities in the host-country language. Since the most recent data available for the United States refer to a cohort which acquired legal permanent residence in 2003, and taking into account the evolution observed in other parts of the OECD, it is likely that the language abilities of recently arrived family migrants in the United States have improved for most categories.
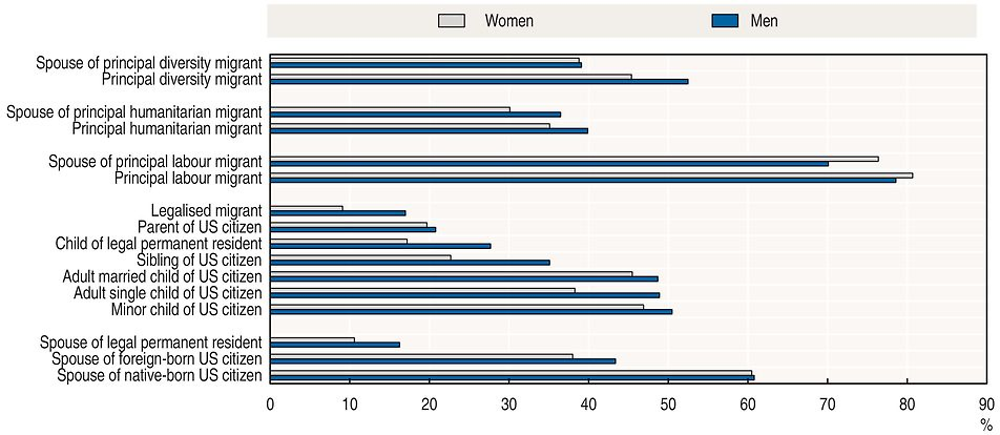
Note: Migrants are considered fluent in English when the interview was entirely held in English.
Source: Table 4 in G. Jasso (2011).
While citizens of a country in the European Union do not need residence permits to move to another EU country, such migration might nevertheless be motivated by family reasons. Figure 3.29 shows the self-declared reason for migration given by EU citizens in 2014 who had recently moved to an EU country that was not their country of birth. As indicated previously, the results suggest that about 30% of the free-movement flows within the European Union can be attributed to family reasons, and this share is especially high in Spain, and the Czech Republic, but especially low among the large number of recent EU migrants in the United Kingdom.
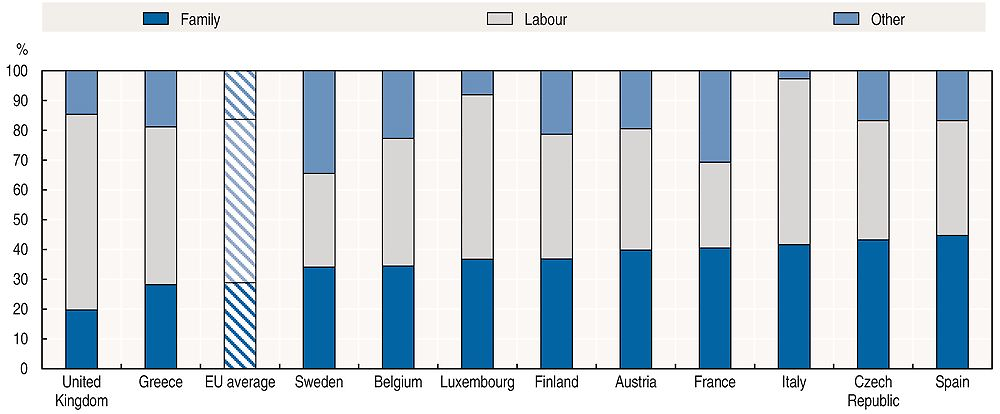
Note: Only EU citizens are included. Migrants are considered recent if they have arrived within the preceding five years. Family migrants include adult migrants who arrived as children. The EU average does not include Denmark, Germany, Ireland and the Netherlands.
Source: European Labour Force Survey (Eurostat) ad-hoc module 2014 on the labour market situation of migrants and their immediate descendants, http://ec.europa.eu/eurostat/statistics-explained/index.php/EU_labour_force_survey_-_ad_hoc_modules.
The importance of family-related migration compared with other migration motives in intra-European migration as captured by the European Labour Force Survey raises the question to what extent this group exhibits the same characteristics as other intra-European migration groups.
Such comparisons indicate that the share of women is also much higher among family-related EU migrants (61%) than among employment-related EU migrants (42%). The gap is lower, however, than between non-EU family migrants and non-EU labour migrants (61% compared with 36%). The comparison in terms of age of recent migrants shows that differences between family-related and employment-related EU migrants are also smaller: the share aged below 35 years is roughly the same in both cases, and the share of recent family-related EU migrants under 25 years is about twice as large as the corresponding share among recent employment-related EU migrants.
In terms of education, recent family-related and employment-related EU migrants also appear more similar than recent non-EU family migrants and non-EU labour migrants. Almost 24% of recent family-related EU migrants only have a low education level, compared to 17% of recent employment-related EU migrants (compared to 40% vs. 26% for non-EU migrants). The same holds for the share of tertiary-educated as family-related EU migrants and employment-related EU migrants exhibit about the same share with a high education level (36% and 39%, respectively), while this share differs considerably between non‐EU family migrants (32%) and non-EU labour migrants (48%).
In conclusion, family-related EU migrants do not differ as much from other migrants as non-EU family migrants, but both have in common that they are comparatively young and that women account for a clear majority.
The labour market integration of family migrants is slow
Evidence from across OECD countries shows that employment rates of family migrants are – at least in the first years after their arrival – comparatively low. Their employment rates generally improve over time but often take many years to reach the employment rates observed for other migrant categories or for native-born persons.
Drawing on data for the United States, Figure 3.30 shows such dynamics for a cohort of migrants who became legal permanent residents within a specific two-year period. When they were first interviewed in 2003, employment rates of labour migrants’ family members, diversity migrants’ family members, and siblings of US citizens were all below the employment rates of principal labour migrants and principal diversity migrants, among men and women alike. Only spouses who entered in the family class – typically spouses of US citizens – exhibited employment rates at or above the level of principal diversity migrants, but still well below the employment rates of principal labour migrants.
Four to six years after arrival, the information on labour force status was again collected for the same migrants. By this time, the employment rates of male and female family migrants had increased across the board, except for male spouses who entered in the family class. The increase was particularly marked for those who started with a low employment rate in 2003. However, over the same period, employment rates of principal diversity migrants also increased substantially.
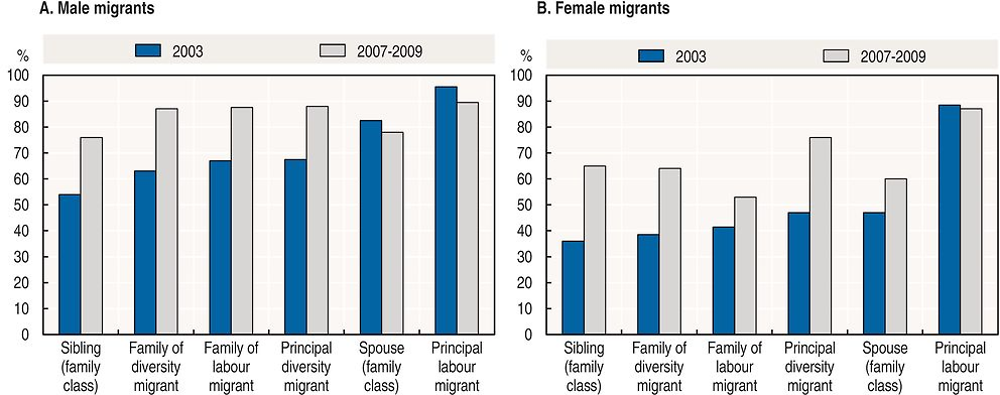
Note: Figures refer to the cohort of migrants who became lawful permanent residents in May-November 2003.
Source: The New Immigrant Survey (US Immigration and Naturalization Service), http://nis.princeton.edu/index.html.
Similar results are found for New Zealand where the Longitudinal Immigrant Survey tracked the situation of migrants who were approved for permanent residence between November 2004 and October 2005. The employment rates (around 70%) of family members of labour migrants as well as migrants in the category of spouses and partners were initially considerably below those of principal labour migrants (around 94%). Both rates increased over time but were still below the employment rate of principal labour migrants three years after arrival.9
Corresponding analyses can be performed for European OECD countries, Australia and Canada, but the available data take a different form: at only one point in time, employment rates are observed for migrants with different durations of stay. This introduces the possibility that differences in employment rates reflect differences between the characteristics of migrant cohorts. However, the qualitative results for European OECD countries as well as for Australia and Canada fully align with previous results based on longitudinal data which cannot possibly be affected by differences between cohorts.
In Australia, the employment rates of recent family migrants were just two-thirds of recent labour migrants’ employment rates (51% compared with 74%, as shown in Figure 3.31, Panel A). While employment rates of family migrants then appear to rise faster than those of labour migrants, a substantial gap remains after more than ten years. The evidence for Canada (Panel B) likewise shows that employment rates of family migrants are initially considerably lower than those of principal labour migrants and remain significantly lower 10 years after arrival. Employment rates of spouses and partners who entered in the family class are initially above the employment rates of labour migrants’ family members, but the gap with the latter slowly closes with duration of stay. By and large, the employment rates of labour migrants’ family members in Canada evolve similarly to those of refugees.
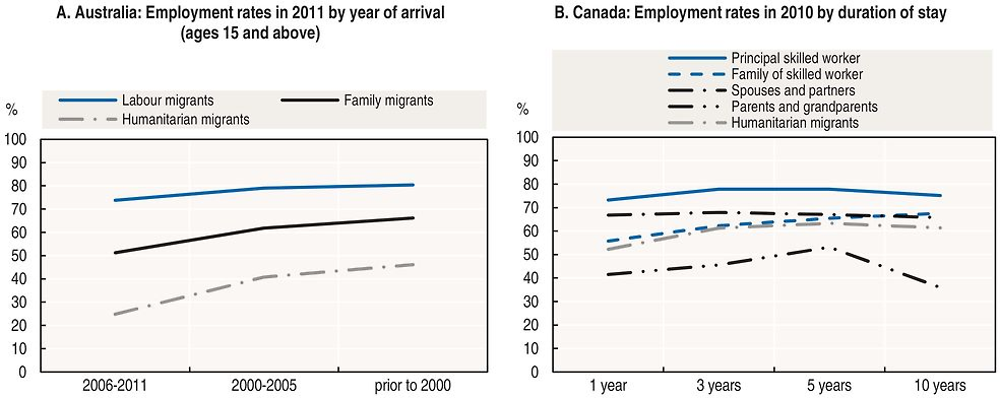
Note: In the figures on Australia, the arrival period 2006-11 ends in August 2011. Figures for Canada refer to percentages where employment earnings were observed. Refugees and accompanying family of workers in Canada include adult migrants who arrived as children.
Source: “Understanding Migrant Outcomes – Enhancing the Value of Census Data” (Australian Bureau of Statistics), www.abs.gov.au/ausstats/[email protected]/mf/3417.0 and Longitudinal Immigration Database (Statistics Canada), www23.statcan.gc.ca/imdb/p2SV.pl?Function= getSurvey&SDDS=5057.
Figure 3.32 shows the evidence for European OECD countries in 2014. To account for the gender differences in employment rates highlighted above, employment rates are reported separately for male and female migrants and they are indexed to the employment rate of native-born persons of the same gender. Roughly similar patterns emerge for male and female migrants in European OECD countries. The employment rates of female family migrants are initially less than half as high as those of native-born women (Figure 3.32, Panel B). With duration of stay, they appear to rise and after 15-19 years approach parity with native-born women but not with female labour migrants and former international students. Given that the increase in employment rates after such long durations of stay partly reflects the labour market entry of female migrants who arrived as children, the labour market integration of female migrants who arrived as adult family migrants likely proceeds slowly.
Male family migrants in European OECD countries initially exhibit employment rates corresponding to three-quarters of the employment rates of native-born men (Figure 3.32, Panel A). They appear to remain at about this level for more than a decade, but rise significantly thereafter and exceed the employment rates of native-born men after 20 or more years. However, these late increases could again be the result of men who arrived as children entering the labour market. While the gap between male family migrants on the one hand and male labour migrants or international students on the other hand is smaller than for women, it remains substantial and only fully disappears after 20 years.
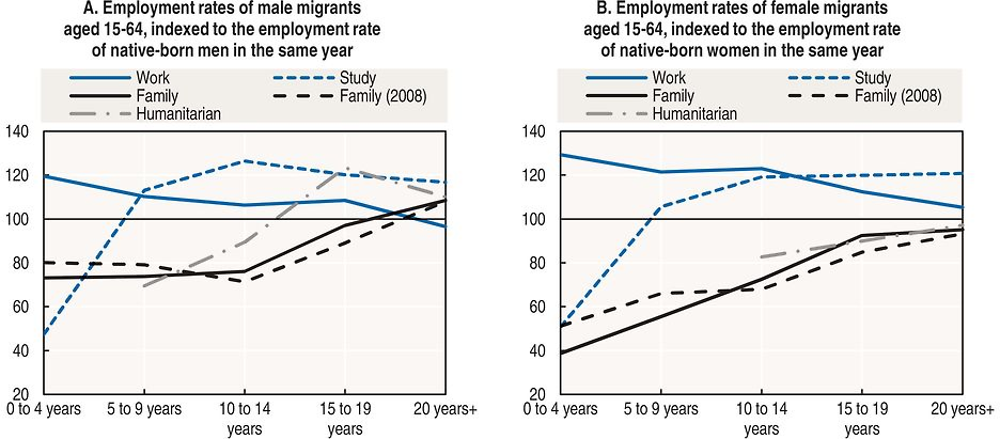
Note: Figures refer to average employment rates calculated for all migrants in the same category across most European OECD countries, indexed to an average calculated for all native-born in these countries. Data were unavailable for Denmark, Ireland and the Netherlands, and 2008 data were unavailable for Finland. Family migrants include adult migrants who arrived as children. Sample sizes are insufficient for all refugees with 0-4 years of stay and for female refugees with 5-9 years of stay.
Source: European Labour Force Survey (Eurostat) ad-hoc modules 2008 and 2014 on the labour market situation of migrants and their immediate descendants, http://ec.europa.eu/eurostat/statistics-explained/index.php/EU_labour_force_survey_-_ad_hoc_modules.
When male and female migrants are considered together, sample sizes are sufficient to show separate results for some European OECD countries (Figure 3.33). In France, Italy and Spain, employment rates of family migrants initially are only about 40% of employment rates for native-born persons; a substantially higher initial employment rate (about 55% of the employment rate of native-born persons) is only observed in the United Kingdom. As duration of stay increases, the evolution of family migrants’ employment rates diverges across countries. Some of these differences are, however, most likely due to differences between cohorts of family migrants across countries. Corresponding results for Norway have recently been obtained by Bratsberg et al. (2017).
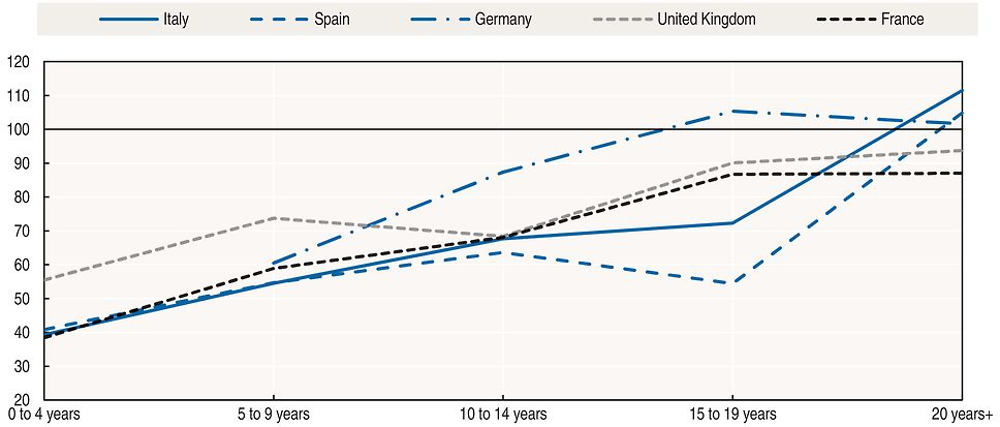
Note: Family migrants include adult migrants who arrived as children. Sample sizes are insufficient for family migrants in Germany with 0-4 years of stay.
Source: European Labour Force Survey (Eurostat) ad-hoc module 2014 on the labour market situation of migrants and their immediate descendants, http://ec.europa.eu/eurostat/statistics-explained/index.php/EU_labour_force_survey_-_ad_hoc_modules.
Finally, Figure 3.34 draws on recent Australian data to decompose employment rates by the skill level of employment. This provides a first look at how the quality of family migrants’ employment evolves with duration of stay, an aspect not captured by simple employment rates. While more than 60% of labour migrants in Australia’s skill stream are employed in high-skill jobs six months after arrival, only 22% of family migrants are similarly employed (counting only spouses and partners in the family stream). One-quarter of family migrants work in medium-skill jobs and one-eighth in low-skill jobs; both shares exceed the corresponding shares for labour migrants. Over the following year, the share of labour migrants in medium- or low-skill jobs falls, while that in high-skill jobs increases by 5 percentage points. By contrast, shares of family migrants increase in jobs at every skill level, by around 2 percentage points each. Further results for longer durations of stay and for other countries would however be needed to draw a general conclusion.
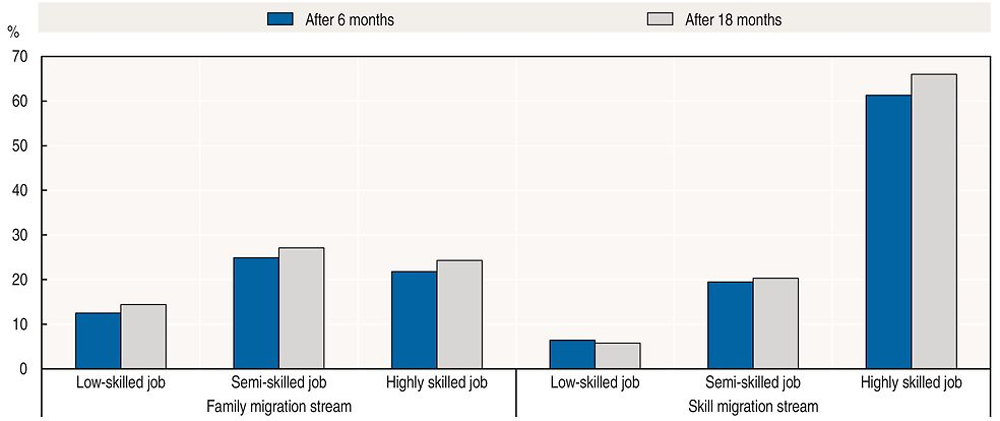
Note: Figures for the family stream only refer to spouses and partners.
Source: National sources.
The comparatively slow labour market integration of family migrants likely results from a variety of factors. As indicated in the previous section, family migrants are very heterogeneous across subcategories in terms of human capital, notably formal education and language skills. These are key determinants, however, of short and longer term labour market outcomes and explain a significant part of the observed lower outcomes of family migrants compared to other migrant groups. Furthermore, in contrast to many labour migrants, there is no pre-arranged job awaiting family migrants upon arrival. Instead, where the principal migrant is a labour migrant, family migrants might be less compelled to seek their own income from employment.
Other factors not specific to family migrants may nonetheless have a stronger effect on their labour market outcomes than on those of native-born persons or migrants in other categories. For example, family migrants include many comparatively young adults as well as older persons who enter as parents or grandparents. For both groups, low employment rates are often also found in other contexts, compared with the employment rates of persons of prime working age (25-54 years). Family migrants might choose not to participate in the labour market of the host country but rather raise children or care for other family members. Survey results reported by Khoo et al. (2013) and Büttner and Stichs (2013) indicate that, among female family migrants in Australia and Germany, for example, caring for children is the main reason not to work.
Such dynamics within couples and households are likely an important contributor to the slow labour market integration of family migrants. When planning to migrate to a particular country, couples likely divide roles such that the person who has higher chances to be admitted as a labour migrant, international student, or refugee assumes the role of principal migrant. In many cases, this means that the principal migrant is either more employable in the host country or more willing to supply labour than the other partner in the couple. This unobserved selection might bias the observed labour market outcomes substantially.
Key challenges for the management of family migration going forward
In light of the magnitude of family migration and its implications, this section discusses a number of current and emerging challenges in the management of family migration faced by policy makers in OECD countries. One is how to anticipate the levels of family migration flows. Another is how to balance rules for family migration against the need for countries to remain attractive to targeted labour migrants. A further issue is how to use conditions for family migrants to accelerate their integration. Finally, there is growing concern about how to deal with unaccompanied minors.
Anticipating numbers of family migrants
Family reunification, by definition, adds a multiplier effect to other migrant categories, so that admitting a principal applicant or granting residence on humanitarian grounds can lead to sponsorship of additional migrants. It is possible to observe family reunification patterns among migrants who have the right to sponsor family members. Most family reunification occurs in the first five years of residence, and most migrants bring at least one family member. That said, it is difficult to quantify across migrant categories and characteristics, or to produce a single multiplier. Migrant characteristics differ across categories and migrant behaviour in terms of staying and reuniting with the family may change over time. For example, not all single migrants will bring foreign spouses – some will form families with residents. More generally marriage and fertility behaviour are subject to structural changes in many origin and destination countries, while family units tend to become increasingly heterogeneous and complex.
A better understanding of likely future family migration inflows would be useful, both for programme management and in developing associated longer-term policy measures for integration. Anticipating flows can indicate where human resources may have to be devoted for processing applications – to avoid or manage backlogs – or to assess eligibility. Similarly, in light of the characteristics of family migrants of different sponsor categories, associated integration measures can be foreseen.
In countries where migration targets by category are used, a multiplier effect may be built into the planning range for economic migrants. The United States, Canada and Australia, for example, include spouses and dependants (minor children, in most cases) in their permanent economic migration caps and targets. The proportion of accompanying family within the category ranges from 50% to 60%, providing an implicit estimation of the multiplier effect of admission used by these countries in these categories. This is actually in the range identified in academic studies applied to the US context (Jasso and Rosenzweig, 1986 and 1989).
Destinations have, however, some control over this so-called “immigration multiplier effect” as they can impose limits and restrictions, at least for some subcategories of family migrants. Depending on the rights framework, family reunification or formation for spouses and children of nationals and even foreigners may be a guaranteed right, but other categories may have to wait. Indeed, where family migration is subject to numerical limits, backlogs may form as family members wait in line.10 Trying to control family migration by reducing rights or delaying the migration process can, however, have significant unintended consequences.
A further mechanism to govern migration of family members who are still abroad is to grant extended visiting rights without a right to benefits, employment or residence. This may represent a means to include family categories (such as grandparents) who are otherwise not included in the family reunification categories. The Canadian "super visa" for grandparents, which allows up to two years of stay, is one recent example.
Using family migration policies to attract and retain labour migrants
Foreign spouses of migrants, whether accompanying, reunifying or forming a family, tend to have education characteristics which mirror those of their sponsor. In practice, this means that family migration amplifies the skill contribution of labour migration.11
This chapter has shown how many OECD countries impose limits on foreigners’ ability to sponsor family members, primarily through required residency periods but also often through income and accommodation requirements. This restriction reflects an interest in preventing families from living in poverty or substandard conditions, and ensuring that economic migrants, or family members of other migrants, are not benefit-dependent. Just as incentives to remain are important for sought-after economic migrants, the incentive to leave – to return home to one’s family – may also be a policy goal in programmes for temporary workers, or in selective migration programmes where the temporary permit period is a test period during which the migrants must demonstrate the ability to support themselves. Once family migrants are admitted, their labour market access is, in many countries, subject to occupational restrictions, conditioned on authorisation, or only granted after a period of stay in the country.
Restrictions may have a deterrent effect on the ability to attract high skilled migrant workers. Highly-qualified labour migrants today increasingly have similarly qualified spouses and constitute dual-career families. The prospect of the spouse being locked out of the labour market can have a negative effect on the ability to attract and retain skilled primary applicants. Indeed, policy makers have identified restrictions on family reunification and on the rights of spouses to work as a disincentive for potential migrants to come and work. OECD countries are competing to offer favourable conditions to economic migrants who bring skills that are seen as needed. Strict limits on the ability to bring family members, or for these family members to be employed, have been eased for highly-qualified migrants in most cases (see for example, Strik et al., 2013). This was the objective of the EU Blue Card, which for many EU countries meant the introduction of accompanying family rights for the first time (OECD, 2016a). Nonetheless, in most cases, the spouses of skilled labour migrants in EU countries already enjoyed labour market access, and the EU Family Reunification Directive requires labour market access to be granted within 12 months of arrival.
Spousal employment is also important for retention, since economic migrants whose spouses work are more likely to stay. In the Netherlands, the probability of highly skilled labour migrants staying five years after arrival is 18 percentage points higher if the spouse is working rather than inactive or unemployed (OECD, 2016b). In Norway, labour migrants with an inactive partner are more likely to leave the country than those with an employed partner, no matter the country of origin and the gender of the principal migrant. For men, for example, retention was almost twice as high when the spouse was working (OECD, 2014).
In settlement countries, permanent residence is granted to the principal applicant along with dependents, all of whom enjoy full labour market access. In other countries, where initial permits are almost only available for a fixed period, albeit renewable, the clear trend has been to lift restrictions on spousal employment for more highly qualified economic migrants. One example is Japan, which lifts all restrictions on labour market access for the spouses of its Highly Skilled Foreign Professionals, while the spouses of other skilled workers must qualify for a work visa.
Even OECD countries where dependants of temporary skilled workers have long been denied labour market access are now opening provisions to concede access. This was the case in the United States, for example, where H-4 visa holders – spouses of H-1B visa holders – were not allowed to work. In 2015, those whose sponsors have applied for legal permanent residence – the wait for some principal applicants may be ten or twelve years – were allowed to apply for employment authorisation, although this provision is under review. Similarly, Israel does not normally allow dependents of B-1 foreign experts to work, but approved a provision in 2017 to allow employment authorisation for dependants of certain workers. In both cases, this was done to attract highly skilled foreign workers; in the United States, it was also meant to improve retention of such workers.
The spouses of highly qualified labour migrants, despite their education level, may still struggle in the labour market. In Norway, for example, the potential of the spouses of labour migrants is not fully utilised, especially in the case of spouses of labour migrants from non-EU countries: although two-thirds had university education, less than half were employed in 2012 (OECD, 2014). In all countries, barriers to labour market access may take the form of formal restrictions but may also lie in language barriers or the difficulty of spouses to access local opportunities and networks. Few active policies for the spouses of labour migrants are in place, especially for the spouses of highly-qualified labour migrants, and publicly subsidised integration programmes offered to other migrants may not be available or cost-free for spouses or other dependants of economic migrants, on the principle that this category should be able to address its own needs without recourse to public assistance.
There is a clear trade-off in according different family reunification rights to different groups of labour migrants. The need to ensure temporary stay, to ensure that all families are able to enjoy a minimum standard of living and to limit the multiplier effect of family migration, may have to be weighed against the stabilising factor of the presence of the family for temporary migrants and the overall attractiveness of the country for foreign skills.
Using conditions on family migrants to accelerate their integration
Conditions on admission of family migrants are usually introduced because of a concern about their integration. There are a number of options. Income requirements can be defined according to the objective standards used in assessing minimum wage, eligibility for social benefits or other financial benchmarks, and housing requirements can refer to health and safety standards. For other conditions such as language and civic integration requirements, benchmarks are difficult to set. Language requirements, either prior to arrival or within a period after arrival, are both selection criteria and give an incentive to acquire competences which are demonstrably important for social and labour market integration. Integration contracts, such as those applied to family migrants in France and Italy, for example, include a commitment to attain a minimum level of knowledge of the national language, in order to obtain a more stable residence permit.
Some evidence suggests that language and civic integration requirements have a positive effect on abilities in the host-country language and on labour market outcomes. Based on survey responses from 2 500 adult family migrants who moved to Germany between 2005 and 2012, Büttner and Stichs (2013) document respondents’ self-declared German language abilities at arrival. The results suggest that those arriving after the introduction of a pre‐arrival language requirement in 2007 had considerably stronger German language abilities than those arriving before (Figure 3.35). In particular, the percentage without any notion of German (24%) was much lower than before the introduction of the requirement (60%). While about one-third of all family migrants considered the language requirement to be a heavy burden, according to further results of the same survey, almost 90% of those subject to the requirement considered it useful.
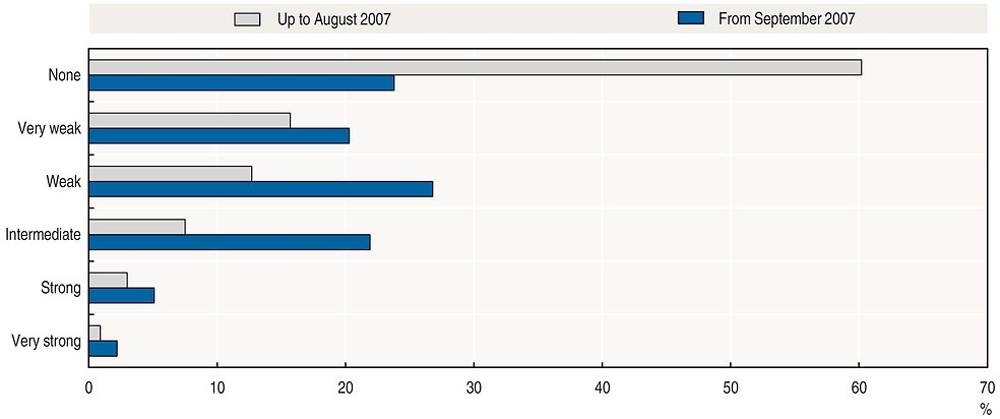
Note: Results are based on 2 481 observations on adult family migrants (spouses) who moved to Germany from non-EU countries (mainly from Turkey and the region of former Yugoslavia) in the period 2005-12.
Source: Büttner and Stichs, 2013.
Effects of the civic integration requirement in the Netherlands were examined by Witvliet et al. (2013). They conclude that passing the Dutch civic integration exam – which entails a post-arrival language requirement – had a significant positive effect on the probability of recent migrants to find employment in the Netherlands. The positive effects appear stronger for migrants with a lower level of education than for those with a high education level. For migrants who are already long-standing residents of the Netherlands, however, Witvliet et al. (2013) do not find a significant effect from passing the exam. This suggests that policy interventions targeting migrants’ language abilities might be more effective at an early stage of their integration process.
Language requirements do not generally apply to the family members of highly qualified migrants; indeed, Germany exempts the family of EU Blue Card holders from language requirements that apply to other family migrants, again on the assumption that the language requirements are an obstacle to attraction and that higher-income migrants are not a group at risk of exclusion. Similarly, the integration contract does not apply in France or Italy to the family members of highly-qualified migrants.
In settlement countries, the characteristics of family members are included in decisions to admit applicants; the points attributed to applicants in Canada and Australia, for example, include spousal characteristics as a potential boost to the applicant’s ranking. This favours families where the spouse also meets admission criteria. There are other possible policy measures to affect the skills profile of family migrants, including imposing financial penalties on family migrants who do not speak the language. Australia, for example, charges a one-time fee on family migrants who do not speak the language. This may encourage applicants to invest in English language skills, or partially off-set lower employment outcomes for migrants who do not speak English.
The need to ensure that families have sufficient means to live and are not at risk of exclusion has to be weighed against the principle of family unity and the benefits it brings to migrants. This is a frequent challenge involving high stakes, with tight conditions contested in court by individuals whose family reunification has been denied on the grounds, for example, of inadequate income. Minimum income requirements for families have traditionally been calculated on the basis of the income of the principal migrant or sponsor. During the economic crisis in Spain, however, foreign labour migrants who had lost their jobs often failed to reach the minimum requirements to keep their permit and that of their dependants; under these circumstances, overall household income – including that of dependants – was considered valid. Such an approach recognises the dual income nature of many families and the fact that household income, rather than individual income, determines the situation of families.
Dealing with unaccompanied minors represents a dilemma for family migration policy
The rapid increase in the number of unaccompanied minors puts strain on the systems of OECD countries designed to deal with only few cases. In 2015 and 2016, as many as 100 000 and 167 000 unaccompanied minors were received by the United States and the European Union, respectively. Unaccompanied minors require special treatment relative to adults, such as the appointment of guardians by the courts, access to education and health care, and the provision of residential facilities. School enrolment is particularly complex for unaccompanied minors, most of whom do not speak the language in the country of arrival and many of whom have missed years of schooling, if they have been able to attend school at all. The need to identify a guardian may in some cases be interpreted by courts as grounds for admitting a parent. The management of unaccompanied minors may overlap with the process of assessing claims for humanitarian protection. Unaccompanied minors also pose a challenge when they turn 18 years old and a decision must be made about the support to be offered; if they are not in the asylum process and have not received protection, a decision must be made about whether, where, to whom and how to return them. Age assessment is also a challenge, since the reliability of different methods continues to be contested.
Even prior to the spike in the number of unaccompanied minors in 2013-14, the question of unaccompanied minors was high on the policy agenda in many OECD countries, due to the high cost and complexity of these cases. In Europe, the increase in pressure on migration routes led to many more asylum applicants who were unaccompanied minors in 2015 (Figure 3.36, Panel A). In the United States, inflows of unaccompanied children encountered at the US-Mexico border increased from 2012, with the increase due to children from Central American countries who in most cases reported fleeing violence (Figure 3.36, Panel B).
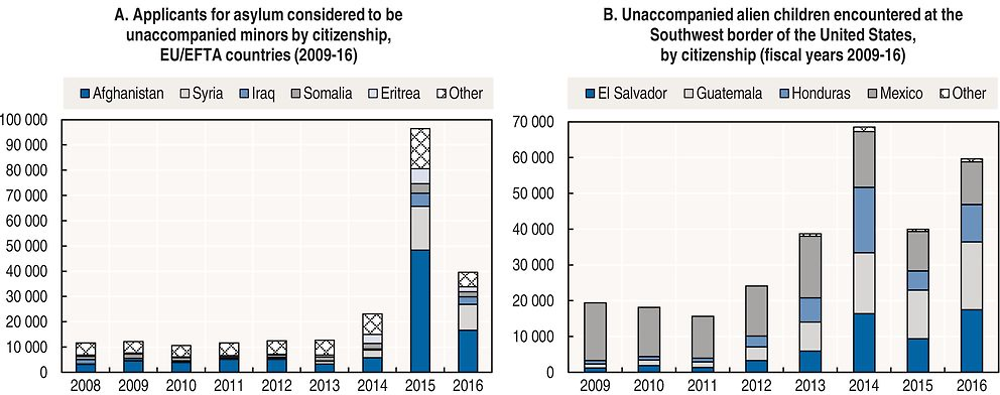
Note: Fiscal years in the United States begin on 1 October and end on 30 September.
Source: United States Border Patrol and Eurostat Residence Permit Data Collection, http://ec.europa.eu/eurostat/statistics-explained/index.php/Residence_permits_statistics.
In light of the special treatment to which they are subject, there is a concern that unaccompanied minors may increasingly be sent on dangerous irregular journeys, with the intent of acquiring residence and eventually establishing family immigration access for their closest relatives. One means to address the use of dangerous channels is to work with transit countries, another is to provide more information about the likely outcome of immigration procedures in the destination country. Such a dual approach led to a decline in 2015 of entries along the US-Mexico border (OECD, 2015a), although the numbers increased again in 2016. Restricting temporarily the right to family reunification for unaccompanied minors may be necessary during periods of large inflows to reduce the incentive to send minors ahead but it should be balanced against the challenge extremely vulnerable young people face when attempting to rebuild their life.
Conclusion
The management of family migration is becoming increasingly complex as it struggles to reconcile separate priorities and competing policy objectives – while family migration should be managed, a number of constraints limit the scope for such management. Nonetheless, it is important that OECD countries continue to improve the management of family migration.
This is important, first, because most migration is family migration. This chapter has shown that family migrants are the single largest category both in the inflow of permanent migrants (more than 1.6 million in 2015, but as much as 2 million if one includes intra-European movements for family reasons), and in the migrant populations residing in OECD countries (between 25 and 50% in most OECD countries).
Second, because family migration is linked to whether migrants stay permanently. For all migrants, having their families with them increases the likelihood of remaining, and family migrants’ duration of stay is typically long. Decisions taken on managing family migration today have important downstream effects on the size and composition of the foreign-born population in the future.
Third, this chapter has shown that family migrants do not do as well in terms of employment as other migrant groups. Inflows, however, can be managed to favour more successful integration outcomes through targeted conditions and support. Practical lessons for integration policies towards family migrants are presented in OECD (forthcoming 2017b).
Fourth, the family migration channel is available in all OECD countries and is grounded in a rights framework. Its availability can make it subject to abuse as a channel for entry for people who do not qualify, either through fraudulent representation of relationships or marriage fraud or through coerced marriages. This risk is not discussed in detail in this chapter, but remains a paramount concern in policy design.
There are, however, limits in the capacity of OECD countries to regulate family migration. As this chapter has shown, an important and in some cases increasing share of family migration is family formation with citizens of OECD countries. In these cases, restricting the entry of spouses is hardly possible legally, and even if possible might be difficult to implement politically.
The effect of restrictions on family reunification may be to only delay it rather than prevent it altogether. This is especially true for numerical limits, but may also apply to other mechanisms of governing family migration such as income requirements, “attachment requirements” or minimum residence periods. Incentives can be put in place to ensure that family migrants bring their children at the appropriate time instead of delaying reunification; they can also be used to encourage and reward investment in human capital. And given the importance of family ties, people who are unable to bring family members through family migration channels may resort to alternative channels such as tourist or student visas, or irregular channels.
Finally, limiting family migration can affect the ability of a country to attract the migrants it would like to draw, since the provision of favourable access and conditions for family migrants is one of the main policy variables in the international competition for highly skilled labour migrants. As noted above, this also concerns retention of labour migrants. Since the spouses of highly qualified migrants also tend to be qualified, there is an extra gain to be earned from attracting and retaining entire families.
With migration comes family! This is a simple fact of life with which many OECD countries seem to be struggling as family migration makes up an important and increasing share of overall migration movements. The information presented in this chapter will help dispel some of the most common myths associated with family migration and also identify the key policy trade-offs and bottlenecks that justify more proactive public policies in this area.
References
Aydemir, A. (2011), “Immigrant selection and short-term labor market outcomes by visa category”, Journal of Population Economics, Vol. 24, pp. 451-475, https://doi.org/10.1007/s00148-009-0285-0.
Bielby, W.T. and D.D. Bielby (1992), “I will follow him: Family ties, gender-role beliefs, and reluctance to relocate for a better job”, American Journal of Sociology, Vol. 97, pp. 1241-1267.
Bonikowska , A. and F. Hou (2017), “Labour Market Outcomes of Immigrant Women who Arrive as Dependants of Economic Immigrant Principal Applicants”, Statistics Canada, www.statcan.gc.ca/pub/11f0019m/11f0019m2017390-eng.htm.
Brandén, M. (2014), “Gender, gender ideology, and couples’ migration decisions”, Journal of Family Issues, Vol. 35, pp. 950-971, https://doi.org/10.1177/0192513X14522244.
Bratsberg, B., O. Raaum and K. Røed (2017), “Immigrant labor market integration across admission classes”, CReAM Discussion Paper, 2/2017, www.cream-migration.org/publ_uploads/CDP_02_17.pdf.
Büttner, T. and A. Stichs (2013), Die Integration von zugewanderten Ehegattinnen und Ehegatten in Deutschland, Federal Office for Migration and Refugees, Nuremberg, www.bamf.de/SharedDocs/Anlagen/DE/Publikationen/Forschungsberichte/fb22-heiratsmigration.pdf?__blob=publicationFile.
Chaloff, J. (2012), “The changing role of Asia in international migration”, in International Migration Outlook 2012, OECD Publishing, Paris, https://doi.org/10.1787/migr_outlook-2012-8-en.
Chiswick, B.R., Y.L. Lee and P.W. Miller (2006), “Immigrants’ Language Skills and Visa Category”, International Migration Review, Vol. 40, pp. 419-450, https://doi.org/10.1111/j.1747-7379.2006.00023.x.
Chung, C., K. Kim and N. Piper (2016), “Marriage migration in Southeast and East Asia revisited through a migration-development nexus lens”, Critical Asian Studies, Vol. 48, pp. 463-472, https://doi.org/10.1080/14672715.2016.1226600.
Cooke, T.J. (2008), “Migration in a family way”, Population, Space and Place, Vol. 14, pp. 255-265, https://doi.org/10.1002/psp.500.
Department of Health and Human Services (2016), “Planning for Adoption: Knowing the Costs and Resources”, Children’s Bureau factsheet for families, www.childwelfare.gov/pubPDFs/s_costs.pdf.
Department of Immigration and Citizenship (2011), “Trends in Migration: Australia 2010-11”, SOPEMI Report 2011.
Dumont, J.-C. et al. (2016), “International migration following environmental and geopolitical shocks: How can OECD countries respond?”, in International Migration Outlook 2016, OECD Publishing, Paris, https://doi.org/10.1787/migr_outlook-2016-7-en.
European Migration Network (EMN) (2017), “EMN Synthesis Report for the EMN Focussed Study 2016: Family Reunification of Third-Country Nationals in the EU plus Norway: National Practices”.
European Migration Network (EMN) (2012), “Marriages of convenience and false declarations of parenthood: Misuse of the right to family reunification”, European Commission, Brussels, https://doi.org/10.2837/80172.
Jasso, G. and M.R. Rosenzweig (1989), “Sponsors, Sponsorship Rates and the Immigration Multiplier”, International Migration Review, Vol. 23(4), pp. 856-88.
Jasso, G. and M.R. Rosenzweig (1986) “Family Reunification and the Immigration Multiplier: U.S. Immigration Law, Origin-Country Conditions, and the Reproduction of Immigrants”, Demography, Vol. 23(3), August 1986, pp. 291-311.
Jasso, G. (2011), “Migration and stratification”, Social Science Research, Vol. 40, pp. 1292-1336, https://doi.org/10.1016/j.ssresearch.2011.03.007.
Jefferys, K. and N. Rytina (2006), “U.S. Legal Permanent Residents: 2005”, Department of Homeland Security Annual Flow Report, www.dhs.gov/sites/default/files/publications/USLegalPermEst_5.pdf.
Junge, M., M. Munk and P. Poutvaara (2014), “International Migration of Couples”, IZA Discussion Paper No. 8352, http://ftp.iza.org/dp8352.pdf.
Khoo, S.-E., P. McDonald and B. Edgar (2013), “Contribution of Family Migration to Australia”, Report to the Department of Immigration and Citizenship, www.border.gov.au/ReportsandPublications/Documents/research/family-migration-contribution-january-2014.pdf.
Mare, R.D. (1991), “Five decades of educational assortative mating”, American Sociological Review, Vol. 56, pp. 15-32.
Mignot, J. F. (2015), “L’adoption internationale dans le monde: les raisons du déclin”, Population et Sociétés, No. 519, https://halshs.archives-ouvertes.fr/halshs-01326715/document.
Migration Advisory Committee (2011), “Review of the minimum income requirement for sponsorship under the family migration route”, www.gov.uk/government/uploads/system/uploads/attachment_data/file/257244/family-migration-route.pdf.
Nivalainen, S. (2004), “Determinants of family migration: short moves vs. long moves”, Journal of Population Economics, Vol. 17, pp. 157-175, https://doi.org/10.1007/s00148-003-0131-8.
OECD (forthcoming 2017a), Making Integration Work: Family Migrants, OECD Publishing, Paris.
OECD (forthcoming 2017b), “Migration and Gender”, OECD Publishing, Paris.
OECD (2016a), « What have EU labour migration Directives changed and how can they be improved? », in Recruiting Immigrant Workers: Europe 2016, OECD Publishing, Paris, https://doi.org/10.1787/9789264257290-7-en.
OECD (2016b), « Attracting and retaining skilled migrants and international students in the Netherlands », in Recruiting Immigrant Workers: The Netherlands 2016, OECD Publishing, Paris, https://doi.org/10.1787/9789264259249-9-en.
OECD (2015a), “Can we put an end to human smuggling?”, Migration Policy Debates No. 9, December 2015, www.oecd.org/migration/Can%20we%20put%20an%20end%20to%20human%20smuggling.pdf.
OECD (2015b), Connecting with Emigrants: A Global Profile of Diasporas 2015, OECD Publishing, Paris. https://doi.org/10.1787/9789264239845-en.
OECD (2014), Recruiting Immigrant Workers: Norway 2014, OECD Publishing, Paris, https://doi.org/10.1787/9789264226135-9-en.
Selman, P. (2016), “Global Statistics for Intercountry Adoption: Receiving States and States of Origin 2004-2015”, https://assets.hcch.net/docs/3bead31e-6234-44ae-9f4e-2352b190ca21.pdf.
Selman, P. (2009), “The rise and fall of intercountry adoption in the 21st century”, International Social Work, Vol. 52, pp. 575-594, https://doi.org/10.1177/0020872809337681.
Shuman, M. and V.E. Flango (2013), “Trends in U.S. Adoptions: 2000 to 2009”, Journal of Public Child Welfare, Vol. 7, pp. 329-349, https://doi.org/10.1080/15548732.2013.798247.
Strik, T., B. de Hart and E. Nissen (2013), Family Reunification: A Barrier or Facilitator of Integration? A Comparative Study, research report for the DG Home Affairs of the European Commission, https://emnbelgium.be/publication/family-reunification-barrier-or-facilitator-integration-comparative-study.
Vandivere, S., K. Malm and L. Radel (2009), Adoption USA: A chartbook based on the 2007 National Survey of Adoptive Parents, US Department of Health and Human Services, Office of the Assistant Secretary for Planning and Evaluation, Washington, DC, https://aspe.hhs.gov/report/adoption-usa-chartbook-based-2007-national-survey-adoptive-parents.
Witvliet, M., M. Paulussen-Hoogeboom and A. Odé (2013), Inburgering en participatie. De bijdrage van inburgering aan de participatie van migranten in de Nederlandse samenleving, Regioplan Beleidsonderzoek, Amsterdam, www.regioplan.nl/publicaties/rapporten/volgsysteem_effecten_inburgering.
Database references
Characteristics of Recent Migrants, November 2013 and Characteristics of Recent Migrants, November 2007 (Australian Bureau of Statistics), www.abs.gov.au/ausstats/[email protected]/mf/6250.0.
European Labour Force Survey (Eurostat), http://ec.europa.eu/eurostat/web/lfs/overview.
Family Migration Survey (Australian Department of Immigration and Citizenship), http://aussurveys.com/case-studies/diac-family-migration.
Labour Force Survey (Eurostat) ad hoc modules 2008 and 2014 on the labour market situation of migrants and their immediate descendants, http://ec.europa.eu/eurostat/statistics-explained/index.php/EU_labour_ force_survey_-_ad_hoc_modules.
Longitudinal Immigration Database (Statistics Canada), www23.statcan.gc.ca/imdb/p2SV.pl?Function=get Survey&SDDS=5057.
Longitudinal Immigrant Survey: New Zealand (Statistics New Zealand), www.stats.govt.nz/browse_for_ stats/population/Migration/lisnz.aspx.
New Immigrant Survey (United States Immigration and Naturalization Service), http://nis.princeton.edu/index.html.
OECD International Migration Database, https://doi.org/10.1787/data-00342-en.
Residence Permit Data Collection (Eurostat), http://ec.europa.eu/eurostat/statistics-explained/index.php/Residence_permits_statistics
Notes
← 1. The statistical data for Israel are supplied by and under the responsibility of the relevant Israeli authorities. The use of such data by the OECD is without prejudice to the status of the Golan Heights, East Jerusalem and Israeli settlements in the West Bank under the terms of international law.
← 2. “Free movement” refers to cases where international migration is not subject to residence permit requirements, within a specific area. This is the case most notably for intra-European migration by nationals of the EU, EEA and EFTA.
← 3. In Mexico, family migration inflows more than doubled from one year to another (2012-13). This increase was mainly due to a change in policy that allowed family migrants with temporary residence permits – which are not included in the flows in Figure 3.3 – to switch to permanent residence permits.
← 4. Australia, Austria, Canada, Denmark, Ireland, Italy, Korea, New Zealand, Sweden, United Kingdom, United States
← 5. The figure excludes marriages between foreigners, although these also have implications for residence status when one of the foreigners has a residence status. The figures for European countries include marriages with foreigners who are EU/EFTA nationals enjoying free movement. Intra-EU/EFTA marriages do not generally lead to the foreign spouse acquiring a family category residence permit.
← 6. UN Convention on the Rights of the Child (1989): Art. 9. 1. Parties shall ensure that a child shall not be separated from his or her parents against his or her will, Art. 9. 2. Parties shall respect the right of the child who is separated from one or both parents to maintain personal relations and direct contact with both parents on a regular basis.
← 7. The family relationships covered by thisinstrument are spouses, dependent children and parents.
← 8. In order to distinguish family reunification from family formation with a foreign-born person, a spouse who is observed to join a migrant within five years of the migrant’s arrival in the host country is counted towards family reunification. Spouses who join the migrant later are counted towards family formation with a foreign-born.
← 9. The relevant table of the Longitudinal Immigrant Survey is online: http://nzdotstat.stats.govt.nz/WBOS/Index.aspx?DataSetCode=TABLECODE13.
← 10. In the United States, for spouses and children of legal permanent residents, the wait was about two years in early 2017. For unmarried sons and daughters of US citizens, there was a minimum five-year wait, which stretched to 22 years for Mexican nationals. The wait for adult siblings of US citizens was at least 13 years.
← 11. This effect is stronger when the sponsor is female. Male sponsors – especially native-born male sponsors – are associated with spouses who are more likely to have a lower education level.