Chapter 40. United States
This chapter presents 2015 road safety data for the United States along with provisional data from 2016. It looks at trends in traffic and road safety from the years 1990 to 2015 and road user behaviour patterns with a special focus on the ageing of the population. Sections include data on speed, drink driving, drugs and driving, distracted driving, fatigue and seat belt usage. The chapter reviews the United States’ road safety strategy and looks at recently implemented safety measures and research.1
In 2015, there were 35 092 road fatalities, a 7.2% increase over 2014. This increase is the largest percentage increase recorded in nearly 50 years. The number of injury crashes and those seriously injured also increased substantially. Pedestrian and cyclists fatalities increased to a level not seen in 20 years and motorcyclist deaths increased by over 8%. Almost half of passenger vehicle occupants killed were not wearing seat belts. The fatality rate in 2015 was 10.9 per 100 000 inhabitants. Provisional data from the first 9 months of 2016 indicate an additional 8% increase in fatalities over the same period in 2015.
Road safety data collection
Definitions applied in the United States
-
Road fatality: A fatality that occurs within 30 days of a crash involving a motor vehicle travelling on a traffic way customarily open to the public.
-
Serious injuries: Incapacitating injuries, defined as severe lacerations, broken or distorted extremities, crush injuries, internal skull/chest/abdominal injuries, significant burns, unconsciousness and paralysis.
For general crash-related injury figures, the National Highway Traffic Safety Administration (NHTSA) does not differentiate between seriously and slightly-injured people. A crash is considered an injury crash if there were no fatalities, but someone involved in the crash – occupant or non-occupant – was reported as injured.
Data collection
State Police collect data on motor vehicle traffic crashes on specific roadways in each of the 50 states DC and Puerto Rico. Each state also has local police jurisdictions within counties, cities and towns that collect data on motor vehicle traffic crashes on the roadways not covered by the State Police.
The Fatality Analysis Reporting System (FARS) is a nationwide census providing the NHTSA, Congress and the American public yearly data regarding fatal injuries suffered in motor vehicle traffic crashes.
The National Automotive Sampling System (NASS) provides the NHTSA an efficient and reusable resource with which to conduct data collection representing a broad spectrum of American society. Using a core set of crash data components, the NASS has proven a reliable resource for a variety of agency sponsored electronic data collection efforts over the past 10 years.
The NASS is composed of two systems – the Crashworthiness Data System (CDS) and the General Estimates System (GES). These are based on cases selected from a sample of police crash reports. CDS data focus on passenger vehicle crashes, and are used to investigate injury mechanisms to identify potential improvements in vehicle design. GES data focus on the bigger overall crash picture, and are used for problem size assessments and tracking trends.
A challenge of collecting data at the federal level is obtaining and maintaining co-operation with state and local police jurisdictions.
Data Modernisation Project
In 2012, United States Congress appropriated USD 25 million to NHTSA to modernise NASS. The project “DataMod” was launched in January 2012 for implementation in January 2016. The goal of DataMod is to affirm NHTSA’s position as the leader in motor vehicle crash data collection and analysis, by collecting quality data to keep pace with emerging technologies and policy needs.
NASS was designed in the 1970s, and this 30-year old system needs to be updated to meet the data needs of the transport community that have increased and significantly changed over the last three decades. Congress was specific in their request and NHTSA is looking into the following items:
-
expanding the current sample size
-
expanding the scope of its data collection to possibly include large trucks, motorcycles, and pedestrians
-
assessing the need for more data from the pre-crash, crash, and post-crash phases
-
reviewing the crash data elements to be collected
-
soliciting input from interested parties, including suppliers, automakers, safety advocates, the medical community and research organisations.
Most recent safety data
Road crashes in 2016 – provisional data
A statistical projection of traffic fatalities for the first 9 months of 2016 shows that an estimated 27 875 people died in motor vehicle traffic crashes. This represents an increase of about 8% as compared to the first 9 months of 2015.
Road crashes in 2015
In 2015, there were 35 092 road fatalities, ending a five-decade trend of declining fatalities with a 7.2% increase in deaths over 2014. The 7.2% increase is the largest percentage increase in nearly 50 years (NHTSA, 2016a).
Pedestrian and cyclists fatalities increased to a level not seen in 20 years. Motorcyclist deaths increased over 8%. Almost half of passenger vehicle occupants killed were not wearing seat belts. One in three fatalities involved drunk drivers or speeding. One in 10 fatalities involved distraction.
The estimated number of injured people experienced a statistically significant increase. In 2015 there was an increase of 105 000 people injured in motor vehicle crashes over 2014.
According to NHTSA, job growth and low fuel prices are two factors that led to increased driving, including increased leisure driving and driving by young people, partly explaining the higher fatality rates. In response to the increase, the United States’ Department of Transportation (USDOT), the National Highway Traffic Safety Administration and the White House issued an unprecedented call to action to involve a wide range of stakeholders in helping determine the causes of the increase. In addition to the call to action on understanding the increase in deaths, USDOT held a special session at its Safer People, Safer Streets Summit on September 16th, 2016 to discuss the pedestrian and bicycle fatality increase with city leaders taking part in the Mayor’s Challenge.
Trends in traffic and road safety (1990-2016)
Traffic
Since 1990, the number of registered vehicles grew steadily reaching over 259 million in 2008. Even though the number of registered vehicles declined for the years 2009 and 2010, the number began rising again and the 281 million registered vehicles in 2015 has well surpassed the 2008 high. Vehicle ownership exceeds 860 vehicles per 1 000 inhabitants.
Between 1990 and 2007, vehicle-miles travelled (VMT) had grown at an annual average compound growth rate of about 1%. VMT declined in 2008 and reached in 2011, its lowest level since 2003. In 2015, VMT increased 2.3% over 2014, the largest increase in 15 years.
Road safety
Crashes and casualties
In the first decade of the 21st century, the United States averaged more than 40 000 deaths and more than 2 500 000 injuries on the roads each year. Road crashes generally are the leading cause of death for Americans aged 3 to 34. However, there has been some change with certain age groups from year to year more recently.
Over the past decade there has been a general downward trend in traffic fatalities, with a slight increase in 2012. Ten years ago in 2006, there were 42 708 people killed in traffic crashes. Safety programmes such as those that have resulted in increased belt use and reduced impaired driving have worked to substantially lower the number of traffic fatalities over the years. Vehicle improvements including technologies such as air bags and electronic stability control have also contributed greatly to reduce traffic deaths. However, with the large increase in fatalities in 2015, that decade-long downward trend of almost 25 % has been reduced by almost one-third.
Rates
In 2014, the fatality rate per 100 million VMT fell to 1.08, the lowest since NHTSA began collecting fatality data through the Fatality Analysis Reporting System in 1975. However, following the sharp increase in fatalities in 2015, the fatality rate increased to 1.13. In terms of population, the death rate in 2015 was 10.9 road fatalities per 100 000 inhabitants, a 6.3% increase from 2014. Between 1990 and 2015, the death rate expressed in terms of deaths per 100 000 inhabitants, decreased by 39%, and the risk in terms of deaths per billion vehicle-kilometres declined by 46%.
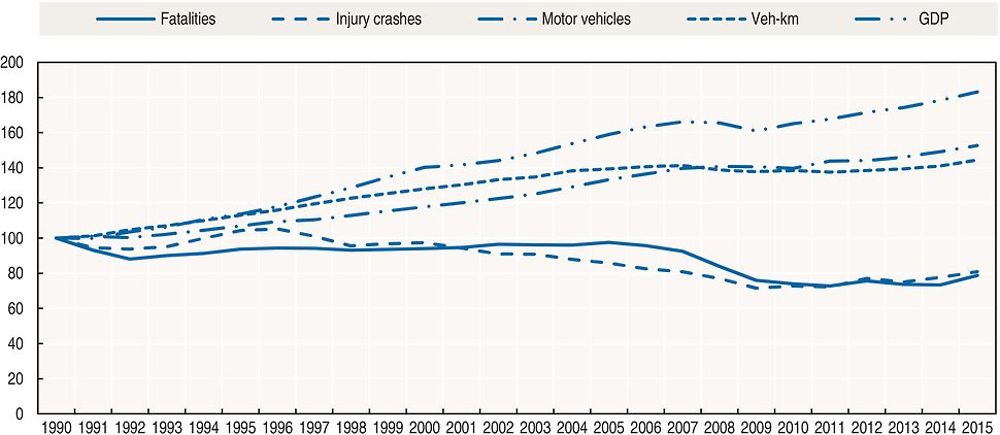
Source: World Bank (2017) (GDP; constant prices).
Road safety by user group
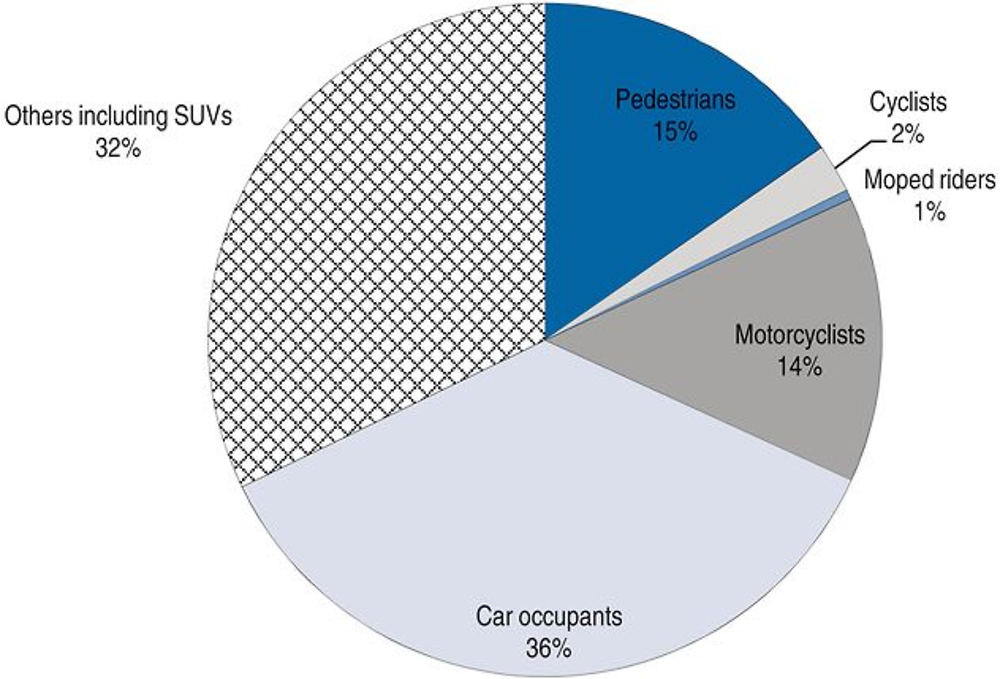
Since 1990, all road users except powered two-wheeler riders have benefited from the improvement in road safety. Motorcycle rider fatalities increased by 51% between 1990 and 2015 and moped rider fatalities by 237% (it should however be noted that the moped fleet is quite small in the United States).
In 2015, all road users, except moped riders, were affected by the deterioration of road safety. Cyclist, pedestrian, motorcyclist, SUV, and van occupant fatalities increased at a rate higher than the overall increase of 7.2%. The motorcyclist fatalities increased by 389, a 9% increase. The 2015 motorcyclist fatality count (4 811) is the highest number since 2012. Pedestrian fatalities increased by 466, a 9.5% increase. The 2015 pedestrian fatality count (5 376) is the highest number since 1996. Cyclists fatalities increased by 89, a 12% increase. The 2015 cyclist fatality count (818) is the highest number since 1995. The number of passenger vehicle occupant fatalities increased by 1 391, a 7% increase, which accounted for 59% of the overall increase in fatalities. The 2015 passenger vehicle fatality count (22 441) is the highest number since 2009. Passenger vehicles include passenger cars and light trucks.
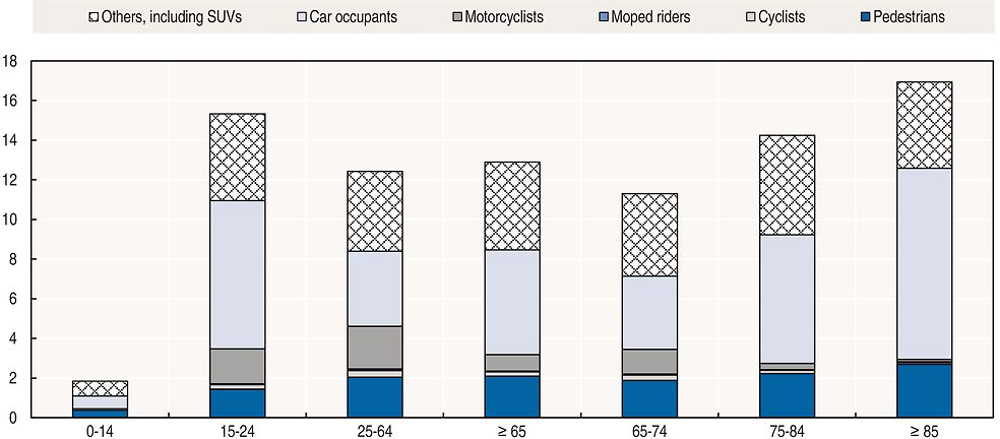
Road safety by age group
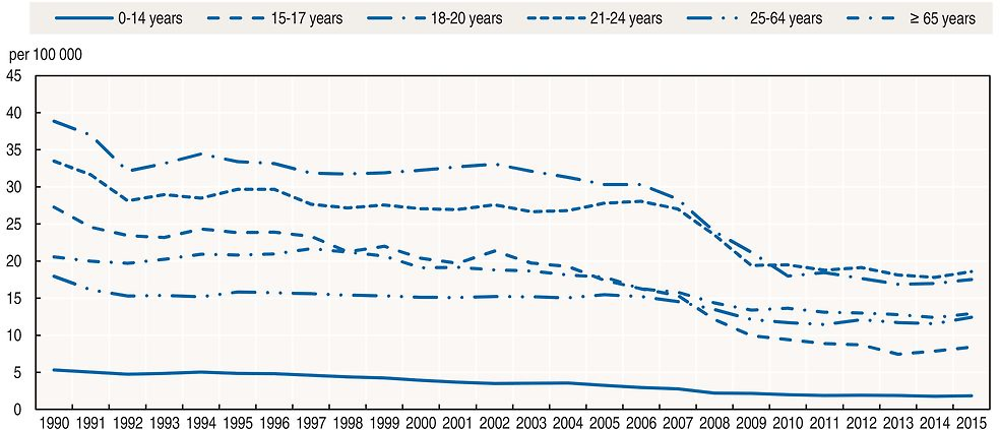
Since 1990, safety improvements have benefited all age groups, but the improvement was more marked for young people up to the age of 20 than for older age groups. The Department of Transportation has been working diligently to address the safety risk of young drivers. This group, lacking experience that is acquired only over time, often poses a greater safety risk on the road. However, over the years, with the attention to young drivers and the introduction of graduated driver licensing, fatalities associated with young drivers have decreased.
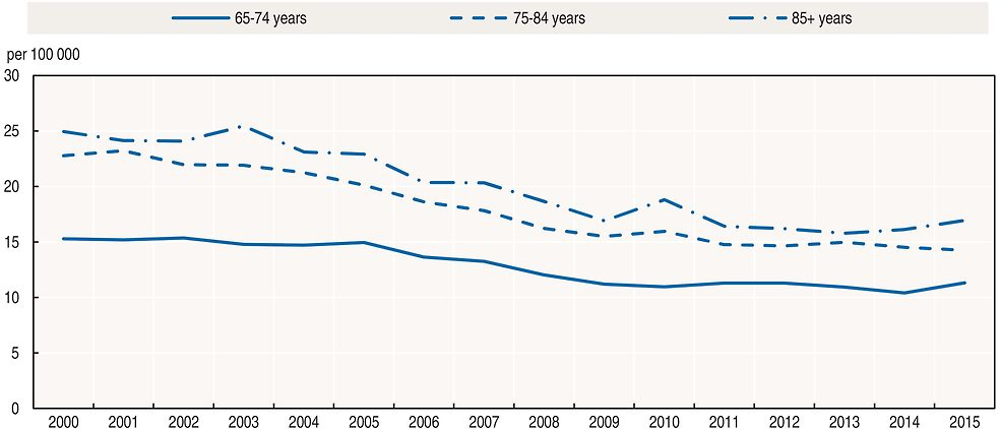
In 2015 the increase in fatalities affected nearly all age groups. Only in the 75-84 age group did the number of fatalities remain stable. The largest increase was observed in the 65-74 age group. Since 2010, the number of road fatalities in this group increased by 30%, partly explained by the demographic evolution
The 65 and over age group made up 15% of the population in 2015. Between 2006 and 2015 the number of older people in the U.S. increased by 29%, while the total population increased by 8%. Thus, a larger percentage of the population is in this age group than a decade ago (12% in 2006 to 15% in 2015). There were 40.1 million licensed older drivers in 2015, a 33% increase from 10 years earlier (2006). In contrast, the total number of licensed drivers in the United States increased by 8% from 2006 to 2015. Older drivers made up 18% of all licensed drivers in 2015, compared to 15% in 2006.
Over the past 10 years 4% more people were killed in crashes involving older drivers – from 6 334 in 2006 to 6 608 in 2015. While the annual numbers of people killed in these crashes over the last 10 years has varied, there was an increase of 9% between 2014 and 2015. This increase in one year accounts for a large portion of the increases over the last decade. Motorcyclist fatalities, though a relatively small number, increased by 142%.
Among drivers involved in fatal crashes in 2015, drivers 65 and older had a lower involvement rate per 100 000 licensed drivers than any other age group.
In 2015 among the older population the fatality rate for the 85 and older age group was 16.94 per 100 000 population, which was higher than any other older age group.
The elderly are particularly vulnerable as vehicle occupants, and not so much as pedestrians, reflecting the fact that older people walk less than in other countries.
More information can be found in NHTSA Traffic safety facts on the Older Population (NHTSA, 2017): https://crashstats.nhtsa.dot.gov/Api/Public/ViewPublication/812372 (accessed 27 June 2017).
Due to increased physical impairments that many drivers face as they age, most states have enacted legislation that places additional restrictions or requirements on older drivers. These laws include license renewal requirements, accelerated license renewal terms, and testing mandates. Medical Advisory Boards are addressed, as well. Detailed information can be found at www.nhtsa.gov/road-safety/older-drivers (accessed 30 June 2017).
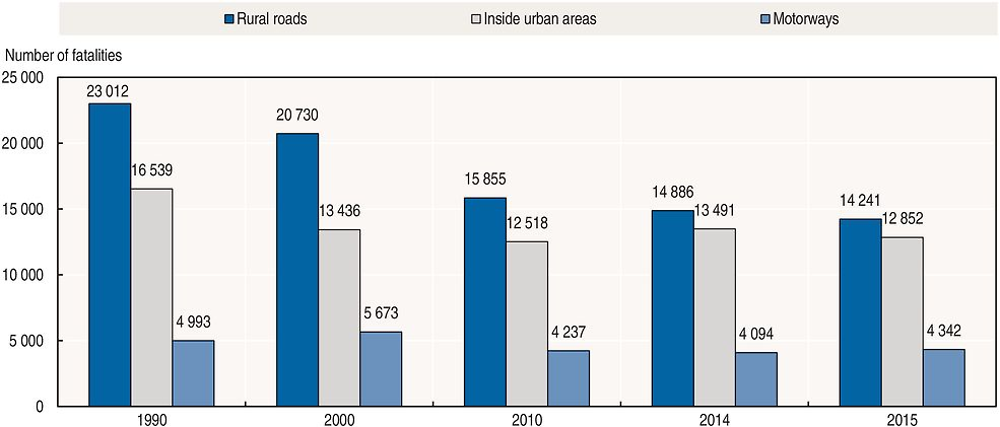
Road safety by road type
In 2015, less than half of fatalities occurred on rural roads. The number of fatalities on rural roads decreased from 14 886 in 2014 to 14 241 in 2015. There were 4 342 fatalities on motorways in the United States in 2015. This percentage has not changed from 2014 (12%).
Economic costs of traffic crashes
Based on a recent study published in 2014 (NHTSA, 2014), the economic costs of traffic crashes totalled USD 242 billion in 2010, representing 1.6% of the GDP of the United States. This represents the value of lifetime economic costs for 32 999 fatalities, 3.9 million non-fatal injuries, and 24 million damaged vehicles. This figure includes both police-reported and unreported crashes. When quality of life valuations are considered, the total value of societal harm from motor vehicle crashes in 2010 was USD 836 billion, nearly 6% of GDP.
Cost components include productivity losses, property damage, medical costs, rehabilitation costs, congestion costs, legal and court costs, emergency services such as medical, police, and fire services, insurance administration costs, and costs to employers.
Recent trends in road user behaviour
Speed
NHTSA considers a crash to be speed-related if the driver was charged with a speed-related offense, or if an officer indicated that racing, driving too fast for conditions, or exceeding the posted speed limit was a contributing factor in the crash.
Speeding is one of the most prevalent factors contributing to traffic crashes. In 2015, speed was a contributing factor in 27% of all fatal crashes. Fatalities in speed-related crashes increased by 3%, from 9 283 to 9 557.
Speed limits in the United States are set by each state. The table below summarises speed limit ranges in the United States.
Drink driving
All 50 states, the District of Columbia (D.C.) and Puerto Rico have enacted 0.8 g/l blood alcohol content (BAC) laws that make it a criminal offence to drive with that level of alcohol. All 50 states have enacted zero tolerance laws (primarily laws at 0.2 g/l or lower) that make it illegal for drivers under the age of 21 to have any detectable alcohol in their bodies.
An alcohol-impaired driving fatality is defined as a fatality in a crash involving a driver or motorcycle rider (operator) with a BAC of 0.8 g/dl or greater. In 2015, the number of fatalities in crashes involving an alcohol-impaired driver increased by 3.2%, from 9 943 to 10 265 and accounted for 30% of 2015 overall fatalities. Light-truck van drivers showed the greatest percentage decrease in alcohol-impaired drivers involved in fatal crashes from 2014 to 2015, dropping 13%. Passenger car drivers involved in alcohol-impaired driving crashes had the largest increase with 193 drivers (a 5% increase), followed by SUV drivers (35 or 2.3%).
Drugs and driving
There is no federal law regarding driving under the influence of drugs. Drug laws are generally written to forbid driving with certain drugs in the system. However, not all states have drug laws. Given the differences in state collection and reporting of drug data, and the large amounts of missing data, NHTSA’s data on drugs and crashes should be considered with care. Of those drivers involved in fatal crashes in 2015 (48 613 drivers), 36% were tested for drugs and of those, 39% were reported as having drugs in their system at the time of the fatal crash.
Distraction
Distracted driving laws focus on the use of mobile electronic devices while driving. Each state sets its own laws regarding distracted driving. As of June 2017, 14 states and D.C. prohibit drivers from using hand-held mobile phones while driving. In 38 states and D.C., all mobile phone use is banned for novice drivers, and 47 states and D.C. ban text messaging for all drivers.
In 2015, fatalities in distraction affected crashes increased from 3 197 to 3 477, representing 9.9% of all road fatalities.
The percentage of passenger vehicle drivers text messaging or visibly manipulating hand-held devices remained constant at 2.2% in 2015 (NHTSA, 2016e). The percentage of drivers holding mobile phones to their ears while driving decreased from 4.3% in 2014 to 3.8% in 2015
Sleepiness and fatigue
For NHTSA, drowsy driving crashes are those in which the driver was reported, on official crash documents, as drowsy, sleepy, asleep or fatigued. NHTSA recognises the difficulty in collecting data regarding fatigue in crashes and offers these figures as the only known crash data regarding fatigue.
In 2015, 824 people lost their lives in crashes in which a driver was reported as drowsy at the time of the crash. This represents 2.3% of the fatalities in the year. This proportion has remained relatively consistent over time. In addition to those killed, an estimated 41 000 people were injured in crashes involving a drowsy driver in 2015. A total of 90 000 police-reported crashes throughout the year were estimated to be considered drowsy driving crashes.
Seat belts and helmets
Seat belt laws are divided into two categories: primary and secondary. Primary seat belt laws allow law enforcement officers to ticket a driver or passenger for not wearing a seat belt, without any other traffic offense taking place. Secondary seat belt laws state that law enforcement officers may issue a ticket for not wearing a seat belt only when there is another citable traffic infraction. As of May 2017, the seat belt law situation was as follow:
-
34 states, D.C., American Samoa, Guam, the Northern Mariana Islands, Puerto Rico and the Virgin Islands have primary seat belt laws for front seat occupants.
-
15 states have secondary laws. Secondary seat belt laws state that law enforcement officers may issue a ticket for not wearing a seat belt only when there is another citable traffic infraction. In many of these states, the law is primary for younger drivers and/or passengers.
-
New Hampshire has enacted neither a primary nor a secondary seat belt law for adults, although the state does have a primary child passenger safety law that covers all drivers and passengers under 18.
-
Rear seats: 28 states, D.C., Guam and the Northern Mariana Islands, have laws requiring belt use for all rear seat passengers. In 18 of these states, D.C. and 2 territories, the law is primary.
In 2016, seat belt use reached 90.1% up from 88.5% in 2015 (NHTSA, 2016b). Seat belt use has shown an increasing trend since 2000, accompanied by a steady decline in the percentage of unrestrained passenger vehicle occupants killed during the daytime. Seat belt use continued to be higher in the states in which vehicle occupants can be pulled over solely for not using seat belts.
For more information on seatbelt laws: www.ghsa.org/state-laws/issues/Seat-Belts (accessed 30 June 2017).
Child passenger restraint laws vary based on age, weight and height. Most laws use restrictions in stages, starting with infants in rear facing seats, moving to toddlers in forward facing child seats, and then older children using booster seats until they reach a size or age for using an adult belt. All 50 states and D.C. require child safety seats for infants and children fitting specific criteria, and all but two states require booster seats or other appropriate devices for children who have outgrown a child safety seat but are still too small to use an adult seat belt safely.
For more information on child restraint law: www.ghsa.org/state-laws/issues/Child-Passenger-Safety (accessed 30 June 2017).
Booster seat use among 4-7 year-old children was 44.5% in 2015 (NHTSA, 2016d),
Currently, about half the states require helmets for all motorcyclists. Most other states require helmets for certain riders, and a few have no helmet law. The Global Health Security Agenda (GHSA) urges all states to adopt a universal motorcycle helmet law and vigorously enforce existing laws. As of May 2017, the situation regarding motorcycle helmet law was as follow:
-
47 states, D.C., Guam, the Northern Mariana Islands, Puerto Rico and the U.S. Virgin Islands have a helmet law for motorcyclists.
-
19 states, D.C., the Northern Mariana Islands, Puerto Rico and the U.S. Virgin Islands have a universal helmet law, requiring helmets for all riders.
-
The remaining 28 states and Guam require helmets for specific riders.
-
3 states (Illinois, Iowa and New Hampshire) do not have a motorcycle helmet law.
For more information on helmet laws: www.ghsa.org/state-laws/issues/motorcyclists (accessed 30 June 2017).
In 2016, the average wearing rate of a DOT-compliant motorcycle helmet meeting DOT safety standard FMVSS218 was 65.3%. Use of non-compliant helmets was 8.6% (a decrease when compared to 2015) and 26.1% had no helmet. Among states with universal helmet laws, 79.6% were wearing DOT-compliant helmets with an additional 14.9% wearing non‐DOT-compliant helmets. In states without universal helmet laws, 53.5% were wearing DOT-compliant helmets and an additional 3.5% were wearing non-compliant helmets (NHTSA, 2016c).
Overall the helmet usage in the United States is much lower than in most other OECD countries.
National road safety strategies and targets
Organisation of road safety
The United States uses a “federalism” approach that divides the powers of government between the national (federal) government and state and local governments. Under federalism, each level of government has sovereignty in some areas and shares power in others. At the national level, Congress passes the laws and assigns the funding that provides the overall structure for the DOT to carry out its safety mission. However, most traffic safety laws and policies are enacted and developed at the state level. For example, each of the 50 states, D.C. and Puerto Rico have the authority to set their own speed limits, distracted driving rules, or seat belt use law.
Congress can influence the states by providing incentive grants if they enact certain laws that have been proven effective or penalties if they do not. It can also use performance results as eligibility criteria for grants in some cases. The DOT implements the grant programmes and provides guidance to the states on developing effective strategies that address their particular traffic safety challenges.
Within DOT, NHTSA has the lead role in reducing traffic crashes and fatalities.
In 2010, DOT designated reducing roadway fatalities as one of its high-priority performance goals. Three agencies, the NHTSA, the Federal Highway Administration (FHWA), and the Federal Motor Carrier Safety Administration (FMCSA), work together to address multiple dimensions of roadway safety.
Road safety strategy for 2011-20
The number one priority of DOT remains safety.
To align the programme and policy actions, DOT has established four fatality sub measures: passenger vehicles, non-occupants, motorcycle riders, and heavy goods vehicle or bus-related fatalities. The purpose of this approach is to more closely examine fatality rates of the different segments of highway users, focus the energy and resources involved and develop new strategies to reduce fatalities in each of the four areas.
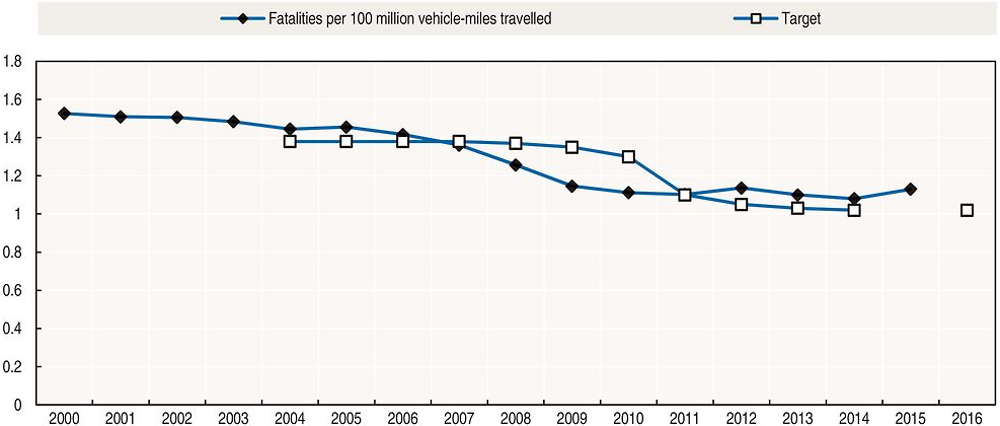
Road safety targets
The DOT currently has performance targets to 2016 for the overall fatality rate and NHTSA and FMCSA have performance targets for each of the four sub measures. For 2016, DOT’s overall motor vehicle crash fatality rate target is 1.02 fatalities per 100 million VMT. The sub-measure targets for 2016 are 0.15 fatalities per 100 million VMT for the non-occupant fatality rate, 62 fatalities per 100 000 registrations for the motorcyclist fatality rate, 0.82 fatalities per 100 million VMT for the passenger vehicle fatality rate, and the large vehicle and bus fatality rate for 2016 is 0.114 fatalities per 100 million VMT.
The fatality rates are forecast through statistical methods for a number of years into the future in order to guide a plan of action for safety countermeasures. These forecasts use historical data combined with an evaluation of the existing countermeasures, trend data, and other societal factors that may affect fatality rates in the future.
Starting in 2016, NHTSA changed its non-occupant fatality measure (pedestrians and cyclists) from a rate of fatalities per 100 million vehicle miles travelled (VMT) to per 100 000 population.
The fatality rate per 100 million VMT increased from 1.08 in 2014 to 1.13 in 2015.
Recent safety measures (2014-17)
Road safety management
-
In 2016, NHTSA focused its efforts in three major areas this year: proactive vehicle safety, automated vehicle technology and long-term planning for the road to zero fatalities. Diversified public outreach was an integral part of these initiatives. NHTSA held public hearings and forums around the nation in an effort to engage traditional and non-traditional stakeholders to make innovative changes to highway safety: two public hearings on proposed enhancements to the 5-Star Safety Rating programme, two public meetings on the development of federal automated vehicle policies, a forum on drowsy driving, a cybersecurity roundtable, and six regional forums on behavioural safety.
-
The behavioural safety events culminated with a final summit in October 2016 to lay out a roadmap on the road toward zero fatalities over the next 30 years.
-
The USDOT has pledged up to USD 40 million to one city to help it define what it means to be a “Smart City” and become the country’s first city to fully integrate innovative technologies – self-driving cars, connected vehicles, and smart sensors – into their transportation network. See more at: www.transportation.gov/smartcity (accessed 30 June 2017).
-
The USDOT has launched the Department’s Safer People, Safer Streets Initiative. Over the course of the next year and a half, the Department will be doing more to address non-motorised safety issues and help communities create safer, better connected cycling and walking networks. See more at: www.transportation.gov/safer-people-safer-streets (accessed 30 June 2017)
Road users
Human behaviour
-
NHTSA released a Drowsy Driving Research and Program Plan in 2016. See: www.nhtsa. gov/sites/nhtsa.dot.gov/files/drowsydriving_strategicplan_030316.pdf (accessed 30 June 2017). “ChORUS” – A Clearinghouse for Older Road Users, is a comprehensive and dynamic source of information on traffic safety for older drivers, pedestrians, and cyclists which was also developed. See: www.roadsafeseniors.org/ (accessed 30 June 2017). The agency also held an expert panel meeting in partnership with Harvard’s School of Public Health to explore the feasibility of research projects focusing on the role situational awareness in crashes.
Vehicles
-
Advances in automated vehicle technology continue to accelerate at an astounding pace. In September 2016, NHTSA released a major new policy on automated vehicles that sets the framework and pathway for the safe testing and deployment of these new technologies that have enormous potential for improving safety and mobility. NHTSA also secured a groundbreaking commitment from 20 automakers in March 2016 to make automatic emergency braking (AEB) technology a standard feature on new vehicles by 2022, and on heavier trucks by 2025.
-
NHTSA finalised new motor vehicle standards for medium and heavy-duty vehicles to improve fuel efficiency. The agency proposed equipping large commercial vehicles with speed limiters, a safety measure that could save lives and more than USD 1 billion in fuel costs each year. NHTSA also announced a new direction on school bus safety – supporting the installation of three-point seat belts on school buses.
-
NHTSA launched a first ever national recall campaign, Safe Cars Save Lives, to provide consumers with information on vehicle safety helping them make more informed purchasing decisions and to improve recall completion rates. The campaign includes online advertising that directs consumers to a dedicated web site that makes it easy for them to check their vehicle for recalls. While NHTSA will continue to hold manufacturers accountable for identifying and addressing defects in a timely manner (the agency imposed more than USD 450 million in penalties on vehicle and equipment makers in 2016), the agency recognises that real safety is identifying risks and providing remedies before a tragedy occurs in the first place.
-
Toward that end, NHTSA developed the Proactive Safety Principles in 2016. This historic agreement between USDOT and 18 automakers includes a set of principles that provide a framework to help the industry build a culture of proactive safety, improve data analysis, maximise safety recall participation rates and enhance cybersecurity, while working in a collaborative manner. Complementing the Principles, NHTSA organised a Safety Stand-down Day, a unique one-day forum that gathered leaders from the Federal Aviation Administration (FAA), which is a sister agency of NHTSA, and the aviation and auto industries to discuss how safety lessons learned from aviation could be applied to the auto industry to encourage collaboration on safety.
-
Vehicle safety: NHTSA released a proposal to strengthen its 5-Star Safety Ratings programme by adding an additional crash test that measures how well a vehicle protects occupants in an angled frontal crash, and by developing new crash test dummies. The changes will also encompass rating vehicles on new crash-avoidance advanced technologies, and how well vehicles protect pedestrians in a crash: www.safercar.gov/5Stars (accessed 30 June 2017).
-
NHTSA and the Insurance Institute for Highway Safety (IIHS) announced on 17 March 2016 a historic commitment by 20 car manufacturers representing more than 99% of the US car market to make automatic emergency braking (AEB) a standard feature on virtually all new cars no later than 2022. NHTSA estimates that the agreement will make AEB standard on new cars three years faster than could be achieved through the formal regulatory process. During those three years, according to IIHS estimates, the commitment will prevent 28 000 crashes and 12 000 injuries.
Roadway and infrastructure
-
Infrastructure safety: FHWA expanded its “Road Diet” technical assistance resources and workshops to States. The primary benefits of a Road Diet include enhanced safety, mobility and access for all road users and a “complete streets” environment to better accommodate a variety of transportation modes: http://safety.fhwa.dot.gov/road_diets/ (accessed 30 June 2017).
USDOT’s Federal Highway Administration has several programmes to address safety on different road types as well as intersection, pedestrian and cyclist safety. Some of the programmes are:
-
Highway Safety Improvement Program: http://safety.fhwa.dot.gov/hsip/ (accessed 30 June 2017).
-
Intersection Safety: http://safety.fhwa.dot.gov/intersection/ (accessed 30 June 2017).
-
Roadway Departure Safety: http://safety.fhwa.dot.gov/roadway_dept/ (accessed 30 June 2017).
-
Pedestrian and Bicycle Safety: http://safety.fhwa.dot.gov/ped_bike/ (accessed 30 June 2017).
-
Local and Rural Road Safety Program: http://safety.fhwa.dot.gov/local_rural/ (accessed 30 June 2017).
Recent and ongoing research
-
NHTSA released a Drowsy Driving Research and Program Plan in 2016. See: www.nhtsa. gov/staticfiles/nti/pdf/DrowsyDriving_StrategicPlan_030316.pdf (accessed 30 June 2017).
-
“ChORUS” – A Clearinghouse for Older Road Users: a comprehensive and dynamic source of information on traffic safety for older drivers, pedestrians, and cyclists www.roadsafe seniors.org/ (accessed 30 June 2017).
References
NHTSA (2016a), 2015 Motor Vehicle Crashes: Overview, NHTSA, Washington, DC, https://crashstats.nhtsa. dot.gov/Api/Public/ViewPublication/812318 (accessed 30 June 2017).
NHTSA (2016b), Seat Belt Use in 2016 – Overall Results, NHTSA, Washington, DC, https://crashstats.nhtsa. dot.gov/Api/Public/ViewPublication/812351?_ga=1.130211079.923985568.1492078308 (accessed 30 June 2017).
NHTSA (2016c), Motorcycle Helmet Use in 2015 – Overall Results, NHTSA, Washington, DC, https://crashstats. nhtsa.dot.gov/Api/Public/ViewPublication/812275 (accessed 30 June 2017).
NHTSA (2016d), The 2015 National Survey of the Use of Booster Seats, NHTSA, Washington, DC, https://crashstats.nhtsa.dot.gov/Api/Public/ViewPublication/812309 (accessed 30 June 2017).
NHTSA (2016e), Driver Electronic Device Use in 2015, NHTSA, Washington DC, https://crashstats.nhtsa.dot. gov/Api/Public/ViewPublication/812326 (accessed 30 June 2017).
NHTSA (2015), Lives saved by vehicle safety and associated Federal Motor Vehicle Safety Standards, 1960 to 2012, Department of Transportation, Washington, DC, www-nrd.nhtsa.dot.gov/Pubs/812069.pdf (accessed 30 June 2017).
NHTSA (2014), The Economic and Societal Impact of Motor Vehicle Crashes, 2010, NHTSA, Washington, DC, www-nrd.nhtsa.dot.gov/pubs/812013.pdf (accessed 30 June 2017).
World Bank (2017), “GDP (constant US$)”, World Development Indicators, http://databank.worldbank.org/data/reports.aspx?source=world-development-indicators (accessed 23 February 2017).
Websites
-
National Highway Traffic Safety Administration: www.nhtsa.gov (accessed 30 June 2017).
-
NHTSA Office of Vehicle Safety Research: www.nhtsa.gov/Research (accessed 30 June 2017).
Note
← 1. All data stem from the National Highway Traffic Safety Administration (NHTSA) and IRTAD unless otherwise noted. For more information please contact: [email protected].