Chapter 38. Switzerland
This chapter presents 2015 road safety data for Switzerland along with fatality data from 2016. It looks at trends in traffic and road safety from the years 1990 to 2015 and road user behaviour patterns, with a special focus on the ageing population. Sections include data on speed, drink driving, drugs and driving, distracted driving, fatigue and seat belt usage. The chapter reviews Switzerland’s road safety strategy with recently implemented safety measures and current and ongoing research.1
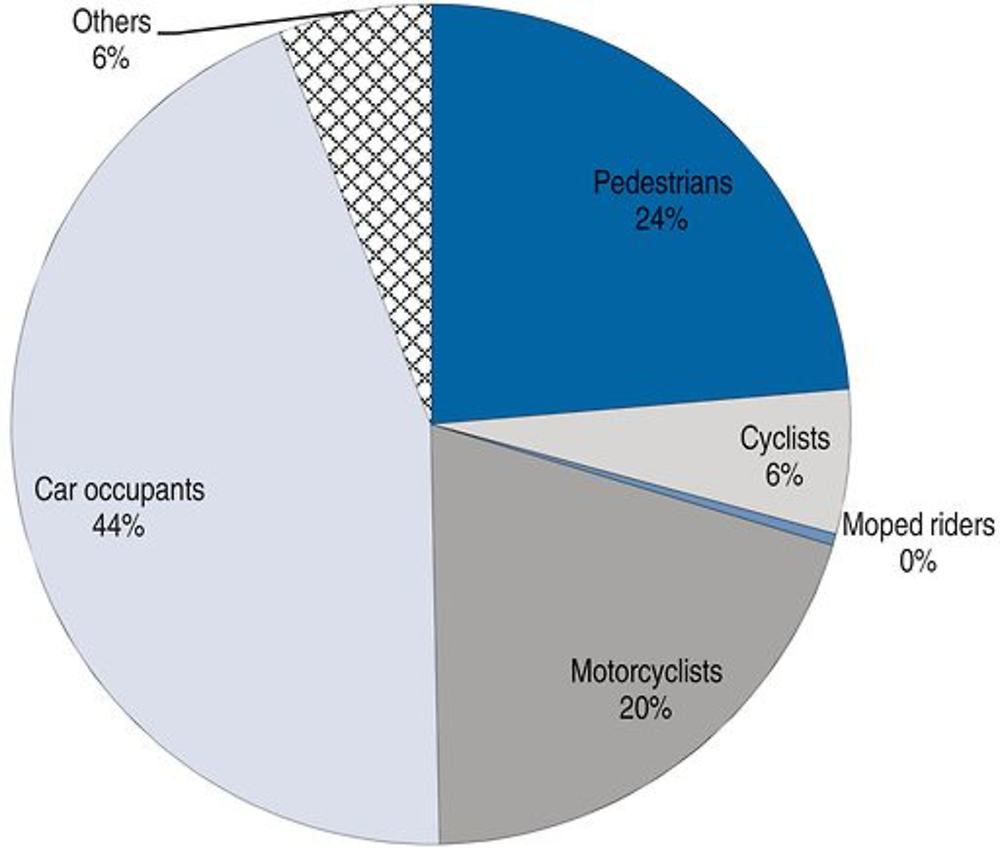
Following a small increase in fatalities in 2015, data from 2016 indicate a significant decrease of 15% down to 216 fatalities, the lowest number in over 70 years of record keeping. The number of injury crashes decreased by 1%. As the reduction is in most amongst motorcyclists and cyclists, it is likely that the poor weather conditions in the first part of 2016 contributed to this positive development. In 2015, car occupants in particular benefited from a reduction of 22.7% in the number of fatalities, comprising 30% of the total fatalities. The over 65 age group remain the most vulnerable as pedestrians, comprising 60% of pedestrian fatalities overall since 2012.
Road safety data collection
Definitions applied in Switzerland
-
Road fatality: Death which occurred within 30 days of the road crash.
-
Seriously injured person: Since January 2015 hospitalisation for at least 24 hours is the minimum precondition for classification as a serious injury. To enable standardisation the severity scale was linked to the codes of the National Advisory Committee for Aeronautics, used by all emergency services in Switzerland. A serious injury is either a significant (NACA Codes 3 and 4) or a life-threatening injury (NACA Codes 5 and 6).
-
Slight injury: Minor injury such as superficial skin injury. The casualty can leave the crash site unaided. An outpatient treatment in a hospital or by physicians may still be required.
-
Injury crash: Crash resulting in at least one injured or killed person.
In Switzerland, injury severity is assessed by police present at the scene. Following the new definition on serious injury, in force since January 2015, police officers are trained to record injury severity based on the new classification.
Data collection
Since January 2011, the Federal Roads Office (FEDRO) is responsible for all Swiss road crash data. A new reporting form was introduced to all cantonal police forces and a new platform for data entry and data analysis (statistical and geographical) is available online.
To estimate the real extent of road traffic injuries, police-reported data is compared to insurance data. Factors are then calculated to correct the number of unreported cases by road use and age group.
To have a better understanding of the consequences of road crashes, the Swiss Federal Roads Office carried out a research project to link police-reported data of a given year with other data sources, including hospital data. This has enabled coding of the recommended maximum Abbreviated Injury Scale score based on the International Classification of Diseases (ICD-10). A yearly data linkage procedure is implemented. The availability of data for several years will facilitate future research.
Most recent safety data
Road crashes in 2016
In 2016, with 216 fatalities, Switzerland achieved its best road safety result in over 70 years of record keeping. Compared to 2015, the number of fatalities decreased by 15%. The number of those seriously injured for the same time period decreased by only 1%, from 3 830 in 2015 to 3 785 in 2016.
However, the reduction in fatalities and those seriously injured was exclusively achieved in the first half of 2016 and most notably for motorcycles and bicycles. The most likely explanation for the reduction is, once again, the bad weather conditions in spring 2016. The second half of 2016 is comparable to previous years.
Recent accident data show that cyclists, pedestrians and motorcyclists will be the focus of future prevention.
Road crashes in 2015
In 2015, there were 253 road fatalities in Switzerland, a 4% increase from 243 in 2014. However, this figure does not bring into question the overall decreasing trend. The number of fatalities in 2015 is below the average of the previous four years. The number of injury crashes over the same time period decreased by 6%.
While 14 electric bicycle (e-Bike) riders were killed in 2015, 9 more than in 2014, the fatalities for traditional bicycles decreased by 14%. There were 66 fatally injured motorcycle riders, a 25% increase compared to 2014, probably due to the mild weather in the summer of 2015.
As mentioned above, a new and tightened definition of “serious injury” was introduced in 2015. This led to a decrease in the number of seriously injured road users while slightly injured road users increased compared to the previous year.
Trends in traffic and road safety (1990-2016)
Traffic
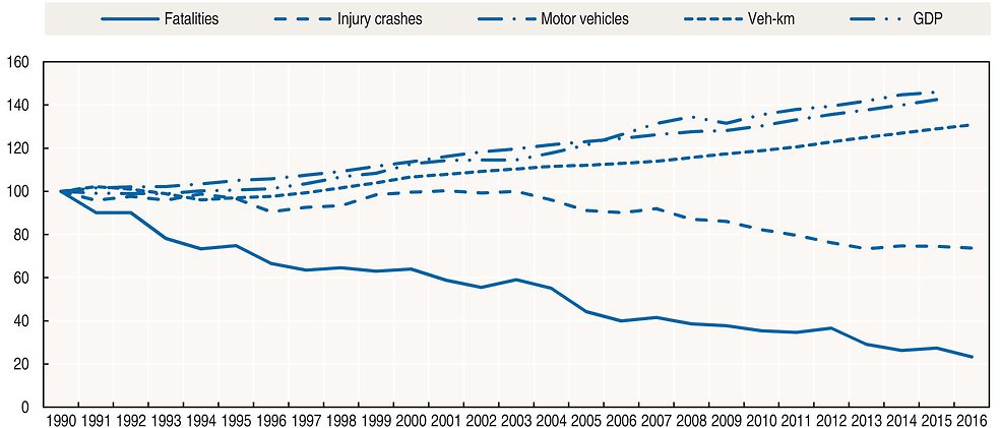
Since 1990, the distance travelled (vehicle-kilometres) increased by 28.5% and the number of motorised vehicles increased by 42.5%.
Total vehicle-kilometres travelled in 2015 showed an increase of 1.5% compared with the previous year. Provisional figures for 2016 indicate that the overall traffic volume rose again (1.5%).
Constant population growth and the ever-increasing trend of mobility has lead to increasing traffic volume for both individual and public transport. An important characteristic of road traffic in Switzerland is the transport of freight through the Alps. In recent years there has been a decrease in transalpine road freight traffic. However, in 2015 more than 1 million HGVs crossed the Alps, of which 70% were foreign vehicles.
Road safety
Crashes and casualties
Road fatalities peaked in 1971, when 1 720 people died on the roads. Between 1971 and 1996, the number of fatalities significantly diminished. The average annual reduction from 1971 to 1976 was 7.5%, and then 3%, until 1996. Between 1997 and 2000, the number of casualties stabilised at around 600 per year. In 2004-06, the rate of decrease significantly accelerated. Recent figures show a downward trend in the numbers of those seriously injured, following years of little change.
Over the last 15 years several important safety measures have been implemented in Switzerland, including:
-
2005: The legal blood alcohol content (BAC) limit was lowered to 0.5 g/l. At the same time police were authorised to check for alcohol without suspicion.
-
2005: Jurisdiction for licence withdrawal was strengthened and a new, two-stage drivers’ training was introduced.
-
2013-15: The first measures of the road safety programme “Via Sicura” came into force, including mandatory daytime running lights, a zero blood alcohol limit for novice, bus and truck drivers, and tightened sanctions for excessive speeding up to lifelong licence withdrawal, seizure and exploitation of motor vehicles.
-
The following measures are planned for implementation from 2019:
-
Excessive drink-driving offenders must equip their car with an Alcolock.
-
Excessive speed offenders will get their licence back when their car is equipped with a data recorder for five years.
-
Rates
In 2015, the mortality rate expressed in terms of deaths per 100 000 inhabitants was 3.1, a 63% decrease compared to 2000. Similarly, the mortality risks, expressed in terms of deaths per distance travelled, have decreased by two-thirds since 2000.
Source: World Bank (2017) (GDP; constant prices).
Road safety by user group
All user groups have benefited from the improvement in road safety since 1990. A sharp decrease is observed for moped riders (-94%) mainly due to a large reduction in moped distance travelled in recent years.
Since 2000, car occupant safety has improved substantially (-72.5%). The penetration of safer vehicles into the fleet partly explains these good results.
Since 2011, e-Bikes constitute a new category of vehicle in police records. From 2011 to 2015 serious or fatal crashes involving these vehicles increased in proportion to the sales figures. In 2016, 9 fatal and 201 seriously injured e-Bike riders were registered by the police. From 2011 to 2015, 3 in 4 fatally injured e-Bike riders were aged 65 or older.
In the last few years, on average 60 pedestrians were killed each year. The figure for 2014, with 43 pedestrians killed, was a statistical outlier downwards. In 2015, the number of killed pedestrians increased again to 58.
Road safety by age group
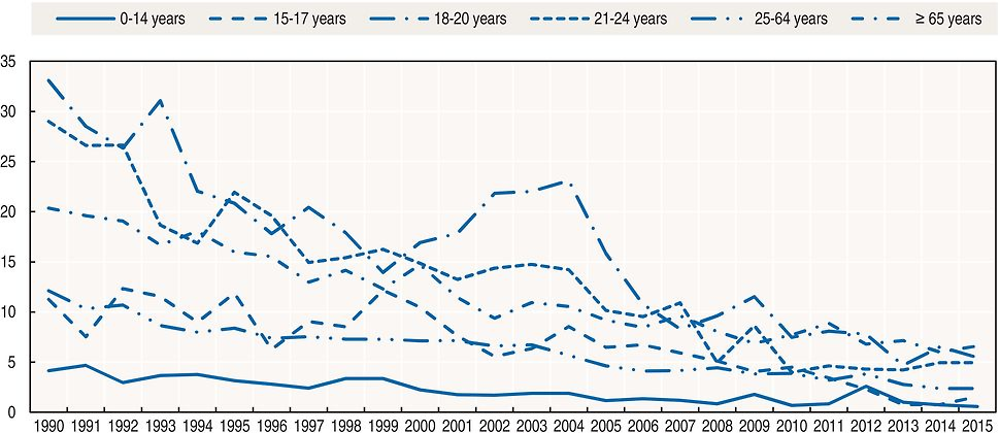
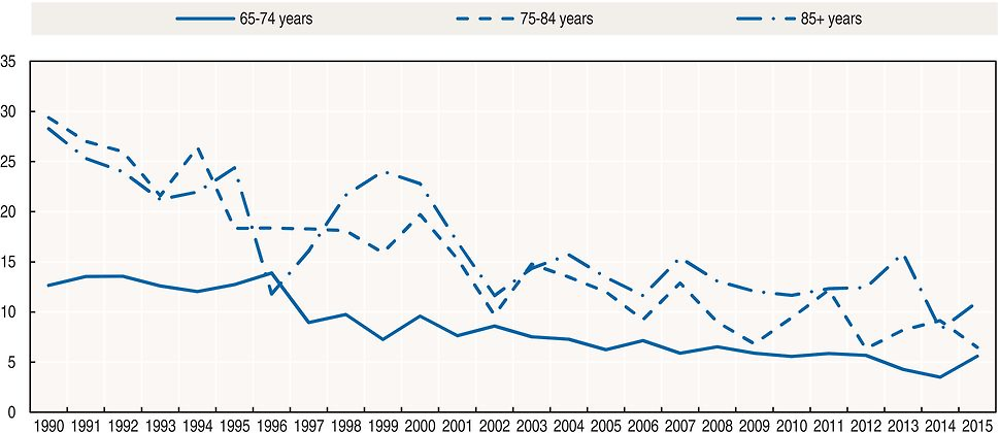
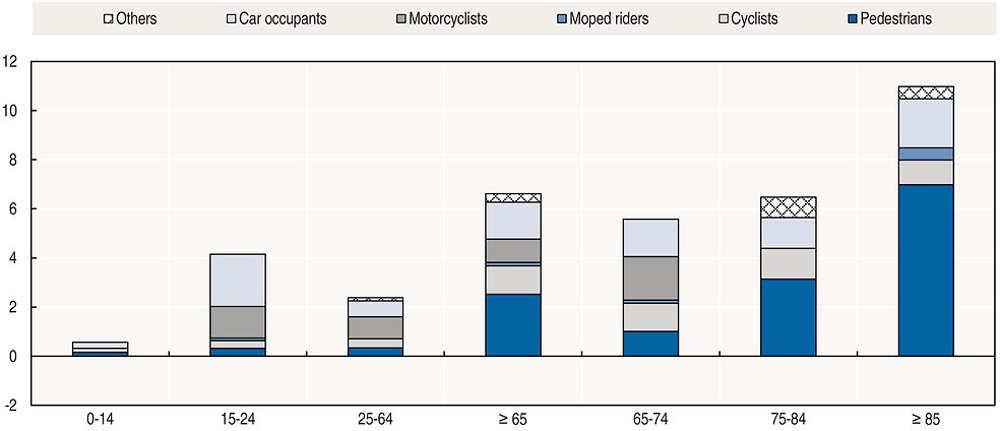
Since 1990, a reduction in fatalities has been observed in all age groups, with a greater than average reduction for teenagers and young people. The trend for older road users is less positive than for other age groups. They are particularly vulnerable as pedestrians. In the period 2012-16, 60% of all pedestrian fatalities were aged 65 or over.
The mortality rate of young people (18-20) has decreased substantially since 2004. This is partly explained by reduced exposure, as the mean age for obtaining a driving licence is increasing. Another explanation is the introduction in 2005 of the two-phase licensing scheme, with a three-year probationary licence.
The Swiss Statistical Office published different models to forecast the demographic evolution up to 2045. The population is expected to grow by 30% – from 8.5 million to 11 million. In the same period the population aged 65 or older will rise by more than 80%, from 1.5 to 2.8 million.
In 2015, there were 97 persons of 65 years and over killed in road traffic (38% of all road deaths). Of those, 38% were pedestrians, 23% car occupants, 18% cyclists and 14% motorcyclists. The proportion of the senior population in the total number of fatalities has been increasing (21 % in 1990, 27% in 2000, 31% in 2010), reflecting to a certain extent a general trend of population aging.
In Switzerland, medical examinations are mandatory from 70 years of age. They focus on vision, hearing, skin, mental health, the nervous system, cardiovascular system, lungs, abdominal organs and movement. Tests include the Trail-Making Test Part A and B, Mini Mental Status Test, and the clock test (all related to dementia).
From 1 July 2016, the mandatory medical examination from age 70 has been modified, in particular with regard to mental health. In that year, the number of licence withdrawals among that age group increased by more than 20%. On the other hand, there have been political moves to increase the age of the first medical examination from 70 to 75 (similar to the Netherlands and Denmark).
Another aspect is to do with the self-assessment instruments. The bfu is planning to introduce a German, French and Italian version of the Driving Decisions Workbook (Eby et al., 2000). The implementation will begin in 2018 and should be finished by 2020.
Specific measures are required to improve pedestrian and e-cycling safety. These may include more pedestrian crossings with middle isles and courses for beginner e-cyclists. The usefulness of the medical examination should also be analysed and consequences drawn.
Road safety by road type
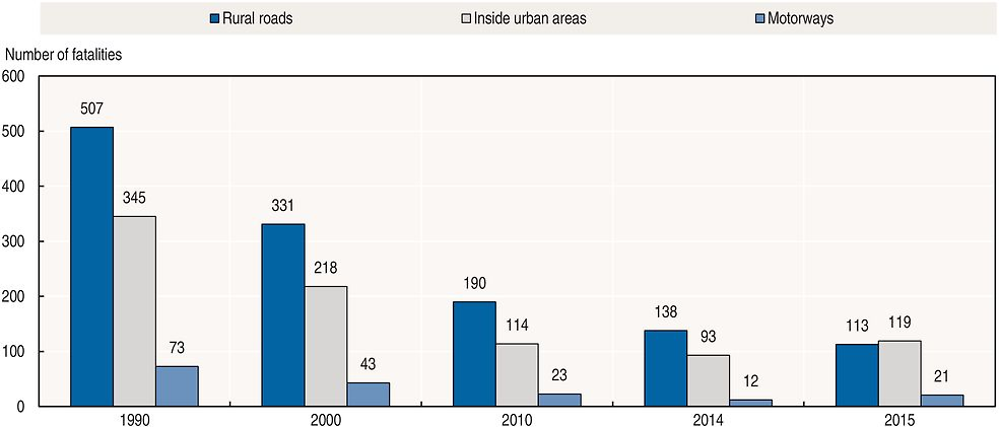
In the last 25 years fatalities in urban areas decreased by more than 65%, on rural roads by 78% and 71% on motorways. Motorways, already the safest roads, have become even safer.
In 2015, for the first time, more road users were killed on urban roads than on rural roads (119 vs. 113). On motorways there were 21 fatalities, 9 more than 2014 but still few compared to other road types.
In 2016, there were again more fatalities on rural roads compared to other road types.
Economic costs of traffic crashes
In 2013, the cost of road crashes was CHF 8.8 billion. This estimate of the total economic burden is based on a willingness-to-pay approach (Niemann et al., 2015). The estimate includes non-reported crashes.
Recent trends in road user behaviour
Speed
In 2015, speed was a contributing factor in about 27% of fatal crashes. In most cases, inappropriate speed is to blame rather than excessive speed. In 2010, the proportion of drivers above the speed limit was 23% on urban roads, 31% on rural roads and 18% on motorways. The survey on actual speeds was stopped in 2010.
The table below summarises the main speed limits in Switzerland.
Drink driving
An alcohol crash is defined as any fatal crash, in which any active participant (driver, pedestrian, cyclist, etc.) has a blood alcohol level (BAC) above the legal limit.
In 2005, the maximum legal BAC was reduced from 0.8 g/l to 0.5 g/l and random breath testing was introduced. As of 1 January 2014, novice drivers are subject to a zero alcohol limit for their first three years behind the wheel. The same restriction applies to all professional drivers.
In the last few years the share of alcohol crashes in all fatalities declined. In 2016, 16% of fatal crashes involved an intoxicated driver and was thus higher than in the previous 2 years. While the share of drivers under influence of alcohol is not known, research results show that the acceptance of drink driving in the population is decreasing.
Since 1 October 2016 a breath alcohol test can also be used as evidence for a higher alcohol concentration than 0.8 g/l. Until then a blood sample was required.
Drugs and driving
In 2016, 20 road fatalities (10%) were explicitly due to a road user impaired by drugs, legal or otherwise. However, in official statistics, the consumption of drugs is probably underreported.
In Switzerland the limit for drugs is set at zero (“zero tolerance”). The road traffic law specifies that driving ability must be ensured. The use of any drugs which reduce driving ability is prohibited. In the case of some drugs, like THC or amphetamine, a positive test is proof of reduced driving ability and considered an offence. In the case of other drugs or medical substances a “three-pillar system” is used: driving impairment is judged by police, physicians and blood tests.
Distraction
Distraction, or lack of attention, is cited in 28% of fatal crashes in 2016. Distraction or lack of attention is judged by the police at scene and includes distraction by passengers, animals, mobile phone use, handling car equipment like air conditioning or a navigation system.
The use of mobile phones without a hands-free set or for texting is subject to a fine of CHF 100. Although using mobile phones with hands-free sets is not prohibited, in several cases the Swiss Federal Court has qualified such use as a situation that leads to impaired driving.
Sleepiness and fatigue
According to police reporting, 5% of all fatal crashes in 2016 were due to fatigue. The real number is expected to be much higher.
Seat belts and helmets
Seat belt use has been compulsory in front seats since 1981 and in rear seats since 1994. Since 2002, dedicated child-restraint systems have been mandatory for all children below the age of seven. Since April 2010, new regulations have been applied for the transport of children in cars: Children aged between 7 and 12 and less than 150 cm must be restrained with a certified child-restraint system.
In 2016, seat belt wearing rates among car drivers and front-seat passengers remained stable, with figures of 94% each. For back seats the highest rate observed was 86%. The rates by location and language regions did not significantly change in 2016. One special group are delivery trucks, box-type vans, and vehicles with a truck bed – mostly tradespeople and delivery services, where just 80% of drivers and 77% of passengers buckle up while transporting goods. Passenger transport journeys on the other hand report a wearing rate of 96% and 97% respectively.
In the past three years, 41% of killed car occupants were not wearing a seat belt. Considering the actual wearing rate and a 50% protective effect of the seat belt on front seats and 25% on rear seats, it is estimated a 100% wearing rate in front and rear seats would have saved four lives in 2016.
Helmet wearing has been compulsory on motorcycles since 1981 and on mopeds (up to 50 cc, maximum speed 45 km/h) since 1990. Observation indicates a compliance rate of almost 100%.
Since 2012 bicycle helmets are required on e-Bikes above 25 km/h with pedal assistance.
National road safety strategies and targets
Organisation of road safety
Due to Swiss federalism, many organisations are involved in and responsible for road safety, including local and cantonal authorities, special interest groups and insurance companies. The leading roles in road safety are taken mainly by the three organisations: The Fund for Road Safety, the Swiss Council for Accident Prevention (bfu) and the Federal Roads Office (FEDRO). The Swiss Federal Council regulates the national road safety policy and is responsible for the “Via Sicura” road safety programme.
Road safety strategy for 2011-20
On 15 June 2012, the Swiss Federal Council adopted the road safety programme “Via Sicura”, almost 10 years after the first proposal. A range of safety measures is being progressively implemented (see details in section below).
Road safety targets
No quantitative target was set under the “Via Sicura” programme.
An evaluation of the Swiss road safety programme “Via Sicura” started in 2016. First results are expected mid-2017.
Bfu regularly publishes safety performance indicators, including daytime running lights, seat belt use and bicycle helmet use.
Recent safety measures (2014-17)
Since January 2013, a number of measures of the Swiss road safety programme “Via Sicura” came into force.
Road users
Speed management
-
A driver’s licence is revoked for a minimum of two years in cases of excessive speeding and for 10 years to life in the case of repeated offences.
Drink driving
-
As of 1 January 2014, novice drivers are subject to a zero alcohol limit for their first three years behind the wheel. The same restriction applies to all professional drivers.
-
A test on fitness to drive is mandatory for those convicted of offences such as driving under the influence of drugs.
-
From 1 October 2016 a breath alcohol test can be used as evidence in court. A blood sample is no longer necessary, even at high alcohol concentrations.
Infrastructure
-
A new norm “Single Accident Site Management” was published in 2015.
-
A new online database was activated in 2016 for an evaluation of infrastructural road safety measures. On http://bfumevasi.bfu.ch/mevasi/ (accessed 15 May 2017) local authorities record infrastructural measures (currently they can choose between 23 measures such as roundabouts, traffic lights or zebra crossings) in a GIS-based system. Accident data was linked to more than 1 100 measures and a statistical analysis on the safety effect of measures is undergoing. The first results will be published in summer 2017.
Vehicles
-
As of January 2014, daytime running lights are mandatory for all motorised vehicles. The bfu survey on daytime running lights was conducted in July 2014. Six months after daytime running lights became mandatory, 94% of vehicles were in compliance with the new regulation (compared to 68% in 2013). With 95% in 2015 and in 2016, the rate remained stable.
Recent and ongoing research
-
A study on the safety effects of accident recorders was published. (www.bfu.ch/de/bestellen/ alles#k=2.274, accessed 15 May 2017).
-
A report on road safety of children will be published in May 2017.
-
A study on single vehicle crashes of e-Bikes is underway.
References
Bfu (2015), SINUS 2016 Annual report, Swiss Council for Accident Prevention.
Bfu: Results of the safety performance indicators:
Bicycle helmet: www.bfu.ch/sites/assets/Shop/bfu_2.999.08_bfu%20survey%202016%20–%20Helmet%20 wearing%20reates%20among%20cyclists%20in%20road%20traffic.pdf (accessed 15 May 2017).
Seat belt: www.bfu.ch/sites/assets/Shop/bfu_2.999.08_bfu%20survey%202016%20–%20Seat%20belt%20use %20in%20Switzerland.pdf (accessed 15 May 2017).
Daytime running lights: www.bfu.ch/sites/assets/Shop/bfu_2.999.08_bfu%20survey%202016%20–%20 Daytime%20running-light%20usage%20rates.pdf (accessed 15 May 2017).
Niemann, S., C. Lieb and H. Sommer (2015), Nichtberufsunfälle in der Schweiz: Aktualisierte Hochrechnung und Kostenberechnung, bfu-Report 71, Bern, bfu – Beratungsstelle für Unfallverhütung.
World Bank (2017), “GDP (constant US$)”, World Development Indicators, http://databank.worldbank.org/data/reports.aspx?source=world-development-indicators (accessed 23 February 2017).
Websites
-
Federal Roads Office (FEDRO/ASTRA): www.astra.admin.ch (accessed 15 May 2017).
-
Swiss Council for Accident Prevention (bfu): www.bfu.ch (accessed 15 May 2017).
-
STATUS 2016: statistics on non-occupational accidents and the level of safety in Switzerland www.bfu.ch/sites/assets/Shop/bfu_2.265.08_STATUS%202015%20%e2%80%93%20Statistics%20on%20non-occupational%20accidents%20and%20the%20level%20of%20safety%20in%20Switzerland.pdf (accessed 15 May 2017).
-
Road accident data
-
Statistics: www.unfalldaten.ch (accessed 15 May 2017).
-
Geospatial data: https://map.geo.admin.ch/?topic=vu&lang=de&bgLayer=ch.swisstopo.pixelkarte-grau&layers= ch.astra.unfaelle-personenschaeden_alle&layers_timestamp=&catalogNodes=1318 (accessed 15 May 2017).
-
Note
← 1. All data stem from Federal Roads Office (FEDRO), Swiss Council for Accident Prevention (bfu) and IRTAD unless otherwise noted. For more information please contact: [email protected] or [email protected].