Chapter 36. Spain
This chapter presents 2015 road safety data for Spain along with provisional fatality data from 2016. It looks at trends in traffic and road safety from the years 1990 to 2015 and road user behaviour patterns with a special focus on the ageing population. Sections include data on speed, drink driving, drugs and driving, distracted driving, fatigue and seat belt usage. The chapter reviews Spain’s road safety strategy and national targets to 2020 and the progress achieved thus far. It also provides details of all recently implemented safety measures and current and ongoing research.1
Spain recorded one additional fatality in 2015 compared to 2014, maintaining its fatality rate of 3.6 per 100 000 inhabitants. Injury crashes have continued to rise over recent years, partly due to improved reporting by local police. Cyclists and car occupants benefitted the most from a reduction in fatalities in 2015, whereas the older population (over 65) are most at risk and comprised 30% of those killed. Spain has already achieved its fatality target for 2020 and is on track to achieve additional targets and indicators adopted as part of their road safety strategy.
Road safety data collection
Definitions applied in Spain
-
Road fatality: Person killed immediately or dying within 30 days as a result of a road crash.
-
Seriously injured: Any injured person hospitalised for more than 24 hours as a result of a road crash.
-
Slightly injured: Any injured person who was not hospitalised for more than 24 hours as a result of a road crash.
-
A MAIS 3+ injured person: Any person with road crash injuries for which the score on the Maximum Abbreviated Injury Scale is 3 or more.
Data collection
In Spain, there are several sources of information for traffic injury data. The police collect detailed information and data on the circumstances of the crashes using a dedicated form. Traffic police monitor the condition of those injured for 24 hours after the crash to classify the person as killed, seriously injured or slightly injured.
From 1993 to 2010, the procedure to estimate the number of people killed within 30 days among those initially recorded as seriously injured was based on adjusting the number statistically, after monitoring during 30 days a representative sample of seriously injured people. From 2011, the number of fatalities has been determined by linking the register of crashes reported by the police and the national deaths register, which includes the total number of deaths registered throughout the national territory.
Information on road crashes from hospital discharges and health sources and information reported by the police revealed important differences in 2014:
-
Figures from police records show that for each person killed there are 6 seriously injured and 69 slightly injured.
-
Figures from health sources show that for each fatality there are 11 people hospitalised and 282 slightly injured.
Since 2011 Spain has reported the number of MAIS injured based on hospital data. The methodology has recently been revised, in the framework of the work that European Member States are conducting with the aim of having harmonised data in the CARE database. Now the search for specific traumatic injury codes is performed not only among main diagnoses, but among the 14 diagnoses that may be recorded for each patient. As a result of that, whereas the overall number of crash-related inpatients has barely been altered, the number of identified MAIS3+ cases increased by 23%.
The procedure to obtain MAIS3+ consists of several steps:
-
A number of selection criteria are applied to hospital discharge data to obtain the records of those injured due to road traffic crashes.
-
International Classification of Diseases (ICD) codes, 9th revision, are converted into AIS codes using an algorithm provided by the European Commission.
-
Finally, the MAIS score is calculated.
Most recent safety data
Road crashes in 2016 – provisional data
Based on provisional data, the overall number of road fatalities within 24 hours – outside and inside urban areas – increased in 2016 by 3.8%. Figures of fatalities within 30 days are not yet available.
Road crashes in 2015
In 2015, the number of fatalities was 1 689, one more than in 2014. The police reported number of injured persons hospitalised decreased by 1%, and the reported number of non-hospitalised injured persons increased by 7%, partly as a result of better reporting by local police forces.
The number of reported injury crashes increased for the third consecutive year. In 2015 they were 6.8% higher as compared to 2104 and 14.3% higher as compared to 2010. The variation since 2010 depends on the type of road: -11.8% outside urban areas and +36.4% inside urban areas, suggesting again that the increase in the overall figure could be partly related to the improvement in crash reporting in urban areas.
Between 1990 and 2015 the number of fatalities and hospitalised injured fell by 81% and the number of non-hospitalised injured increased by 14%. Limiting the analysis to the period between 2000 and 2015, the number of fatalities fell by 71% and the number of hospitalised injured by 66%; the number of non-hospitalised injured increased by 2%.
Comparing 2015 to 2014, the biggest increases in the number of fatalities are observed in motorcyclists (15%), pedestrians (9%) and users with ages between 25 and 34, and between 75 and 84 years (increase of 12% in both groups).
Trends in traffic and road safety (1990-2015)
Traffic
Between 1990 and 2015, vehicle-kilometres increased by more than 80% on the Spanish State Road Network, which carries more than 50% of the overall traffic volume outside urban areas.
Overall, between 2000 and 2015, traffic volume outside urban areas increased by 11%. However, while the traffic volume effectively increased (by 23%) between 2000 and 2007, it decreased by 14% between 2007 and 2013 due to the economic downturn. In 2015, there was an almost 4% increase as compared to 2014. This is the second consecutive year showing an increase in traffic volume. GDP growth was 1.1% and 3.7% in 2014 and 2015, respectively.
The vehicle fleet nearly doubled between 1990 and 2011. In 2012 and 2013, the number of both new registered vehicles and the vehicle fleet slightly decreased. In 2015 and in 2014 there was an increase in the total number of vehicles as compared to the previous year.
In 2015, the progressive ageing of the vehicle fleet over recent years continued. The median age of the fleet was 11.5 years.
Road safety
Crashes and casualties
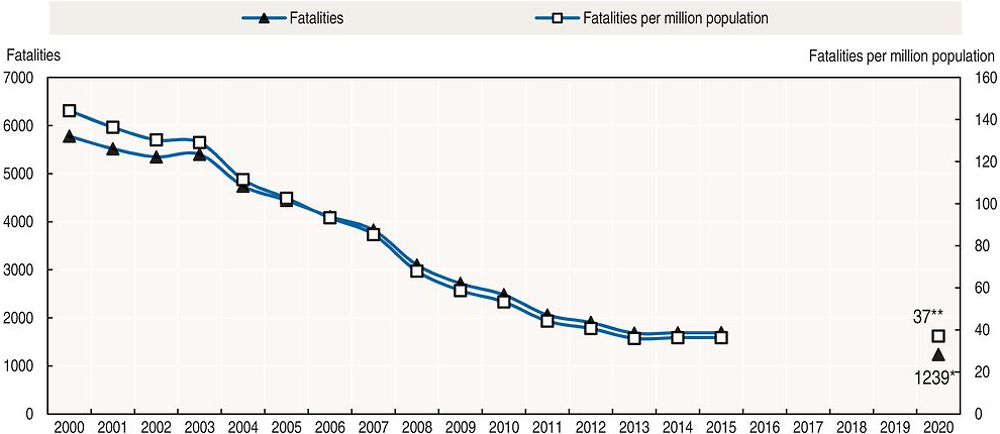
Since 1990, the number of road fatalities has decreased by more than 80%. Road fatalities peaked in 1989 with 9 344 deaths; since then they have decreased steadily and in 2013 they reached its lowest level. Since 2010, the number of fatalities has decreased by 32%; which is among the highest reductions among IRTAD countries.
In the past 15 years, improvements have been introduced in all elements of the road traffic system. Safety performance indicators related to drivers’ behaviour show that the incidence of speeding, drink driving and non-wearing of seat belts has been significantly reduced. This is probably related to improvements in education and training, increased enforcement, the penalty point system and the reform of the Crime Code.
The length of motorways and dual carriageways increased from 4 693 kilometres in 1990 to 15 336 kilometres in 2015. It is estimated that the fatality risk per unit exposure on these types of roads is about 25% of the corresponding value for rural roads. There have also been improvements in the system of traffic management, with the generalisation of traffic cameras, vehicle detectors and variable message signs. This has contributed not only to improvements in safety but also to reductions in congestion and travel times.
As for the vehicle fleet, important actions in the field of roadworthiness inspections and renewal schemes have been implemented. To collect exposure data, a new project on the development of national exposure indicators for each vehicle type (average and total kilometres driven), based on odometer readings from roadworthiness tests, has been implemented. Preliminary findings include the distribution of total vehicle-kilometres by type of vehicle (2014 data); passenger cars (71%), heavy goods vehicles (17%) and vans (8%) account for 96% of total vehicle-kilometres.
Rates
In 2015, the fatality rate per 100 000 inhabitants was at 3.6 and the fatality rate per 10 000 registered vehicles at 0.5. Since 1990, the risk of being killed on a Spanish road has been reduced by a factor of 7 to 11, depending on the indicator chosen.
There is no estimation of the total number of vehicle-kilometres on the entire network. It is therefore not possible to calculate the fatality risk expressed in terms of deaths per billion vehicle-kilometres.
Analysis of seriously injured data
In 2014, 19 507 people with road traffic injuries were discharged from Spanish private and public hospitals – including those who died in hospital.
When considering the number of people injured with a Maximum Abbreviated Injury Score of 3 or more (MAIS3+) in 2014 there were 6 343 people seriously injured, 4% less than the 6 613 seriously injured registered in 2013.
By age, the over 84 group suffered from more serious injuries, 51% of them showed MAIS3+ in 2014, followed by those aged 75-84 years, with 43%, and the 65-74 year age group at 41%.
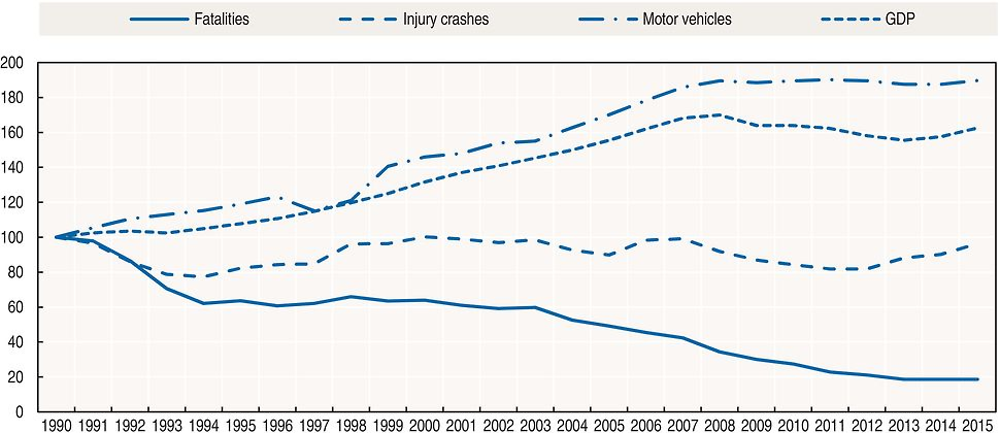
Source: World Bank (2017) (GDP; constant prices).
Road safety by user group
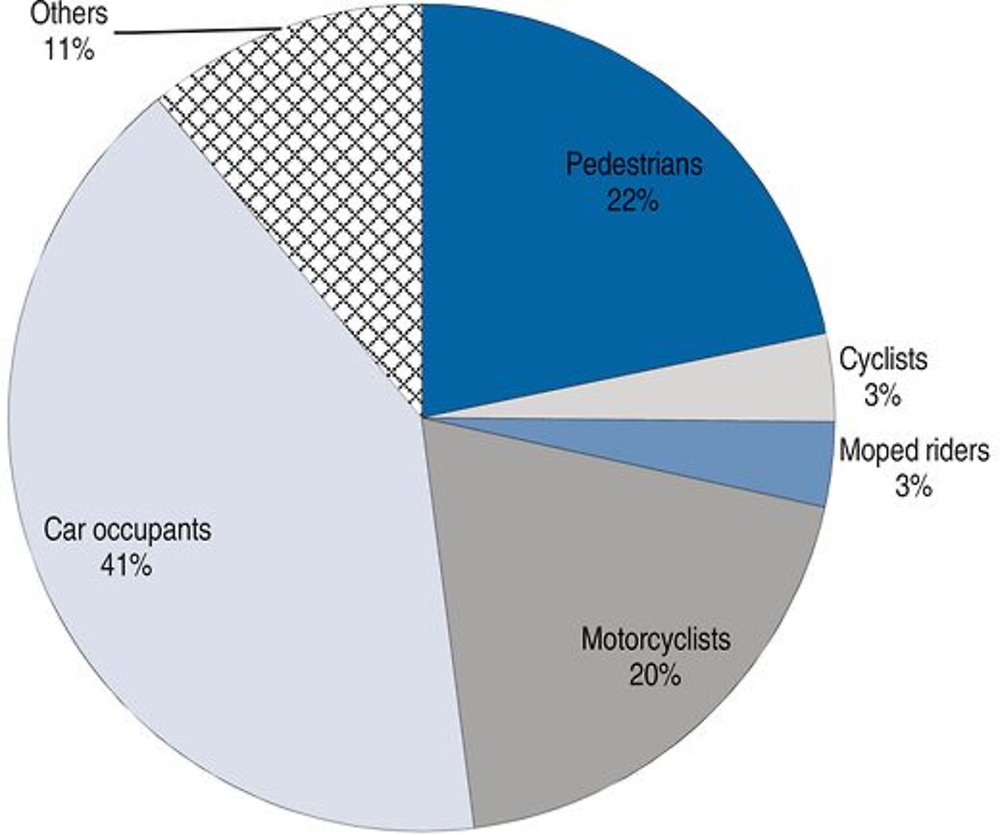
Since 1990, all user groups, but especially car occupants and moped riders, have benefited from improvements in road safety. The decrease in fatalities among moped riders is partly explained by the decrease in the number of sales (98% between 2000 and 2015).
Between 2003 and 2007, there was a very sharp increase (+72%) in the number of motorcyclists killed; this trend was broken in the following years, with reductions almost every year since. Between 2007 and 2015, the number of motorcyclists killed was reduced by 48%.
Since 2010, there has been improvement for all road user groups. In 2015, fatalities increased among pedestrians, moped riders and motorcyclists, and decreased among cyclists and car occupants.
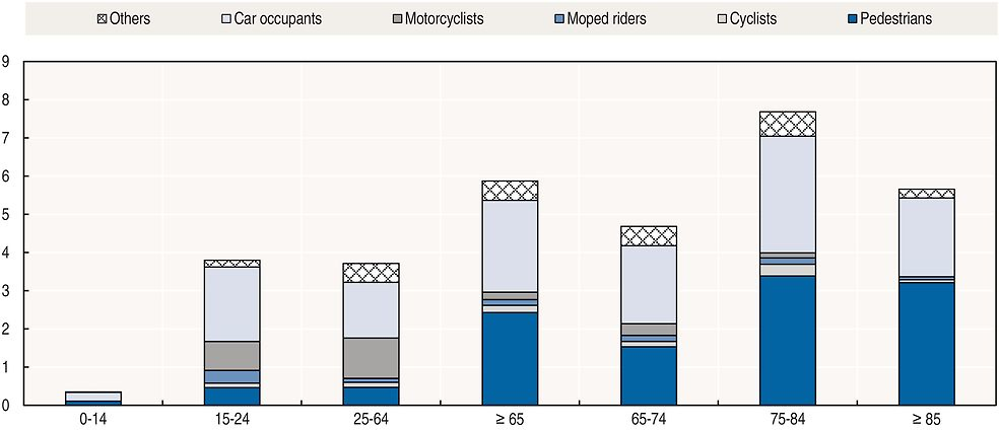
Road safety by age group
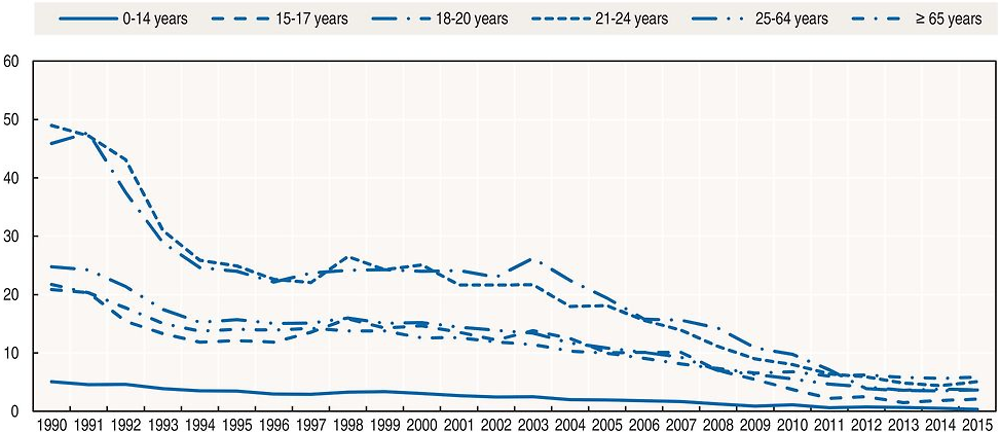
Since 1990, the reduction in fatalities has benefited all age groups, with the highest reduction of more than 92% for children and young people, while the reduction was much less remarkable for the over 65 age group (-55.5%).
In 2015, the over 65s accounted for 30% of fatalities. They are the age group most at risk in traffic, with a fatality rate above the average. Older people are particularly vulnerable as pedestrians.
In terms of the mortality rate per 100 000 inhabitants, progress has been most remarkable for young people aged 18-20, for which the rate has been divided by four since 2007. They now have a fatality rate similar to that of the general population.
The senior population has steadily been increasing in Spain. The share of persons aged 65 or over increased from 16.6% in 2010 to 18.5% in 2015. It is projected that this share will further increase to more than 32% by 2050 (Eurostat http://ec.europa.eu/eurostat/web/main/home).
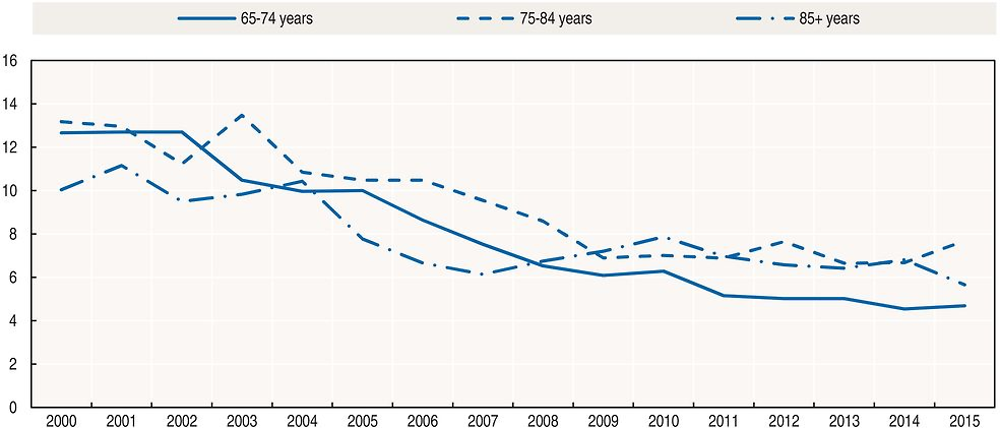
In 2015, senior citizens represented 30% of fatalities and 17% of seriously injured. The absolute number of fatalities among senior persons decreased from 529 in 2010 to 505 in 2015. This reduction of 5% is the lowest among all of the age groups; the overall reduction in fatalities for the whole population was 32% in the same period. The evolution within the groups of the senior population has not been homogenous: there were reductions of 16% in the group of 65-74 years and 8% in the group of more than 84 years, as opposed to an increase of 10% in the group of 75-84 years.
In a similar manner, the number of seriously injured among those aged 65 or over decreased by 1% in 2010-2015, as compared to a 21% reduction for the whole population.
Differences in reduction rates between fatalities within senior and general populations are reduced when we take into account the growth of the total number of senior inhabitants. Per million inhabitants, the number of senior persons killed decreased by 13% and the number of seriously injured by 10%; the rates for the general population were 32% and 21%, respectively.
The distribution of fatalities among the over 65s by user type shows only slight variations over recent years. About 40% of them are pedestrians and another 40% are car occupants. Changes are more visible when looking at the share of senior citizens in the general population of killed drivers and pedestrians. In 2015, senior citizens represented 19% of killed drivers – in 2010 the figure was 15% – and 57% of killed pedestrians – 45% in 2010.
Males represent 65% of fatalities and 55% of seriously injured senior persons.
In Spain, driving licences have an administrative validity of 10 years for drivers under the age of 65, and five years for drivers aged 65 or over. In the case of licences for heavy goods vehicles and buses, the validity is of five years for drivers under 65, and three years for older drivers. Shorter validity periods may apply if the driver suffers from conditions or deficiencies that, while not preventing them from driving, may worsen over time.
A mandatory medical check is required for renewing the driving licence. Minimum standards of physical and mental fitness from the European Directive 2006/126/EC apply. If, anytime between legal renewals, the road traffic authority has evidence that a driver no longer meets any of the requirements concerning physical and mental fitness, the driving licence shall be revoked.
Senior people are one of the target groups of the Spanish Road Safety Strategy 2011-20. Measures to improve their safety include information and awareness campaigns, improvement of medical checks, obtaining risk exposure data and promoting technical recommendations on safe urban design, including 30 km/h zones.
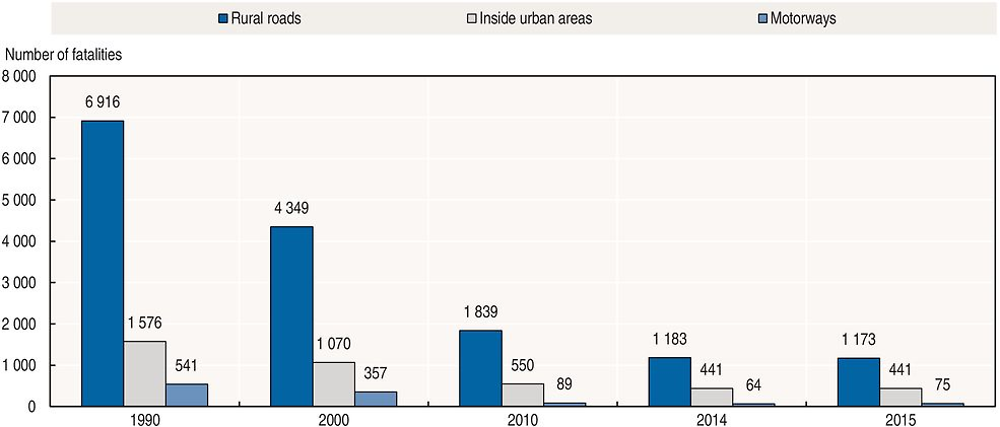
Road safety by road type
In 2015, 69% of fatalities occurred on roads outside urban areas. Approximately 30% of fatal crashes are run-off road crashes, typically on rural roads. Since 2000, while the whole road network benefited from significant improvements, the smallest progress was achieved on urban roads.
Risk exposure data is only available for roads outside urban areas. The number of vehicle-kilometres travelled on those roads decreased by 4%, while the number of fatalities decreased by 35%.
Economic costs of traffic crashes
Traffic crashes represent a significant cost for society, estimated at around EUR 5.1 billion (i.e. 0.5% of GDP), according to police-reported data. However, when the health system data are included, economic costs rise to EUR 9.3 billion (i.e. 1% of GDP). These estimates do not include property damage and administrative costs.
Costs are based on the calculation of a monetary value of statistical life, based on a willingness-to-pay approach (DGT, 2011). A value of preventing life of EUR 1.37 million (2015 prices) is used to compute the social costs of fatal road crashes in Spain (Abellan et al., 2011). Likewise, it is used to assess the benefits of road safety measures in terms of saved lives, making possible the economic evaluation of Spanish transport policies.
Recent trends in road user behaviour
Speed
In 2015, inappropriate speed was reported as a contributing factor in 9% of injury crashes and 20% of fatal crashes.
In 2015, 26.6 million vehicles were checked for speed (mobile checks), and 4.6% were driving above the limit (this proportion was 4.0% in 2014 and 6.5% in 2013).
The table below summarises the main speed limits in Spain.
Drink driving
In Spain, the blood alcohol content (BAC) limit is 0.5 g/l for general drivers and 0.3 g/l for novice and professional drivers.
Between 2001 and 2015, random preventive alcohol tests have been tripled and the positive tests have been reduced by almost a third. In 2001, the Traffic Division of the Civil Guard carried out 1.6 million preventive tests, and 5% of them tested positive. In 2015, 5.0 million preventive tests were carried out and 1.4% tested positive.
According to the National Institute of Toxicology, in 2015 the percentage of drivers killed who tested positive for the presence of alcohol was about 29%.
Drugs and driving
The Traffic Division of the Civil Guard carried out 76 040 saliva drug tests in 2015, as compared to 29 643 in 2014. Nearly 70 000 of the tests were preventive, with a rate of positives of 33%.
According to the National Institute of Toxicology, in 2015 the percentage of drivers killed who tested positive for the presence of drugs other than alcohol was about 14%.
Seat belts and helmets
Seat belt use has been compulsory in front seats outside urban areas since 1974 and in front seats inside urban areas and rear seats since 1992.
Children with a height of less than 135 cm must be seated on rear seats and use a dedicated child restraint system (CRS). In 2015, five of the 13 children (under 12) killed in road traffic as car occupants were not using a CRS or seat belt.
Helmet use is compulsory for riders of all powered two-wheelers. The helmet wearing rate is nearly 100%. Nevertheless, in 2015, 5% of motorcycle users killed outside urban areas were not wearing a helmet, and in urban areas 10% did not use a helmet. As for moped riders, among the 28 fatalities outside urban areas, four were not wearing a helmet. On urban roads, three out of 28 killed moped riders were not wearing a helmet.
Distraction
Distraction is a concurrent factor in 29% of injury crashes. It is a more prevalent issue outside urban areas (36% of injury crashes) than inside urban areas (25% of injury crashes). Factors that may affect attention are the use of mobile telephones, radios, DVDs, witnessing a previous crash, looking at the environment, absent-mindedness, and sudden illness or indisposition.
One of the main reasons for distraction is the use of the mobile phone while driving. In 2015, the Traffic Division of the Guardia Civil issued 94 986 tickets for the use of a mobile telephone while driving, which represented a decrease of 18% as compared to 2014.
Since 2002, the use of hand-held mobile phones while driving is forbidden. Only hands-free phones are permitted. As of 1 July 2006, driving while using hand-held mobile phones, GPS or other communication devices entails the loss of three points from the driving licence.
Sleepiness and fatigue
There is no estimate of crashes due to fatigue.
National road safety strategies and targets
Organisation of road safety
The agency that centralises most aspects of road safety is the Directorate-General for Traffic, which belongs to the Ministry of the Interior. The core responsibilities of the DGT are at a national level on all interurban roads, except for the Basque Country, Catalonia and part of Navarre. Key missions of the DGT include:
-
Issuing and renewing driving licences and vehicle authorisations, regulating and licensing private driving training schools, and supervising the Roadworthiness Inspection System.
-
Registering vehicles, drivers and traffic offences.
-
Controlling traffic and enforcing traffic law on all interurban roads.
-
Managing the Traffic Division of the Civil Guard (the police body in charge of traffic control and traffic law enforcement), with around 10 000 officers.
-
Centralising road traffic statistics and co-ordinating crash investigations.
-
Developing road safety strategies, plans and policies, in coordination with other relevant ministries or public bodies.
-
Supervising driving information and road safety education campaigns.
Road safety strategy for 2011-20
The Spanish Road Safety Plan 2011-20 was adopted by the Council of Ministers on 25 February 2011.
Road safety targets
The main objective of the Spanish Road Safety Strategy is to reduce by 2020 the rate of road fatalities to below 37 per million inhabitants. This target is aligned with the European objective of halving the number of people killed by 2020. A mid-term review of the strategy is currently being conducted. This review includes an evaluation of the measures taken in the first half of the decade and a proposal for revised targets.
In the framework of the Road Safety Strategy, a number of indicators and targets were adopted. These are being monitored annually.
1. National target to reduce by 2020 the rate of road fatalities to below 37 per million inhabitants.
2. EU target of halving the number of people killed by 2020.
Recent safety measures (2014-17)
Road safety management
-
The licensing system is being reviewed regarding both theoretical and practical tests with more focus on safe and responsible driving.
-
DGT is improving its crash data information systems with the progressive inclusion of new parameters, such as risk exposure, descriptive analysis and time trends. Specific measures include: adoption, collection and dissemination of MAIS3+ indicators; collaboration with regional governments in order to link police and hospital registers; collaboration with the Ministry of Justice to collect data from post-mortem analyses; collection of exposure indicators based on odometer readings and mobility surveys.
-
In 2014, the following changes to the Law on Road Safety were approved:
-
zero tolerance for alcohol, drugs and medicines at non-therapeutic doses
-
immobilisation of the vehicle if a child restraint system appropriate for the minor passenger is not used
-
prohibition of the use of radar detectors
-
introduction of procedures to facilitate cross-border exchange of information on road safety related traffic offences, following EU Directive 2011/82.
-
-
In 2014, a new code was passed regulating the communication of road crash data to the National Register of Victims of Road Crashes. It entered into force on 1 January 2015. This new rule was accompanied by the establishment of a new crash form to be used by traffic police officers at the scene of the crash.
-
In the area of criminal offenses related to road safety, a protocol was signed between the Ministries of Interior and Justice for the notification by electronic means of information on penalties and security and precautionary measures. This protocol will improve the enforcement of penalties implying the deprivation of the right to drive motor vehicles and mopeds.
-
Regarding sustainable mobility and the protection of vulnerable users, the DGT signed with the Network of Walking Cities an agreement for the development of joint activities to improve road safety, in particular relating to pedestrian safety. The agreement aims to coordinate the actions of the Directorate General for Traffic and the Network of Walking Cities in activities designed to promote pedestrian mobility through the exchange of information, experiences and knowledge, and technical advice and participation in conferences and other public events organized by both entities.
Road users
Speed management
-
In 2015, new measures for speed management were implemented. The operational margin of speed cameras was set at 7 km/h for speed limits up to 100 km/h, and 7% for higher speed limits.
-
Sections of rural roads with intensified enforcement through mobile speed cameras are now published on the website of the Directorate General for Traffic. Sections are selected on the basis of their actual speeds and crash records. The list is updated twice a year.
-
Computational methods are now applied to speed cameras, so that different types of vehicles can be distinguished, particularly heavy vehicles. This will allow the application of differential speed limits in order to identify speed violations.
-
New average speed controls have been put in place, particularly in rural roads.
-
In 2013, the Pegasus radar system was installed in one helicopter owned by the DGT, in order to monitor and enforce traffic on secondary roads. Four additional helicopters in 2014 and two in 2015 have been equipped with the Pegasus system.
Alcohol and drugs
-
There are strengthened controls for drink driving on rural roads.
-
Comprehensive checks are undertaken on rural roads to detect multiple offenders, i.e. drivers that commit more than one traffic violation at the same time.
-
Strengthened checks for drug driving. In 2015, almost 70 000 preventive tests were carried out by the Civil Guard outside urban areas, as compared to about 30 000 in 2014. Furthermore, the DGT provides local authorities with drug kits, and assists in the training of local police officers. This intervention is part of the Spanish strategy of zero tolerance for drugs and alcohol.
Seat belts
-
In 2017, 225 cameras were installed on roads outside urban areas for the automated enforcement of seat belt use.
Education and awareness
-
Week-long campaigns conducted in 2014, 2015 and 2016 with the Traffic Division of the Civil Guard and local police forces included: trucks and vans, school transport, speed enforcement, motorcycles and bicycles, use of mobile phones while driving, alcohol and drugs, helmets, seat belts and child restraint systems, rural roads, vehicle conditions and roadworthiness tests.
-
Letters sent to traffic offenders to inform them about their penalties are now accompanied by information about the risks associated with the traffic violations they committed.
-
Measures have also been developed in the field of mobile applications. The DGT launched an app called Comobity, which collaboratively connects road users among them and with their environment, in order to offer protection through advanced safety services and connected mobility. The app allows drivers, cyclists and pedestrians to inform other users of their presence, in order to take the necessary actions for safe driving.
Infrastructure
-
Heavy goods vehicles are being diverted from rural road sections, with a high risk of crashes involving this type of traffic, to high capacity roads.
-
A number of measures have been recently announced to improve safety on rural roads, including: improvement of safety on sections with high risk of overtaking related crashes, actuated junctions, implementation of panels informing drivers of their current speed, a new methodology for the identification of high risk sites, revision of criteria for the location of fixed speed cameras, signalling of sections with high cyclist exposure, installation of road stripes in sections with high risk of run-off crashes.
Vehicles
-
The content in the national vehicle register was expanded in 2014 to include more technical data and information relating to technological safety elements, interventions carried out at garages, changes to the vehicle and kilometres driven, the rescue sheet, active safety elements and the rating stars awarded at the European New Car Assessment Programme (EuroNCAP).
-
Regarding child safety, the Road Traffic Code was amended, so that all children under 135 cm tall must be seated in the rear of vehicles, and be using the appropriate child restraint system for their size and weight.
Post-crash measures
-
Implementation of the Road Traffic Accident Victims Unit in 2013 to support traffic casualties and their relatives and inform them about available private and public services.
Recent and ongoing research
With regard to road safety research, in 2015, 2016 and 2017 the second, third and fourth calls for proposals in the areas of traffic, mobility and road safety were made, under the Research Plan on Road Safety and Mobility. Some of the main areas of research are: measurement of exposure, effects of psychoactive substances on morbidity, rehabilitation programmes for repeated offenders in driving under the influence of psychoactive substances, the interaction of the road environment and the vehicle on driver behaviour, the applicability of new technologies or post-accident response, among others.
Below are some relevant research results published in 2015 and 2016 (all websites accessed 16 May 2017).
-
Abellán López et al. (2016), New motorcyclists protection system made in recycled rubber. (www.dynapubli.com/busqueda/nuevo-sistema-de-proteccion-de-motociclistas-fabricado-en-caucho-reciclado).
-
Alonso et al. (2015), Driving under the influence of alcohol: frequency, reasons, perceived risk and punishment.
-
Barrio et al. (2015), An example of the usefulness of joinpoint trend analysis for assessing changes in traffic safety policies (www.sciencedirect.com/science/article/pii/S0001457514003893).
-
Basagana et al. (2015), High Ambient Temperatures and Risk of Motor Vehicle Crashes in Catalonia, Spain (2000-2011): A Time-Series Analysis (http://ehp.niehs.nih.gov/1409223/).
-
Castillo-Manzano et al. (2015), Are traffic violators criminals? Searching for answers in the experiences of European countries (www.sciencedirect.com/science/article/pii/S0967070X14002510).
-
Castillo-Manzano et al. (2015), Can cars and trucks coexist peacefully on highways? Analyzing the effectiveness of road safety policies in Europe (www.sciencedirect.com/science/article/pii/S0001457515000214).
-
Castillo-Manzano et al. (2016), Exploring the relationship between truck load capacity and traffic accidents in the European Union. (www.sciencedirect.com/science/article/pii/S1366554516000223).
-
Dadashova et al. (2016), Methodological development for selection of significant predictors explaining fatal road accidents (www.sciencedirect.com/science/article/pii/S0001457516300288).
-
Herrero-Fernández (2016), The relationship between driving anger and risk could be non-linear. Towards a circumplex model of anger and risk on the road. (www.tandfonline.com/doi/abs/10.1080/02134748.2016.1143180).
-
Herrero-Fernández et al. (2016), Risky behavior in young adult pedestrians: Personality determinants, correlates with risk perception, and gender differences. (www.sciencedirect. com/science/article/pii/S1369847815001886).
-
Jiménez et al. (2015), Autonomous collision avoidance system based on accurate knowledge of the vehicle surroundings (www.crossref.org/iPage?doi=10.1049%2Fiet-its.2013.0118).
-
Jiménez-Mejías et al. (2016), Pedestrian- and driver-related factors associated with the risk of causing collisions involving pedestrians in Spain (www.sciencedirect.com/science/article/pii/S0001457516300926).
-
Ledesma et al. (2015), Measuring Individual Differences in Driver Inattention: Further Validation of the Attention-Related Driving Errors Scale (http://hfs.sagepub.com/content/57/2/193.long).
-
Machado-León et al. (2016), Socio-economic and driving experience factors affecting drivers’ perceptions of traffic crash risk (www.sciencedirect.com/science/article/pii/S136984781500203X).
-
Martínez Ruiz et al. (2015), Contribution of exposure, risk of crash and fatality to explain age- and sex-related differences in traffic-related cyclist mortality rates (www.sciencedirect. com/science/article/pii/S0001457515000196).
-
Martínez Ruiz et al. (2015), Factores asociados al riesgo de provocar una colision entre un ciclista y un peaton en Espana, 1993-2011 (www.gacetasanitaria.org/es/factores-asociados-al-riesgo-provocar/articulo/S0213911115000710/).
-
Melchor et al. (2015), Trends in mortality due to motor vehicle traffic accident injuries between 1987 and 2011 in a Spanish region (Comunitat Valenciana). (www.sciencedirect. com/science/article/pii/S0001457515000342).
-
Mueller et al. (2015), Health impact assessment of active transportation: A systematic review (www.clinicalkey.com/#!/content/playContent/1-s2.0-S0091743515001164?returnurl= http:%2F%2Flinkinghub.elsevier.com%2Fretrieve%2Fpii%2FS0091743515001164%3Fshowall%3Dtrue&referrer=).
-
Olabaria et al (2015) Effect of neighbourhood motorization rates on walking levels. (http://eurpub.oxfordjournals.org/content/25/4/740)
-
Olabarria et al. (2015), Head-on crashes on two-way interurban roads: a public health concern in road safety (www.gacetasanitaria.org/en/head-on-crashes-on-two-way-interurban/articulo/S0213911115000618/).
-
Pérez et al. (2015), Road traffic injuries: An example of public health (www.gacetasanitaria. org/es/lesiones-por-trafico-un-ejemplo/articulo/S0213911115001946/).
-
Pulido et al. (2016), The role of exposure on differences in driver death rates by gender and age: Results of a quasi-induced method on crash data in Spain. (www.sciencedirect. com/science/article/pii/S0001457516301749).
-
Rangel et al. (2015), Modeling the effect of contractual incentives on road safety performance (www.sciencedirect.com/science/article/pii/S0967070X15000360).
References
Abellan et al. (2011), “El valor monetario de una vida estadística en España Estimación en el contexto de los accidentes de tráfico”, DGT, Spain.
DGT (2016), “Main figures in road safety data, Spain 2015”.
World Bank (2017), “GDP (constant US$)”, World Development Indicators, http://databank.worldbank.org/data/reports.aspx?source=world-development-indicators (accessed 23 February 2017).
Websites
-
General Traffic Directorate: www.dgt.es (accessed 16 May 2017).
Note
← 1. All data stem from the Directorate General for Traffic (DGT) and IRTAD unless otherwise noted. For more information please contact: [email protected].