Chapter 24. Malaysia
This chapter presents 2015 road safety data for Malaysia along with provisional data for 2016. It looks at trends in traffic and road safety from the years 1990 to 2015 and road user behaviour patterns. Sections include data on speed, drink driving, drugs and driving, distracted driving, fatigue and seat belt usage. The chapter reviews Malaysia’s road safety strategy and national targets to 2020 along with recently implemented safety measures and current research.1
Following two years of consecutive decreases, there was a small increase of 0.5% in the number of reported fatalities in 2015, bringing the total to 6 706. Motorcyclists were the most affected, representing 62.7% of all fatalities whereas car occupants accounted for 20.3%. The mortality rate is high at 21.5 deaths per 100 000 inhabitants; however with the rapid motorisation of Malaysia the risk in terms of deaths per vehicle registered has decreased significantly. Provisional data from 2016 indicate a further increase in reported fatalities of 6.7% to 7 152.
Road safety data collection
Definitions applied in Malaysia
-
Road fatality: Death resulting from a road crash within 30 days after the crash.
-
Seriously injured person: Person injured as a result of a road crash as referred to in Section 320 of the Penal Code.
-
Slight injuries: Any injury not covered by the above definitions of a fatality or serious injury.
Data collection
The Royal Malaysian Police (RMP) is the agency responsible for collecting crash data. In Malaysia, all road crashes must be reported to the police. Since 1992 police have used a standardised form, POL27, to collect all relevant information for each crash. The form covers information on vehicles involved, environment, injury, location and background of the crash as well as information on the victims. Malaysia has begun work to evaluate underreporting.
In 2008, the Malaysian Institute of Road Safety Research (MIROS) developed a system called M¬ROADS to simplify data use by automating the data query request. M-ROADS serves as an intelligence system to provide road safety stakeholders with accurate, continuous and comprehensive information on road accidents. M-ROADS builds on input from existing nationwide road accident data collected by the traffic police to generate analysis and findings. A newer version of M-ROADS was recently launched in 2015 with many improvements such as a mobile application to ease data collection on site.
In addition, in 2015 the Malaysian Highway Authority (MHA), in close co-operation with MIROS, started an initiative to systematically collect all road traffic crash data that occur on main highways in Malaysia. These data only include information for main highways but nevertheless constitute an important added value to the road safety data collected in Malaysia.
Most recent safety data
Road crashes in 2016 – provisional data
Based on provisional data, there were 7 152 reported road deaths in 2016 a 6.7% increase compared to 2015.
Road crashes in 2015
In 2015, there were 6 706 reported road deaths, an increase of 0.5% when compared to 2014. Motorcyclists are the largest user group affected by road crashes.
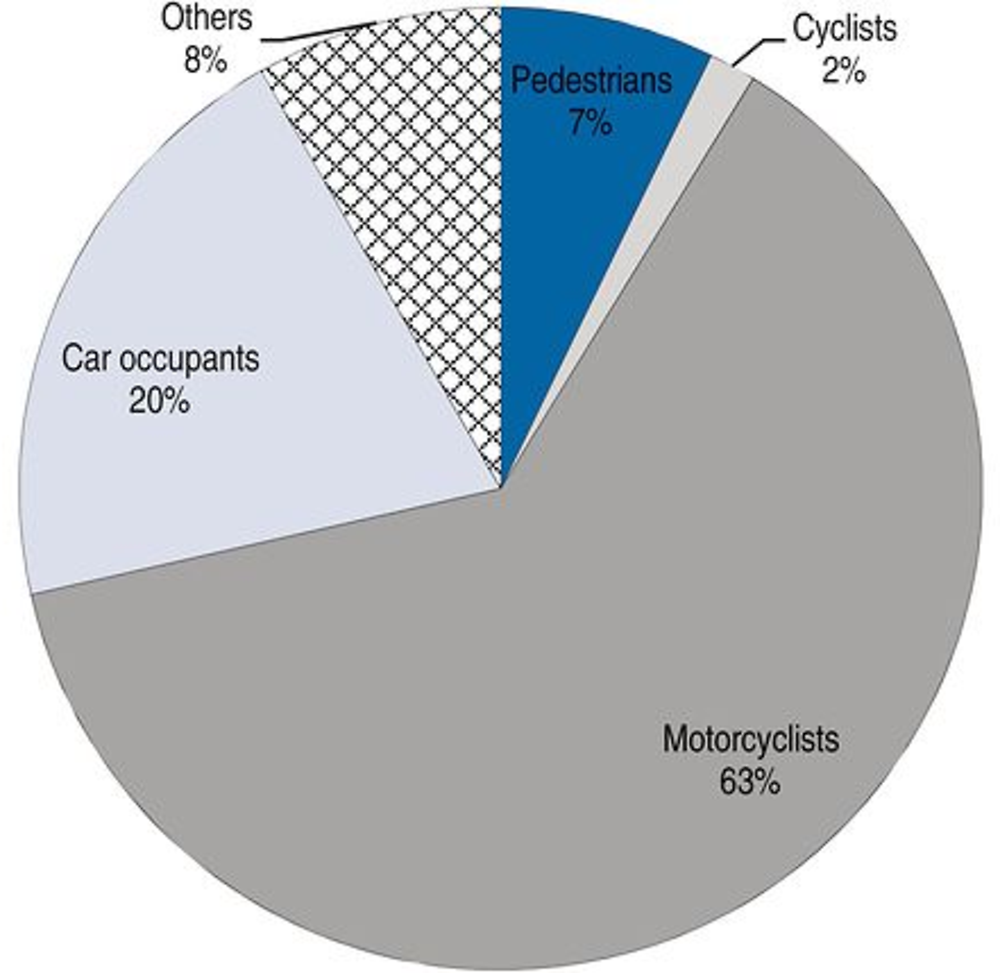
Motorcyclists are the most affected by road crashes. In 2015, they represented 62.7% of all fatalities while car drivers and passengers represented 20.3% of fatalities.
Trends in traffic and road safety (1990-2015)
Traffic
Since 2000 the number of registered vehicles has more than doubled, with powered two-wheelers representing nearly half of the fleet. The volume of traffic has followed a similar trend with a 5% increase for the year 2015 alone.
The motorisation rate in Malaysia is quite high with 843 registered motor vehicles per 1 000 inhabitants. This includes the motorcycle fleet.
Road safety
Crashes and casualties
Between 2004 and 2012, fatalities increased every year. For the first time a decrease was observed in 2013 and was confirmed in 2014. However, in 2015 the number of fatalities increased, though slightly by 0.5%.
Rates
The mortality rate is high (21.5 road deaths per 100 000 inhabitants in 2015). However, the risk in terms of deaths per distance travelled or per registered vehicle has decreased significantly since 2000, due to the large rise in motorisation in Malaysia.
Between 2000 and 2015, the death rate in terms of deaths per 100 000 inhabitants declined by 17%, as a result of rapid growth in the population. Risks expressed in terms of deaths per 10 000 registered vehicles decreased by 54%.
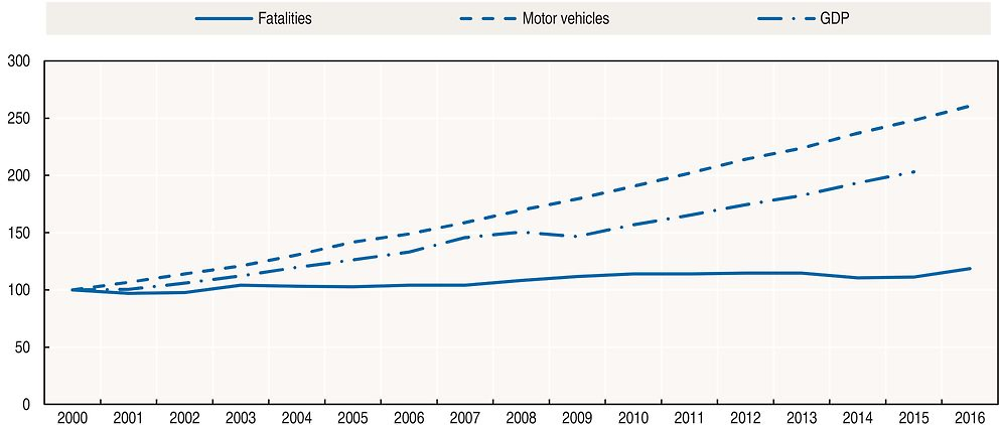
Source: World Bank (2017) (GDP; constant prices).
Road safety by user group
In 2015, motorcycles represented 46% of the fleet but accounted for 63% of road deaths. Between 2000 and 2015 the number of motorcyclists killed increased by 19%.
In 2015, the situation deteriorated for all road users except cyclists, pedestrians and bus users. The number of pedestrians and cyclists killed respectively decreased by 6.4% and 13.7% as compared to 2014. The number of bus occupants killed decreased by 46%. There was a 7% increase in the number of car occupant deaths.
Road safety by age group
Over the past 10 years the fatalities distribution by age show the highest number of fatalities among young people aged 16 to 25. However, in 2015, the fatalities among this age group decreased by 12.9% as compared to 2014 and 18% as compared to 2012.
The young (18-20) and the senior population (above 65) have the highest fatality rate, about 30 deaths per 100 000 inhabitants.
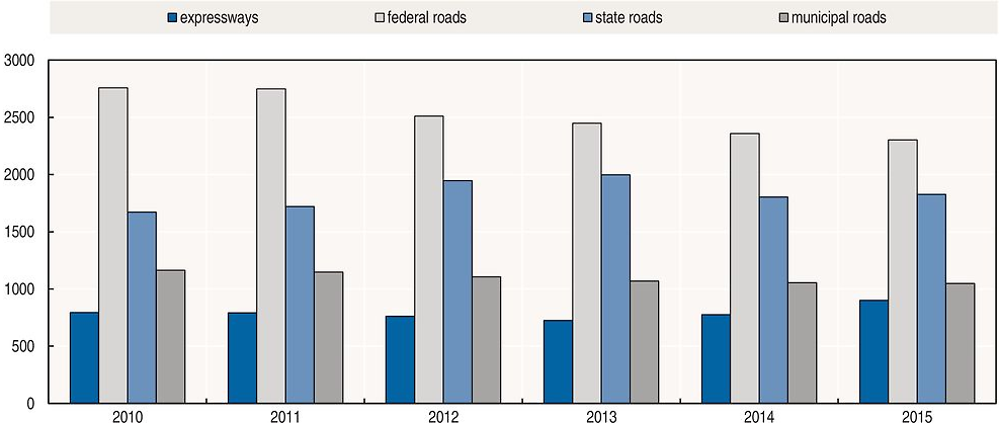
Road safety by road type
In Malaysia, roads are classified into five categories: motorways, federal roads, state roads, municipal roads and others. The number of fatalities on federal roads is the highest, followed by state roads. Based on police reported data, 86% of fatalities occurred outside urban areas.
Economic costs of traffic crashes
Traffic crashes represent a significant cost for the Malaysian society. Based on a willingness-to-pay estimation, each year traffic crashes cost around 1.7% of national GDP. The statistical value of life in Malaysia is RM 1.3 million, around EUR 330 000 (Nor et al., 2003; Mohd et al., 2011).
Recent trends in road user behaviour
Speed
Based on the MIROS study on contributing factors, speeding is one of the main causes of road crashes. The table below summarises the main speed limits in Malaysia.
A study undertaken in 2015 (Firdaus et al., 2015) shows that the compliance by Malaysian drivers to the 90 km/h posted speed limit on rural roads varies from 53% to 90%.
Another study in one state in Malaysia concluded that more than 50% of drivers ignored speed limits of lower than 90 km/h especially during off-peak periods. The study also found that more than 70% of drivers complied with the speed limit of 90 km/h or higher. Most of the non-compliant drivers were observed during the period after midnight until early morning (Othman, 2015).
Drink driving and drugs and driving
In Malaysia, according to the Road Traffic Act, it is an offence to drive a vehicle with a blood alcohol content (BAC) over the legal limit of 0.8 g/l.
Islam is the state religion in Malaysia and around 60% of the population is Muslim. Alcohol is available at licensed outlets for the consumption of non-Muslim citizens. Police-reported data indicate that drink driving is not an issue in Malaysia, with less than 0.5% of drivers in fatal crashes testing positive for blood-alcohol content.
Fatigue and sleepiness
Information on fatigue is not available from the national crash database collected by the police. A cross-sectional study conducted in urban areas of West Malaysia assessed drivers’ conditions in terms of fatigue, sleep quality and risk of Obstructive Sleep Apnoea (OSA). The study revealed that out of 130 drivers, 17.7% were fatigued, 34.7% had poor sleep quality and 14.6% fell into the category of those at high risk from OSA. The study also found that use of medication and neck circumference were the most significant factors contributing to fatigue (Ilhamah et al., 2015).
Seat belts and helmets
Seat belt use has been compulsory in front seats since 1978 and in rear seats since 1 January 2009.
The compliance rates among drivers and front passengers are, respectively, about 85% and 75%. Awareness of the regulation is high. The compliance rate for rear seats was 40% shortly after the law came into force in 2009 but is now declining. Following intense enforcement activities in February 2012 the seat belt wearing rate for drivers increased to 91%. However, in 2015, the seat belt wearing rate for drivers was 83%, but only 10% for rear seat passengers.
In 2014, the seat belt wearing rate decreased for both drivers and passengers. The compliance rate among drivers and front seat passengers were 82% and 68% respectively, and the seat belt wearing rate for rear seats was 9% (Wahida et al., 2015). The study also shows that women were significantly more likely to wear seat belts compared to men in front seats and that drivers in urban areas were significantly more likely to wear their seat belts than those in rural areas.
A study was conducted in 2015 during one of the main festive season to assess overall use of CRS. Before the festive season the CRS usage is 3.3% and during the festive season it was at 7.6%. CRS use is extremely low but increases during the festive season. The odds ratio of child restraint use were 2 times higher during festive season compared to before festive season (OR = 2.2796; 95% CI = 1.3132, 3.957). The results indicate that enforcement during festive season has an impact on CRS use even if in small numbers. (Fauziana et al., 2017).
Helmet wearing has been compulsory for motorcycles since 1973. However, there is still an alarmingly high rate of motorcyclist fatalities due to head injuries. In general, helmet wearing rates are higher in urban areas than in rural areas. A nationwide study in 2015 concluded that the helmet wearing rate is high (94.40%) and the rate of proper helmet wearing is acceptable at 77.05% (Rabihah et al., 2015).
Another study conducted during one of the major festive seasons examined helmet wearing rates. The study found that from the 1 712 riders observed that wore helmets, 86.6% were properly worn and correctly fastened, 6.1% were loosely attached and 7.3% riders wore their safety helmets completely unfastened (Fauziana, L. et al., 2017).
Distraction
A cross-sectional descriptive study was conducted in 2015 to identify road users’ perceptions and behaviour concerning mobile phone use while driving. It found that 61.9% of respondents used a mobile phone while stopped at red lights, about 53.6% while in a traffic jam and 43.4% while driving.
The findings show that drivers generally agreed that mobile phone use while driving can affect their driving behaviour and cause harm to themselves and others. The self-reported study also indicated that only 4% of respondents claimed to have been involved in a road crash caused by mobile phone use while driving (Aini and Sharifah, 2016)
National road safety strategies and targets
Organisation of road safety
The Road Safety Department of the Ministry of Transport is the lead agency for road safety in Malaysia. The Malaysian Institute of Road Safety Research (MIROS) provides support by conducting road safety research to assist in elaborating strategies to reduce road traffic deaths.
The other main stakeholders involved in road safety in Malaysia are principally the Royal Malaysian Police, the Public Works Department, the Road Transport Department, the Malaysian Highway Authority, the Ministry of Transport, the Ministry of Health, the Ministry of Education, the Land Public Transport Commission and other road-related agencies. In addition, several non-governmental organisations are actively involved in road safety in Malaysia.
Road safety strategy for 2014-20
A new road safety plan was launched in 2014 and covers the period 2014-20. The plan is aligned with the Global Decade of Action for Road Safety and designed to:
-
increase efforts to reduce the number of traffic casualties
-
support the recommendations of the United Nations (UN) in the success of the Decade of Action
-
gain political support and adequate resources for highway security initiatives.
It is based on the five Pillars of the UN Decade of Action Plan:
Road safety targets
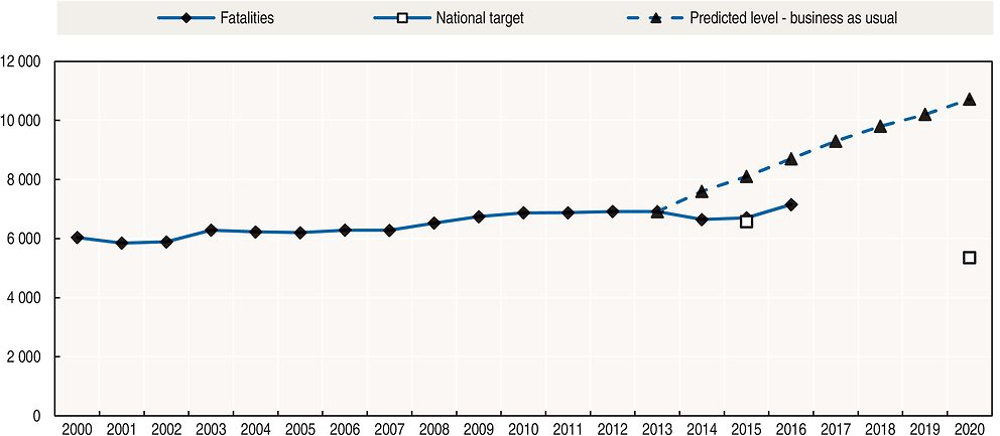
The plan has adopted the target set by the Global Decade of Action for Road Safety 2011-20, to reduce the predicted number of road deaths in 2020 by 50%.
Monitoring
Based on a report by MIROS, in the absence of a comprehensive road safety programme, there would be 8 760 road fatalities in 2015 and 10 716 in the year 2020. The target is therefore to have less than 5 358 deaths by 2020. This corresponds to a reduction of 22% in the number of road deaths when compared to 2010 level.
Recent safety measures (2014-17)
Road users
Child Car Seat Campaign
-
The Road Transport Department (RTD) recently launched a campaign to promote the use of child car seats. The campaign is an advocacy programme for RTD to encourage the use of child restraints before making it mandatory. The Deputy Transport Minister said the government wants to educate the public to use child restraining systems (CRS) in order to reduce fatalities involving children.
Vehicles
-
As of 1 July 2016, all trucks and trailers in Malaysia must be equipped with Retro-Reflective Markers (RRMs) in compliance with MS828:2011.
Recent and ongoing research
Refer to MIROS – Malaysian Institute of Road Safety Research: www.miros.gov.my (accessed 28 June 2017).
References
Aini Abu Bakar and Sharifah Osman@ Liew Shyuan Yei (2016), Using Mobile Phones while Driving as a Contributing Factor to Road Crashes among Motorists in Klang Valley: A Self-Reported Study, MRR No201, Kuala Lumpur: Malaysian Institute of Road Safety Research.
Fauziana, L. et al. (2017), Effectiveness of OPS Selamat 7/2015, An Evaluation Study, MRR No. 211, Kuala Lumpur: Malaysian Institute of Road Safety Research.
Ilhamah, O. et al. (2015), “Driver Fatigue and Associated Factors among Commercial Truck Drivers in Malaysia”, Proceeding Conference of ASEAN Road Safety, 3-6 November 2015, Kuala Lumpur.
Mohd, Y. et al. (2011), Malaysian Value of Fatal and Non-Fatal Injuries due to Road Accidents: The Willingness to Pay Using Conjoint Analysis Study, Proceedings of the Eastern Asia Society for Transportation Studies, Vol. 8.
Nor, G. and M. Faudzi (2003), “Value of Life Of Malaysian Motorists: Estimates From A Nationwide Survey”, Journal of the Eastern Asia Society for Transportation Studies, Vol. 5, October.
Othman (2015), Speed limits: To what extent are they obeyed?, Proceedings from Conference of ASEAN Road Safety, 3-6 November 2015, Kuala Lumpur.
Rabihah et al. (2015), Helmet Wearing Rate: A Study in Malaysian Primary Roads, Proceedings of Conference of ASEAN Road Safety, 3-6 November 2015, Kuala Lumpur.
Wahida, A. et al. (2015), “Safety Seatbelt Wearing among Vehicle Occupants in Malaysia: Status of 5-year implementation of Rear Seatbelt Regulations”, Fact sheet Vol. 1, www.miros.gov.my (accessed 28 June 2017).
World Bank (2017), “GDP (constant US$)”, World Development Indicators, http://databank.worldbank.org/data/reports.aspx?source=world-development-indicators (accessed 23 February 2017).
Websites
-
Road Safety Department: www.jkjr.gov.my (accessed 28 June 2017).
-
MIROS – Malaysian Institute of Road Safety Research: www.miros.gov.my (accessed 28 June 2017).
-
ASEAN New Car Assessment Program: www.aseancap.org (accessed 28 June 2017).
-
Road Safety Plan Malaysia 2014-2020 (accessed 28 June 2017; in Malaysian).
Note
← 1. Data included in this report are provided by the Malaysian Institute of Road Safety Research (MIROS) unless otherwise noted, and have not yet been validated by IRTAD. For more information please contact: [email protected].