Chapter 41. United States
This chapter presents 2014 road safety data for the United States along with provisional data from 2015. It looks at trends in traffic and road safety from the years 1990 to 2014 and road user behaviour patterns. This includes data on speed, drink driving, drugs and driving, distracted driving, fatigue and seat belt usage. The chapter reviews the United States’ road safety strategy and looks at recently implemented safety measures and research.1
The United States is a highly motorised country, reaching a high of 862 vehicles per 1 000 inhabitants in 2014. Vehicle miles travelled had also reached record levels by January 2016. In 2014, 32 675 people died in motor vehicle crashes in the United States, a 0.7% decrease over 2013. This equals a rate of 10.2 road fatalities per 100 000 inhabitants. All road user groups have benefitted from reductions in deaths, except pedestrians, who saw a 2.2% increase over 2013, continuing the increasing trend reported since 2009.
Road safety data collection
Definitions applied in the United States
-
Road fatality: A fatality that occurs within 30 days of a crash involving a motor vehicle travelling on a traffic way customarily open to the public.
-
Serious injuries: Incapacitating injuries, defined as severe lacerations, broken or distorted extremities, crush injuries, internal skull/chest/abdominal injuries, significant burns, unconsciousness and paralysis.
For general crash-related injury figures, the National Highway Traffic Safety Administration (NHTSA) does not differentiate between seriously and slightly-injured people. A crash is considered an injury crash if there were no fatalities, but someone involved in the crash – occupant or non-occupant – was reported as injured.
Data collection
State Police collect data on motor vehicle traffic crashes on specific roadways in each of the 50 states. Each state also has local police jurisdictions within counties, cities and towns that collect data on motor vehicle traffic crashes on the roadways not covered by the State Police.
The National Automotive Sampling System (NASS) consists of two sub-systems: the General Estimates System (GES) and the Crashworthiness Data System (CDS). Both sub-systems are probabilistic surveys designed to produce national estimates on motor vehicle traffic crashes annually.
The CDS is a nationally representative sample of police-reported motor vehicle traffic crashes in which at least one light motor vehicle (automobile, automobile derivative, minivan, van, pickup truck, or sport utility vehicle) was towed from the crash scene as a result of the crash.
The GES is a nationally representative sample of all police-reported motor vehicle traffic crashes occurring across the United States, designed to produce national estimates on general characteristics of motor vehicle traffic crashes.
In particular, GES data are obtained through a sample selected from all police-reported motor vehicle crashes. Although various sources suggest that about half the motor vehicle crashes in the country are not reported to police, the majority of these unreported crashes involve only minor property damage and no significant personal injury. By restricting attention to police-reported crashes, the GES concentrates on crashes of the greatest concern to the highway safety community and the general public.
Approximately 90 data elements are coded into a common format. To protect individual privacy, no personal information (name, address, specific crash location) is coded.
Strengths of the system:
-
Information is available on all types of motor vehicle traffic crashes and can aid policy makers in enhancing safety standards in motor vehicles.
-
It is possible to produce national estimates on crash characteristics.
Weaknesses:
-
A police accident report may not be complete when it is obtained by the GES, therefore some of the information may not be available.
-
Access to police accident reports is dependent on the co-operation of the police jurisdictions.
A challenge of collecting data at the federal level is obtaining and maintaining co‐operation with state and local police jurisdictions.
Injuries coded in the Maximum Abbreviated Injury Scale at three or more (MAIS3+) are coded in the CDS, not the GES, and are defined as serious injuries.
Data Modernization Project
In 2012, United States Congress appropriated USD 25 million to NHTSA to modernise NASS. The project “DataMod” was launched in January 2012 for implementation in January 2016. The goal of DataMod is to affirm NHTSA’s position as the leader in motor vehicle crash data collection and analysis, by collecting quality data to keep pace with emerging technologies and policy needs.
NASS was designed in the 1970s, and this 30-year old system needs to be updated to meet the data needs of the transport community that have increased and significantly changed over the last three decades. Congress was specific in their request and NHTSA is looking into the following items:
-
expanding the current sample size
-
expanding the scope of its data collection to possibly include large trucks, motorcycles, and pedestrians
-
assessing the need for more data from the pre-crash, crash, and post-crash phases
-
reviewing the crash data elements to be collected
-
soliciting input from interested parties, including suppliers, automakers, safety advocates, the medical community and research organisations.
More information on the Data Modernization project can be obtained at: www.nhtsa.gov/Data/DataMod/DataMod.
Most recent safety data
Road crashes in 2015 – provisional data
A statistical projection of traffic fatalities for the first nine months of 2015 shows that an estimated 26 000 people died in motor vehicle traffic crashes. This represents an increase of about 9.3% as compared to the 23 796 fatalities that were reported to have occurred in the first nine months of 2014. The fatality rate for the first nine months of 2015 increased to 1.10 fatalities per 100 million vehicle miles travelled (VMT), up from 1.05 fatalities per 100 million VMT in the first nine months of 2014. The third quarter of 2015 represents the fourth consecutive quarter with year-to-year increases in fatalities as well as in the fatality rate.
Road crashes in 2014
In 2014, 32 675 people died in motor vehicle traffic crashes in the United States, a 0.7 percent decrease from the 32 894 fatalities in 2013. This decline shows a continuation in the general decline in fatalities that started in 2006, except for the slight increase in 2012. The estimated number of injured people, which has seen subtle fluctuation in recent years, experienced a slight (and not statistically significant) increase. In 2014, an estimated 2.34 million people were injured in motor vehicle traffic crashes.
Fatalities declined from 2013 to 2014 in almost all segments of the population, passenger vehicle occupants, large goods vehicle occupants, cyclists, young drivers, and in alcohol-impaired driving fatalities; only pedestrian fatalities increased by 2.2%.
To respond to the increase in motor vehicle crash fatalities, a Summit was held in March 2016 as a call to action for highway safety practitioners and all those who are interested in saving livings and stopping injuries and crashes. NHTSA is leading the charge with a new strategy on human choices: “Driving Behavioral Change in Traffic Safety.” For more information see: www.nhtsa.gov/nhtsa/symposiums/march2016/index.html (accessed 10 May 2016).
Trends in traffic and road safety (1990-2014)
Traffic
Since 1990, the number of registered vehicles grew steadily reaching over 259 million in 2008. Even though the number of registered vehicles declined for the years 2009 and 2010, the number began rising again and the 275 million registered vehicles in 2014 has well surpassed the 2008 high. Vehicle ownership exceeds 860 vehicles per 1 000 inhabitants.
Between 1990 and 2007, VMT had grown at an annual average compound growth rate of about 1%. VMT declined in 2008 and reached in 2011, its lowest level since 2003. According to latest estimates from January 2016, VMT 2015 reached 3 131 billion miles, the highest level on record.
Road safety
Crashes and casualties
In the first decade of the 21st century, the United States averaged more than 40 000 deaths and more than 2 500 000 injuries on the roads each year. Road crashes generally are the leading cause of death for Americans aged 3 to 34. However, there has been some change with certain age groups from year to year more recently.
Between 1990 and 2014, the number of fatalities decreased by 27%, and most of the progress was achieved between 2006 and 2014. During the 1990s, there was little progress. Traffic fatalities have been declining steadily since reaching a near-term peak in 2005, and the reduction accelerated in 2008 and 2009. The magnitude of decline decreased in 2010 and 2011. In 2012, the US experienced the first increase in fatalities since 2005. In 2013 and 2014, the number of road deaths declined again, but was still above the low record achieved in 2011.
The reduction in fatalities in 2008-11 may be partly explained by a reduction in distance travelled as a consequence of the economic recession; but the overall decline in fatalities has been much greater than the reduction in traffic volume, indicating that recent safety measures promoted by the US Department of Transportation (DOT) have been effective.
Rates
The fatality rate per 100 million VMT fell to 1.08, the lowest since NHTSA began collecting fatality data through the Fatality Analysis Reporting System in 1975. In terms of population, the death rate in 2014 was 10.2 road fatalities per 100 000 inhabitants, a 1.4% decrease from 2013. Between 1990 and 2014, the death rate expressed in terms of deaths per 100 000 inhabitants, decreased by 43%, and the risk in terms of deaths per billion vehicle-kilometres declined by 48%.
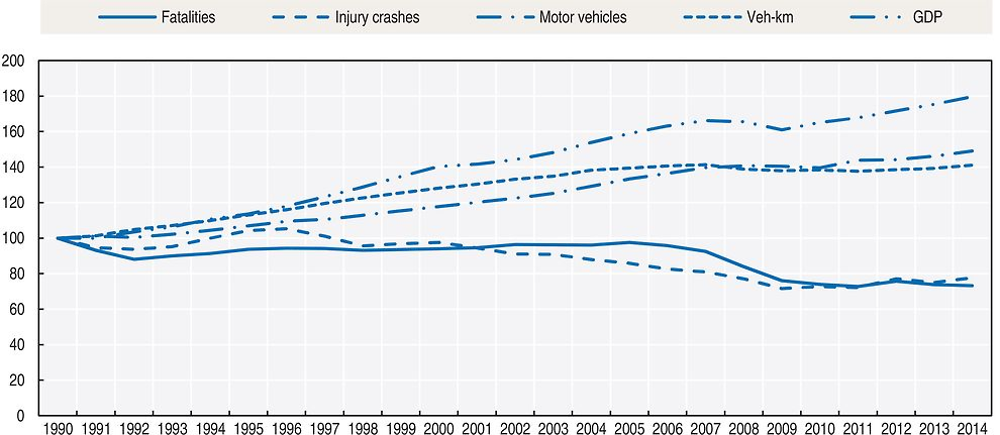
Source: World Bank for Gross Domestic Product (GDP; constant prices).
Road safety by user group
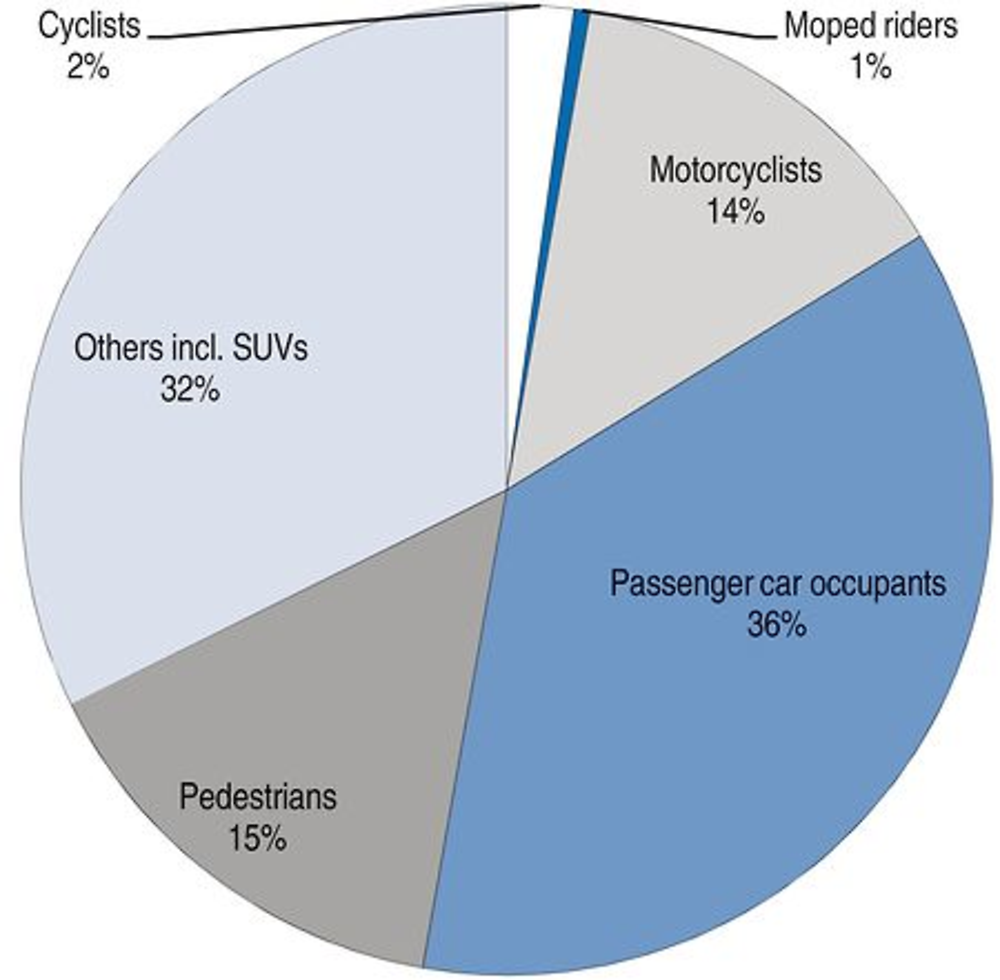
Since 1990, all road users except motorcycle riders have benefited from the improvement in road safety. Motorcycle rider fatalities (including mopeds) increased by 41% between 1990 and 2014. However, in 2014 one notable decrease was the 2.3% decrease in the number of motorcyclists who lost their lives on the roads, 106 fewer motorcyclists. This was the second consecutive year with a decrease in motorcyclist fatalities and the first consecutive decrease since the mid-1990s.
The number of passenger vehicle (car and light truck) occupants who died in 2014 is the lowest on record. Deaths among passenger vehicle occupants had shown a slight increase in 2012, the first since 2002, but in 2014, the 1.0 percent decrease from 2013 continued the general downward trend in this category.
Pedestrian fatalities increased by 2.2% from 2013 to 2014. It is the highest number of deaths since 2005 and continues a general increase in pedestrian fatalities starting in 2009.
In 2015, NHTSA released a report that estimates that vehicle safety technologies have saved over 613 000 lives from 1960 to 2012. These technologies include seat belts, air bags and electronic stability control, along with numerous other advances (NHTSA, 2015).
In 2014, passenger car occupants represented 36% of all fatalities, and motorcyclists 14%.
Road safety by age group
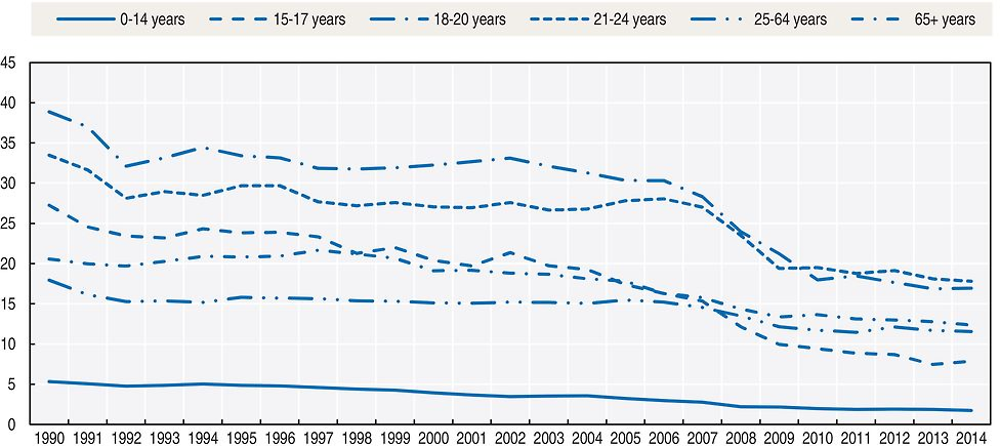
Since 1990, safety improvements have benefited all age groups, but the improvement was more marked for young people up to the age 20 than for older age groups. The Department of Transportation has been working diligently to address the safety risk of young drivers. This group, lacking experience that is acquired only over time, often poses a greater safety risk on the road. However, over the years, with the attention to young drivers and the introduction of graduated driver licensing, fatalities associated with young drivers have decreased. In 2005, there were 8 053 fatalities associated with young driver (16-20 years old) crashes as compared to 4 179 fatalities in young driver crashes in 2014.
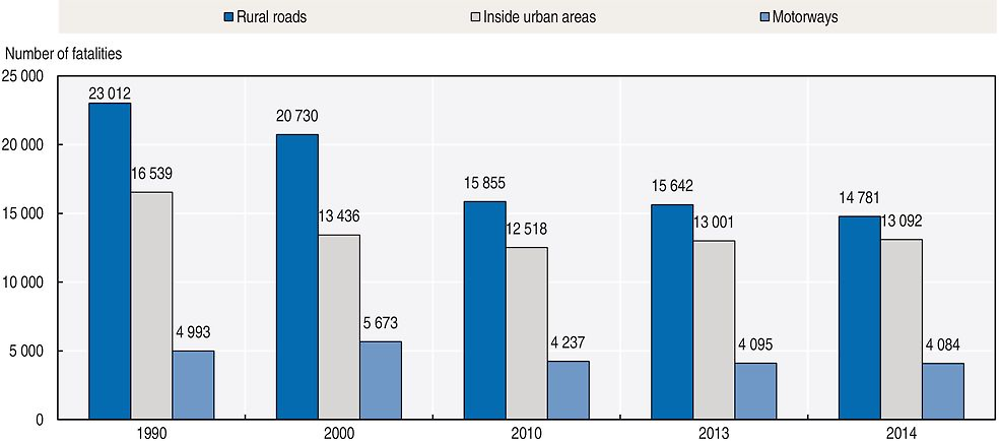
Road safety by road type
In 2014, less than half of fatalities occurred on rural roads. The number of fatalities on rural roads decreased from 15 642 in 2013 to 14 781 in 2014. There were 4 084 fatalities on motorways in the United States in 2014. This percentage has not changed from 2013 (12%).
Economic costs of traffic crashes
Based on a recent study published in 2014 (NHTSA, 2014), the economic costs of traffic crashes totalled USD 242 billion in 2010, representing 1.6% of the GDP of the United States. This represents the value of lifetime economic costs for 32 999 fatalities, 3.9 million non-fatal injuries, and 24 million damaged vehicles. This figure includes both police-reported and unreported crashes. When quality of life valuations are considered, the total value of societal harm from motor vehicle crashes in 2010 was USD 836 billion, nearly 6% of GDP.
Cost components include productivity losses, property damage, medical costs, rehabilitation costs, congestion costs, legal and court costs, emergency services such as medical, police, and fire services, insurance administration costs, and costs to employers.
Recent trends in road user behaviour
Speed
NHTSA considers a crash to be speeding-related if the driver was charged with a speeding-related offense, or if an officer indicated that racing, driving too fast for conditions, or exceeding the posted speed limit was a contributing factor in the crash.
Speeding is one of the most prevalent factors contributing to traffic crashes. In 2014, speed was a contributing factor in 28% of all fatal crashes, and 9 262 lives were lost in speeding-related crashes. Speeding-related fatalities decreased by 4% from 9 613 in 2013.
Speed limits in the United States are set by each state. The table below summarises speed limit ranges in the United States.
Drink driving
All 50 states, the District of Columbia and Puerto Rico have enacted 0.8 g/l BAC laws that make it a criminal offence to drive with that level of alcohol. All 50 states have enacted zero tolerance laws (primarily laws at 0.2 g/l or lower) that make it illegal for drivers under age 21 to have any detectable alcohol in their bodies.
Alcohol-impaired driving fatalities decreased by 1.4% from 2013 to 2014, accounting for 31% of 2014 overall fatalities. Alcohol-impaired driving fatalities have accounted for 30‐32% of all crash fatalities since 1995. An alcohol-impaired driving fatality is defined as a fatality in a crash involving a driver or motorcycle rider (operator) with a BAC of .08 g/dl or greater. Heavy goods vehicle drivers showed the greatest decrease in the percent of alcohol-impaired drivers involved in fatal crashes from 2013 to 2014. Alcohol-impaired drivers of light commercial vehicles and motorcycles also increased. There were 24% of alcohol-impaired drivers involved in fatal crashes in 2014 who had had a previous license suspension or revocation (within just the last 3 years, for both alcohol-related and non-alcohol-related offenses).
Drugs and driving
There is no federal law regarding driving under the influence of drugs. Drug laws are generally written to forbid driving with certain drugs in the system. However, not all states have drug laws. Given the differences in state collection and reporting of drug data, and the large amounts of missing data, NHTSA’s data on drugs and crashes should be considered with care. Of those drivers involved in fatal crashes in 2014 (44 583 drivers), 39% were tested for drugs and of those, 36% were reported as having drugs in their system at the time of the fatal crash.
Distraction
Distracted driving laws focus on the use of mobile electronic devices while driving. Each state sets its own laws regarding distracted driving. As of April 2015, 14 states and the District of Columbia prohibit drivers from using hand-held mobile phones while driving. In 38 states and the District of Columbia, all mobile phone use is banned for novice drivers, and 45 states and the District of Columbia ban text messaging for all drivers.
In 2014, 3 179 people were killed on US roadways and an estimated 431 000 were injured in motor vehicle crashes that were reported to have involved distracted driving, amounting to 10% of all crash fatalities and 18% of injury crashes. The distraction involved in fatal cases was a mobile phone 13% of the time (404 deaths), and for injuries the mobile phone was the distraction 8% of the time (33 000 injured).
Sleepiness and fatigue
For NHTSA, drowsy driving crashes are those in which the driver was reported, on official crash documents, as drowsy, sleepy, asleep or fatigued. NHTSA recognises the difficulty in collecting data regarding fatigue in crashes and offers these figures as the only known crash data regarding fatigue.
In 2014, 846 people lost their lives in crashes in which a driver was reported as drowsy at the time of the crash. This represents 2.6% of the fatalities in the year. This proportion has remained relatively consistent over time. In addition to those killed, an estimated 45 000 people were injured in crashes involving a drowsy driver in 2014. A total of 87 000 police-reported crashes throughout the year were estimated to be considered drowsy driving crashes.
Seat belts and helmets
Seat belt laws are divided into two categories: primary and secondary. Primary seat belt laws allow law enforcement officers to ticket a driver or passenger for not wearing a seat belt, without any other traffic offense taking place. Secondary seat belt laws state that law enforcement officers may issue a ticket for not wearing a seat belt only when there is another citable traffic infraction. As of April 2016, the seat belt law situation was as follow:
-
34 states, the District of Columbia, American Samoa, Guam, the Northern Mariana Islands, Puerto Rico and the Virgin Islands have primary seat belt laws for front seat occupants.
-
15 states have secondary laws. In many of these states, the law is primary for younger drivers and/or passengers.
-
New Hampshire has enacted neither a primary nor a secondary seat belt law for adults, although the state does have a primary child passenger safety law that covers all drivers and passengers under 18.
-
Rear seats: 28 states, D.C., Guam and the Northern Mariana Islands, have laws requiring belt use for all rear seat passengers. In 17 of these states, D.C., Guam and the Northern Mariana Islands, the law is primary.
Child passenger restraint laws vary based on age, weight and height. Most laws use restrictions in stages, starting with infants in rear facing seats, moving to toddlers in forward facing child seats, and then older children using booster seats until they reach a size or age for using an adult belt. All 50 states and the District of Columbia require child safety seats for infants and children fitting specific criteria, and all but two states require booster seats or other appropriate devices for children who have outgrown a child safety seat but are still too small to use an adult seat belt safely.
In 2015 seat belt use reached 88.5%. Seat belt use has been increasing since 1995, accompanied by a steady decline in the percentage of unrestrained fatalities during daytime. Seat belt use continued to be higher in the states in which vehicle occupants can be pulled over solely for not using seat belts (NHTSA, 2016b).
Currently, about half the states require helmets for all motorcyclists. Most other states require helmets for certain riders, and a few have no helmet law. The Global Health Security Agenda (GHSA) urges all states to adopt a universal motorcycle helmet law and vigorously enforce existing laws. As of April 2016, the situation regarding motorcycle helmet law was as follow:
-
47 states, the District of Columbia, Guam, the Northern Mariana Islands, Puerto Rico and the U.S. Virgin Islands have a helmet law for motorcyclists.
-
19 states, the District of Columbia, the Northern Mariana Islands, Puerto Rico and the U.S. Virgin Islands have a universal helmet law, requiring helmets for all riders.
-
The remaining 28 states and Guam require helmets for specific riders.
-
-
3 states (Illinois, Iowa and New Hampshire) do not have a motorcycle helmet law.
In 2014, the average wearing rate of a DOT-compliant motorcycle helmet meeting DOT safety standard FMVSS218 was 64%. Use of non-compliant helmets was 5% and 31% had no helmet. Among states with universal helmet laws, 89% were wearing DOT-compliant helmets with an additional 7% wearing non-DOT-compliant helmets. In states without universal helmet laws, 48% were wearing DOT-compliant helmets and an additional 3% were wearing non-compliant helmets.
National road safety strategies and targets
Organisation of road safety
The United States uses a “federalism” approach that divides the powers of government between the national (federal) government and state and local governments. Under federalism, each level of government has sovereignty in some areas and shares powers in others. At the national level, Congress passes the laws and assigns the funding that provides the overall structure for the DOT to carry out its safety mission. However, most traffic safety laws and policies are enacted and developed at the state level. For example, each of the 50 states has the authority to set its own speed limits, distracted driving rules, or seat belt use law.
Congress can influence the states by providing incentive grants if they enact certain laws that have been proven effective or penalties if they do not. It can also use performance results as eligibility criteria for grants in some cases. The DOT implements the grant programmes and provides guidance to the states on developing effective strategies that address their particular traffic safety challenges.
Within DOT, NHTSA has the lead role in reducing traffic crashes and fatalities.
In 2010, the DOT designated reducing roadway fatalities as one of its high-priority performance goals. Three agencies, the NHTSA, the Federal Highway Administration (FHWA), and the Federal Motor Carrier Safety Administration (FMCSA), work together to address multiple dimensions of roadway safety.
Road safety strategy for 2011-20
The number one priority of the DOT remains safety.
To align the programme and policy actions, the DOT has established four fatality sub measures: passenger vehicles, non-occupants, motorcycle riders, and heavy goods vehicle or bus related fatalities. The purpose of this approach is to more closely examine fatality rates of the different segments of highway users, focus the energy and resources involved and develop new strategies to reduce fatalities in each of the four areas.
Road safety targets
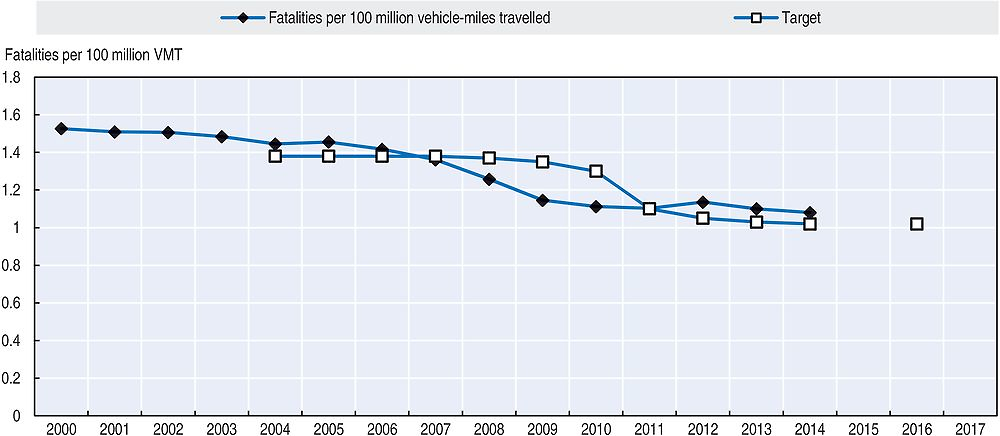
The DOT currently has performance targets to 2016 for the overall fatality rate and NHTSA and FMCSA have performance targets for each of the four sub measures. For 2016, DOT’s overall motor vehicle crash fatality rate target is 1.02 fatalities per 100 million VMT. The sub measure targets for 2016 are 0.15 fatalities per 100 million VMT for the non‐occupant fatality rate, 62 fatalities per 100 000 registrations for the motorcyclist fatality rate, 0.82 fatalities per 100 million VMT for the passenger vehicle fatality rate, and the large vehicle and bus fatality rate for 2016 is 0.114 fatalities per 100 million VMT.
The fatality rates are forecast through statistical methods for a number of years into the future in order to guide a plan of action for safety countermeasures. These forecasts use historical data combined with an evaluation of the existing countermeasures, trend data, and other societal factors that may affect fatality rates in the future.
Monitoring targets
The fatality rate per 100 million VMT decreased 1.8 % from 1.10 in 2013 to 1.08 in 2014. This fatality rate is the lowest fatality rate on record, but the performance target for the year was 1.02 and thus DOT did not meet the target.
Recent safety measures (2013-16)
Road safety management
-
The USDOT has pledged up to USD 40 million to one city to help it define what it means to be a “Smart City” and become the country’s first city to fully integrate innovative technologies – self-driving cars, connected vehicles, and smart sensors – into their transportation network. See more at: www.transportation.gov/smartcity (accessed on 10 May 2016).
-
The USDOT has launched the Department’s Safer People, Safer Streets Initiative. Over the course of the next year and a half, the Department will be doing more to address non-motorised safety issues and help communities create safer, better connected cycling and walking networks. See more at: www.transportation.gov/safer-people-safer-streets (accessed 10 May 2016).
Road users
Driver Medical Fitness for Duty
-
Commercial motor vehicle (CMV) drivers undergo a physical examination to confirm they are healthy enough to safely perform the demanding job of a CMV driver. See more at: www.fmcsa.dot.gov/medical/driver-medical-requirements/driver-medical-fitness-duty.
Vehicles
-
NHTSA and the Insurance Institute for Highway Safety (IIHS) announced on 17 March 2016 a historic commitment by 20 car manufacturers representing more than 99% of the US car market to make automatic emergency braking (AEB) a standard feature on virtually all new cars no later than 2022. NHTSA estimates that the agreement will make AEB standard on new cars three years faster than could be achieved through the formal regulatory process. During those three years, according to IIHS estimates, the commitment will prevent 28 000 crashes and 12 000 injuries. For more information see: www.nhtsa.gov/About+NHTSA/Press+Releases/nhtsa-iihs-commitment-on-aeb-03172016 (accessed 10 May 2016).
-
The focus of NHTSA’s research on advanced technologies is to evaluate potential benefits of new and existing in-vehicle technologies. This research supports Federal Motor Vehicle Safety Standards and safety defects investigations, advances knowledge about driver behaviour, and assists in the development of new vehicle technologies. The advanced technologies that are the subject of NHTSA’s research programme can be grouped into two categories: vehicle-based systems, such as radar-based collision warning systems; and cooperative vehicle safety systems that use vehicle-to-vehicle communication systems.
-
Increased use of electronic controls and connectivity is enhancing transportation safety and efficiency. These new technologies may result in new failure mechanisms and cyber vulnerability that are emerging challenges for auto safety. NHTSA recognised these new challenges by adding electronic systems safety as a new area of vehicle safety research.”
Roadway and Infrastructure
USDOT’s Federal Highway Administration has several programmes to address safety on different road types as well as intersection, pedestrian and cyclist safety. Some of the programmes are:
-
Highway Safety Improvement Program: http://safety.fhwa.dot.gov/hsip/.
-
Intersection Safety: http://safety.fhwa.dot.gov/intersection/.
-
Roadway Departure Safety: http://safety.fhwa.dot.gov/roadway_dept/.
-
Pedestrian and Bicycle Safety: http://safety.fhwa.dot.gov/ped_bike/.
-
Local and Rural Road Safety Program: http://safety.fhwa.dot.gov/local_rural/.
References
NHTSA (2016a), 2014 Motor Vehicle Crashes: Overview, NHTSA, Washington, DC, www-nrd.nhtsa.dot.gov/Pubs/812246.pdf.
NHTSA (2016b), Seat Belt Use in 2015 – Overall Results, NHTSA, Washington, DC, www-nrd.nhtsa.dot.gov/Pubs/812243.pdf.
NHTSA (2014), The Economic and Societal Impact of Motor Vehicle Crashes, 2010, NHTSA, Washington, DC, www-nrd.nhtsa.dot.gov/pubs/812013.pdf.
NHTSA (2015), Lives saved by vehicle safety and associated Federal Motor Vehicle Safety Standards, 1960 to 2012, Department of Transportation, Washington, DC, www-nrd.nhtsa.dot.gov/Pubs/812069.pdf.
Websites
-
National Highway Traffic Safety Administration: www.nhtsa.gov.
-
NHTSA Office of Vehicle Safety Research: www.nhtsa.gov/Research.
← 1. All data stem from the National Highway Traffic Safety Administration (NHTSA) and IRTAD unless otherwise noted. For more information please contact: [email protected].