Chapter 36. South Africa
South Africa joined the International Road Traffic and Accident Database (IRTAD) group in 2016. This chapter presents 2014 and 2015 road safety data for South Africa. It looks at trends in traffic and road safety from the years 1990 to 2014 and road user behaviour patterns. This includes regulations on speed, drink driving, drugs and driving, distracted driving, fatigue and seat belt usage. The chapter reviews South Africa’s road safety strategy and national targets, along with recently implemented safety measures and current research projects.1
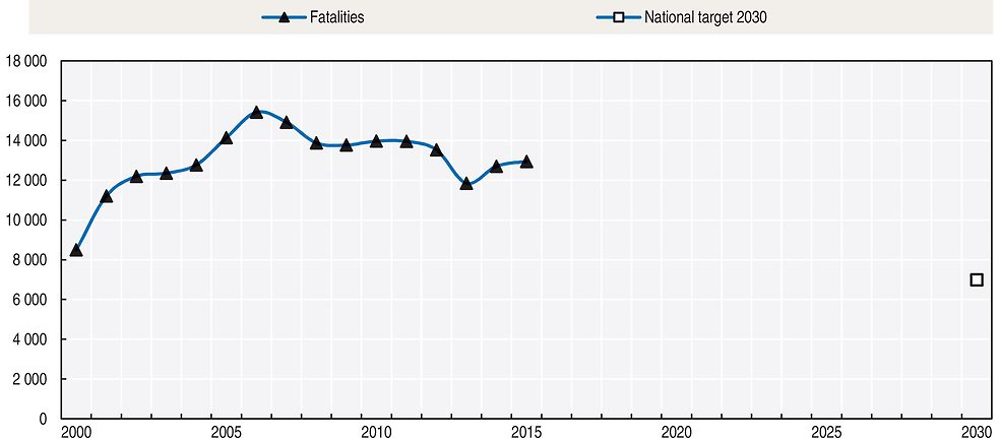
South Africa has made strides in reducing road crash fatalities since their peak in 2006. However, numbers still remain relatively high at 26 deaths per 100 000 inhabitants. Pedestrians and children are particularly affected. The fact that almost 60% of the road crash casualties were less than 35 years old and that there was a 2% increase in road fatalities between 2014 and 2015 has necessitated the need to focus more effort on road safety. Additional research is being undertaken to identify innovative ways of reducing road fatalities and injuries.
Road safety data collection
Definitions applied in South Africa
-
Road fatality: Any person killed during or immediately after a crash, or death directly attributable to a crash within 30 days of such a crash.
-
Seriously injured: Any person sustaining injuries to such an extent that hospitalisation is required. Serious injuries include fractures, concussion, internal injuries, severe cuts and lacerations, severe shock, etc. which require medical treatment, hospitalisation and/or confinement to a bed.
-
Slightly injured: Any person sustaining minor cuts and bruises, sprains and light shock which may be treated at the scene of the crash or at home.
Data collection
In South Africa, the police and traffic authorities collect motor vehicle crash data using Accident Report (AR) forms. The data collection procedure is conducted on behalf of the Road Traffic Management Corporation (RTMC), which has a legislative responsibility to report on the information.
Data is then sent to RTMC which generates, consolidates, interprets, analyses and compiles State of Road Safety reports. Fatal crashes are reported within 24 hours using quick response forms. South Africa records fatalities in accordance with the 30 day international standard.
The Culpable Homicide Crash Observation Report (CHoCOR) forms are used to collect fatal crash data on a daily basis. The South African Police Service (SAPS) is the primary source of the fatal crash data. RTMC receives a list of all recorded fatal crashes from SAPS as well as the CHoCOR forms from the various police stations. RTMC then captures, processes and verifies the data in order to compile a consolidated report. There are continuous engagements with provinces to validate the integrity of the submitted information.
The management of road traffic information across the local, provincial and national authorities continues to be ineffective. Police records alone are usually inadequate to carry out an analysis on the nature and consequences of serious injuries and other risk factors associated with crashes. To address this, initiatives are being undertaken to strengthen co‐operation between the bodies involved in road traffic data. In an effort to move towards an integrated road traffic information management, a new database is being developed in collaboration with the Council for Scientific and Industrial Research (CSIR) in partnership with Statistics South Africa (STATS SA).
There is currently a process underway to expand the data sources by obtaining road crash information from other stakeholders.
Information included in this report corresponds to the consolidated set of the SAPS data.
Most recent safety data
Road crashes in 2015 – final data
In 2015, 12 944 road fatalities were reported by RTMC, a 2% increase compared to 2014
The country experiences its worst road crash performance during the months of May, August and December. This is linked to school and work recess periods whereby there is significant amount of travelling. On the other hand, the lowest fatalities are recorded during the months of January, February and November.
Road crashes in 2014
In 2014, there were 12 702 reported fatalities, a 7% increase when compared to 2013.
Trends in traffic and road safety (1990-2014)
Registered vehicles
Since 1990, the vehicle fleet has increased by a yearly average of 3.6 %. The sharp rise in 1994 (16.9%) is related to political and economic changes in the country which led to increased purchasing power.
Passenger cars represent 65% of the motorised fleet, light duty vehicles 22%; trucks 3%, motorcycles 3% and buses and minibuses 3%
Road safety
Crashes and casualties
Between 1990 and 2000, the reported number of road fatalities fluctuated around 9 500 per annum. After 2000, the number increased significantly and reached a peak in 2006 with more than 15 000 reported road deaths. The country has since implemented a wide range of interventions which have produced positive results and a steady decline in fatal crashes.
Despite the recent progress, the number of traffic fatalities is still high, almost 13 000 people continue to die annually on South African roads. The high number of serious injuries from road crashes means that many survivors of severe crashes will never recover completely, often resulting in grave consequences for their quality of life and ultimately negatively affecting the economy.
Aware of the current road safety challenges, the Department of Transport aims, through its road agencies, to:
-
make roads and roadsides safer
-
strengthen traffic law enforcement
-
set safer speed limits
-
promote the development of safer vehicles
-
encourage people to behave more safely on the roads
It is recognised that the effect of the above-mentioned initiatives will plateau unless all stakeholders, communities and individuals support the implementation of these measures.
Rates
In 2015, there were 26 road deaths per 100 000 population. This is about 4 times higher than the average for IRTAD countries. Nevertheless, there has been gradual improvement since 1990, when the rate was of 36.5 fatalities per 100 000 population.
The fatality risk expressed in terms of road deaths per 10 000 registered vehicles was at 12.6 in 2014 and 11.1 in 2015. This is about ten times higher than the average for IRTAD countries. The rate has nearly halved since 1990 mainly due to the strong increase in the vehicle fleet.
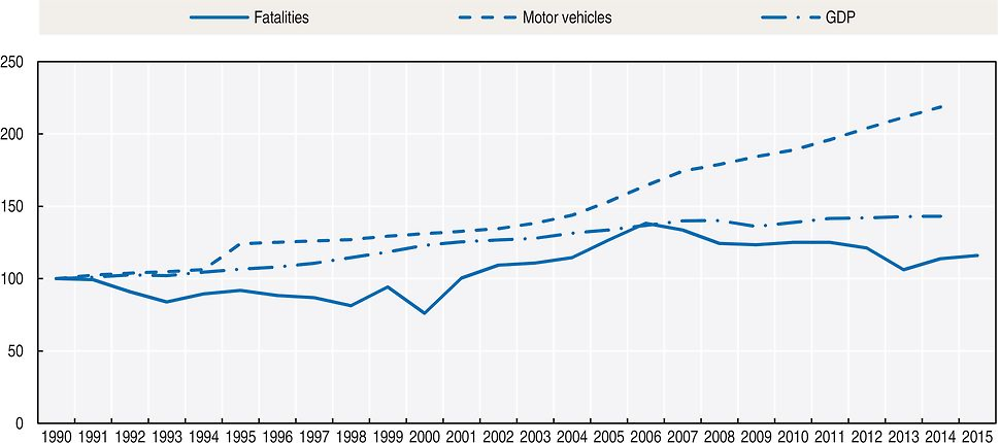
Source: World Bank for Gross Domestic Produce (GDP; constant prices).
Road safety by user group
Vulnerable road users account for approximately 40% of road crash fatalities. In 2014, pedestrians alone accounted for 35% of reported fatalities, with children particularly affected.
To enhance the safety of pedestrians and cyclists, the department is working towards the implementation by all provinces of the new Pedestrian Facility Guidelines and the new South African Road Safety and Speed Limits Manuals.
The government is also working very closely with the provinces to upgrade hazardous locations.
Road safety by age group
Children are very much affected by road crashes in South Africa and are particularly vulnerable as pedestrians. In 2013, 25% of pedestrians killed were children and young people under 15 years of age.
Economic costs of traffic crashes
South Africa is current conducting a study of the economic cost of crashes. Results will be published in September 2016.
Recent trends in road user behaviour
Speed
The table below summarises the main speed limits in South Africa.
Drink driving
In South Africa, the maximum authorised blood alcohol content (BAC) is 0.5 g/l. There is a lower limit of 0.2 g/l for professional drivers of public transport and heavy goods vehicles.
A crash is defined as alcohol-related when one of the participants has a BAC above the legal limit.
Based on crash reports from 2015, 5.2% of fatalities involved a driver with a BAC above the legal limit, and 2.8% involved a pedestrian with a BAC above the legal limit.
Drugs and driving
Driving while under the influence of intoxicating liquor or drugs having a narcotic effect, or with an excessive amount of alcohol in the blood or breath is prohibited. Drug driving measures are not yet enforced.
Distraction
The National Road Traffic Act states that no person shall drive a vehicle on a public road holding a cellular or a mobile telephone or any other communication device in one or both hands or with any other part of the body.
Sleepiness and fatigue
The estimation of fatalities due to sleepiness and fatigue is still a challenge in South Africa.
Seat belts and helmets
All new motor vehicles must be fitted with seat belts for all passengers. Since 2005, seatbelt use is compulsory for the drivers and all the passengers of cars and minibuses registered after 1 January 2006.
The driver is responsible for ensuring that infants are seated with an appropriate child restraint.
The seat belt wearing rate is very low, estimated in 2010 at 4.5% for the drivers and 5% for front seat passengers.
The wearing of a protective helmet on a motorcycle, motor tricycle, a motor quadricycle, and passenger in the side-car attached to a motorcycle or pedal cycle is compulsory for both the driver and the passenger.
Helmets are compulsory for cyclists. In practice, it is not enforced.
National road safety strategies and targets
Organisation of road safety
The RTMC, established in April 2005, is the lead agency for Road Safety in South Africa. It reports to the Department of Transport. Other major road agencies that also have a responsibility to contribute towards road safety are:
-
Road Accident Fund (RAF)
-
Road Traffic Infringements Agency (RTIA)
-
South African National Roads Agency (SOC; Limited) (SANRAL)
-
Cross-Border Roads Transport Agency (CBRTA)
In addition, the Department of Health, the Department of Justice and Constitutional Development, the Department of Roads and Public Works, the Department of Safety and Security, the Provincial Traffic Authorities, Statistics South Africa, and the emergency medical services are important stakeholders.
The RTMC’s shareholders are composed of provincial representatives from each of the nine provinces. The shareholder group also comprises a representative from the South African Local Government Authority (SALGA) with the Minister being the Chairperson.
The RTMC is responsible for:
-
enhancing the overall quality of road traffic service provision, in particular to ensure safety, security, order, discipline and mobility on the roads
-
protecting road infrastructure and the environment through the adoption of innovative practices and implementation of innovative technology
-
introducing commercial management principles to inform and guide road traffic governance and decision making in the interests of enhanced service provision
-
optimising the utilisation of public funds
-
regulating, strengthening and monitoring intergovernmental contact and cooperation in road traffic matters
-
improving the exchange and dissemination of information on road traffic matters
-
stimulating research in road traffic matters and effectively using the resources of existing institutes and research bodies
-
developing human resources in the public and private sectors that are involved in road traffic.
The Road Safety Advisory Council was established in 2014, with the main objective to provide strategic advice to the Minister of Transport. It is composed of representatives of different sectors (automotive industry, road engineering, NGOs, transport companies, motor insurance companies, civil society organisations, etc.).
Road safety strategy for 2006-15 and 2016-30
The road safety strategy “Arrive Alive” covered the period 2006 to 2015. It aimed at reducing road fatalities by 50% by 2015 with further reductions by 2020. It was articulated around the following key areas:
-
Enforcement – heavy, visible, with follow up of fines and identification of repeat offenders.
-
Education and communication – emotive advertisements, showing consequences of unsafe behaviour.
-
Engineering – low-cost engineering at hazardous locations with a strong focus on pedestrian protection.
-
Evaluation and research to ensure a data driven, scientifically based strategy.
-
Cooperation and coordination between all stakeholders.
In 2015, the RTMC together with the Department of Transport and its other road agencies, began developing the National Road Safety Strategy 2016-30 which is aligned with the United Nations Decade of Action pillars. The objective is to reduce fatalities and injuries by 50% from the 2010 base by 2030. The formulation of the National Road Safety Strategy is scheduled for completion in 2016. It will focus on the following priority areas:
-
road safety in schools
-
drink driving
-
safety of young people
A strategic plan for the period 2015-20 has been developed. The main measures are summarised in the table below.
Road safety targets
The main target of the 2006-15 strategy was to reduce by 50% the number of fatalities by 2015 from 2006 level.
The target of the 2016-30 strategy is to reduce the number of fatalities by 50% by 2030 from 2010 level.
Monitoring targets
The targets are constantly monitored by the Department of Transport – with contribution from its road agencies.
Recent safety measures (2013-16)
Road safety management
-
Establishment of the National Road Safety Steering Committee.
-
Appointment of Road Safety Ambassadors.
-
Establishment of the Road Safety Advisory councils.
Road users
-
Introduction and monitoring of safety performance indicators across the country which focus on drink driving, speeding as well as vehicle safety. These indicators are monitored monthly and reports are released quarterly.
-
Intensive road safety adverts on national television channels and radios.
-
In April 2015, the Minister of Transport approved the amendments to the Act and its Regulations which made it compulsory for children three years of age (or less) to be seated in a child seat when travelling in passenger cars.
Infrastructure
-
The implementation of the South African Road Assessment Programme (SARAP) started with the introduction of the programme to the engineers at a provincial level.
Recent and ongoing research
-
Distracted and Inattentive Driving Project
-
A distracted and Inattentive research project (RTMC, 2016) was published in March 2016. As a pilot project, a small sample size was used providing conclusions and recommendations which form the hypothesis for a larger study.
-
Indications are that the drivers did engage in secondary activities while driving. However, the frequency and the extent to which they engaged differed. Passenger-related distractions constituted the largest proportion of the total driving time. In other words, looking at, talking to or listening to a passenger was the activity that on average took the longest for all the drivers. Other secondary activities observed include using electronic devices, grooming, eating and person or object-related distractions. The important question to answer is what constitutes normal driving in South Africa and is it possible that distracted driving has become the norm rather than the exception.
-
Costing of Crashes
-
Phase 1 of the project entailed reviewing the methodology used in the previous Cost of Crashes in South Africa study which was published in 2004 (De Beer and Van Niekerk, 2004). Cornerstones of the framework included understanding what is available (inventory of data), understanding what the value of the available data is (valuation), how data is managed and applied as well as assigning accountability to entities responsible for the collection, management and use of the data. A key objective of the new methodology will be that it enables the user to consistently apply the crash costing methodology. The results should be of high integrity and quality.
-
The Phase 2 results (application of the methodology) will be published in September 2016.
References
Websites
-
Road Traffic Management Corporation: www.rtmc.co.za.
-
Department of Transport: www.transport.gov.za/.
← 1. The Road Traffic Management Corporation (RTMC) joined the International Road Traffic and Accident Database group in 2016. Data included in this report have not been validated by IRTAD. All data stem from RTMC. For more information please contact: [email protected]