Chapter 35. Slovenia
This chapter presents 2014 road safety data for Slovenia along with an overview of results from 2015. It looks at trends in traffic and road safety from the years 1990 to 2014 and road user behaviour patterns. This includes data on speed, drink driving, drugs and driving, distracted driving, and seat belt and helmet use. The chapter reviews Slovenia’s road safety strategy and national targets to 2022 and the progress achieved thus far. It also highlights the most recently implemented safety measures.1
Slovenia recorded a 14% decrease in road fatalities in 2014, with young people especially benefiting; only 5 fatalities occurred in the under 20 year-old group. However, Slovenia recorded an increase of 11% in 2015, with 120 deaths. New initiatives were implemented in 2015 focusing on enhanced safety for pedestrians, older drivers and those using school routes.
Road safety data collection
Definitions applied in Slovenia
-
Road fatality: Any person killed immediately or dying within 30 days as a result of a road crash.
-
Seriously injured person: Any person who sustains injuries from a road traffic crash entailing temporary or permanent health damage or temporary or permanent reduced ability to work.
-
Slightly injured person: Any person injured excluding persons seriously injured.
Data collection
In Slovenia, crash data are collected by the police, which is the main source of information for road fatalities and injuries. The police confirm information on the severity of injuries with the hospitals. But there is not as yet any procedure in place for linking data.
With support from the Institute of Public Health, the Traffic Safety Agency has started work on estimating the number of persons injured with a Maximum Abbreviated Injury Scale of 3 or more (MAIS3+), using the conversion tables provided by the European Commission to convert injury information based on the 10th revision of the International Statistical Classification of Diseases and Related Health Problems (ICD-10) into MAIS3+ data. Further work is still needed before Slovenia can publish MAIS3+ data.
Most recent safety data
Road crashes in 2015 – final data
In 2015, there were 112 fatal crashes and 120 persons were killed, 12 more than in 2014 (an increase by 11%). The number of people severely injured increased by 13% from 826 to 932.
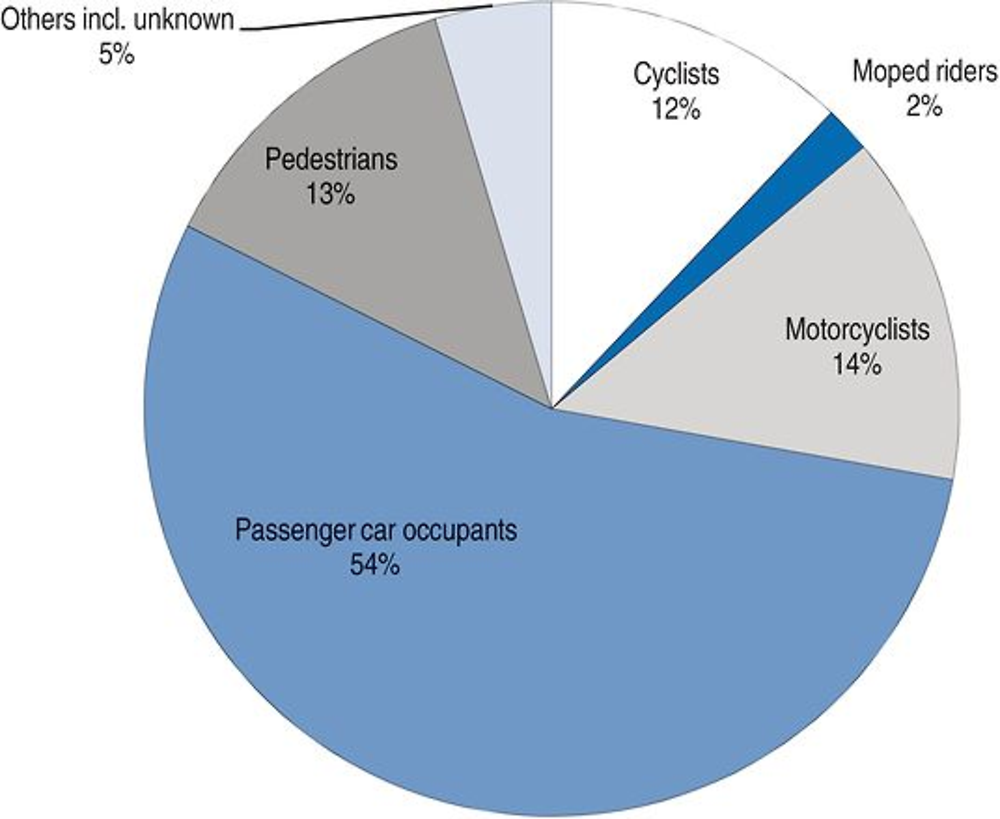
Several factors explain this negative trend, including a higher interaction between unprotected users and motorised road users in cities. Vulnerable road users (pedestrians, cyclists, powered two-wheeler riders) accounted for 47% of all fatalities in 2015. This is the highest share of vulnerable road users killed in the last five year period. There were 55 car occupants killed (46% of all fatalities), 25 motorcyclists (21%), 16 pedestrians (13%), 14 cyclists (12%) and 10 fatalities among other users.
Road crashes in 2014
In 2014, there were 108 fatalities on Slovenian roads, a 14% decrease from 2013. However, the number of persons severely injured increased by 17%. The reduction in fatalities mainly benefited motorcyclist riders and cyclists (19% fewer compared with 2013). The number of vulnerable road users killed decreased by 23%. Fatalities among car occupants increased by 5%.
Slovenia is on track towards the target set in the 2013-22 road safety programme.
Trends in traffic and road safety (1990-2014)
Traffic
Since 1990, traffic (in vehicle-kilometres) has more than doubled and the vehicle fleet has increased by 75%. In the last eight years, the number of registered motorcycles increased by 65%.
Road safety
Crashes and casualties
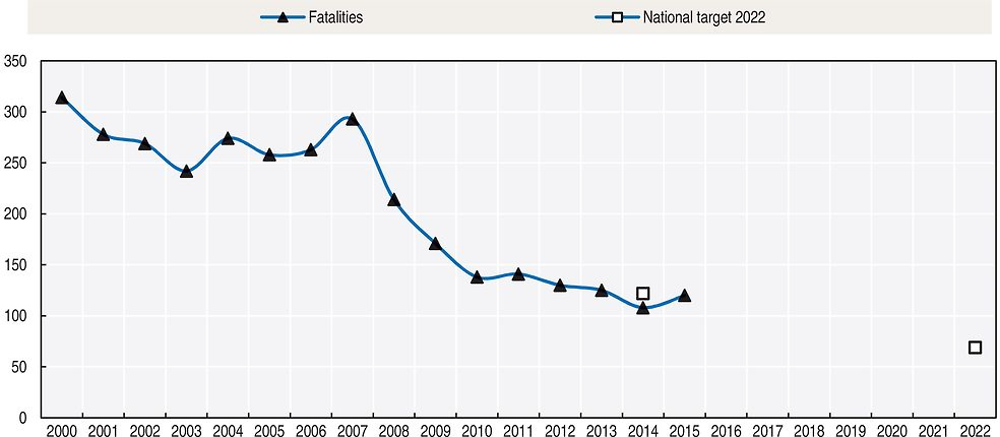
Fatalities peaked in 1979, when 735 people died on the roads. Since then the number of road deaths has steadily decreased, with a period of relative stagnation between 2002 and 2007. Fatalities declined noticeably from 2007 to 2010, probably due to the new motorway toll system, regular media campaigns promoting road safety and the Road Safety Act that came into force in 2008. From 2010 to 2014, the number of road fatalities decreased by 22%, from 138 to 108.
In 2013, Slovenia launched a new National Road Safety Programme 2013-22 with the goal of reducing the number of fatalities and severely injured by 50%.
Rates
Between 1990 and 2014, the mortality rate, expressed in terms of deaths per 100 000 inhabitants, was reduced by 80%. The fatality risk expressed in terms of deaths per billion vehicle-kilometres was reduced by 90%. In 2014, Slovenia had a mortality rate of 5.2 deaths per 100 000 inhabitants and a fatality risk of 6.1 deaths per billion vehicle-kilometres.
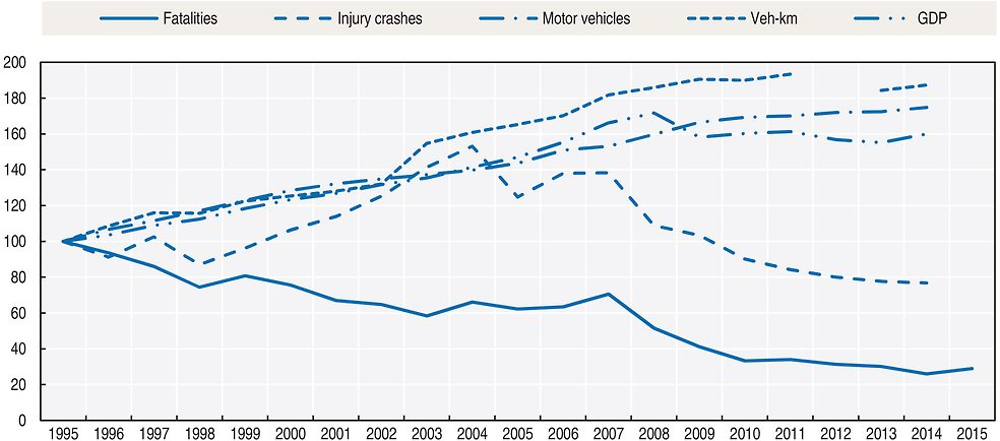
Source: World Bank for Gross Domestic Product (GDP; constant prices).
Road safety by user group
Since 2000, all user groups have benefited from improved safety, although the improvement has been modest for motorcyclists.
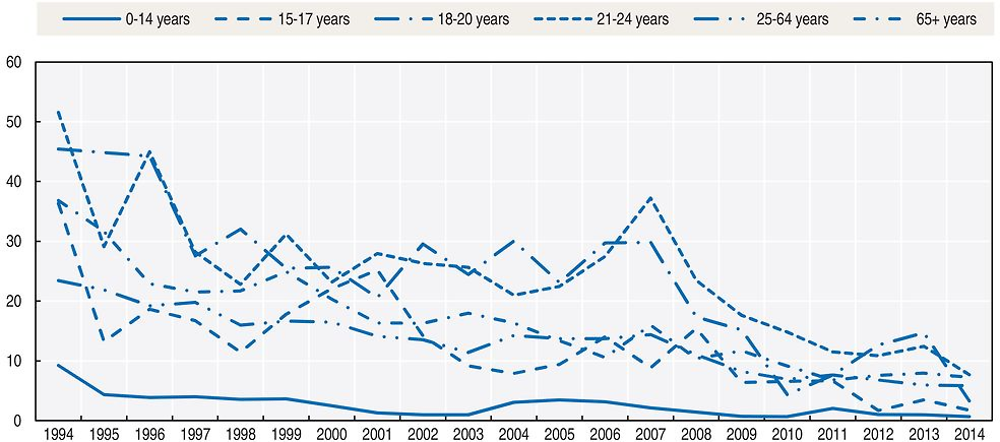
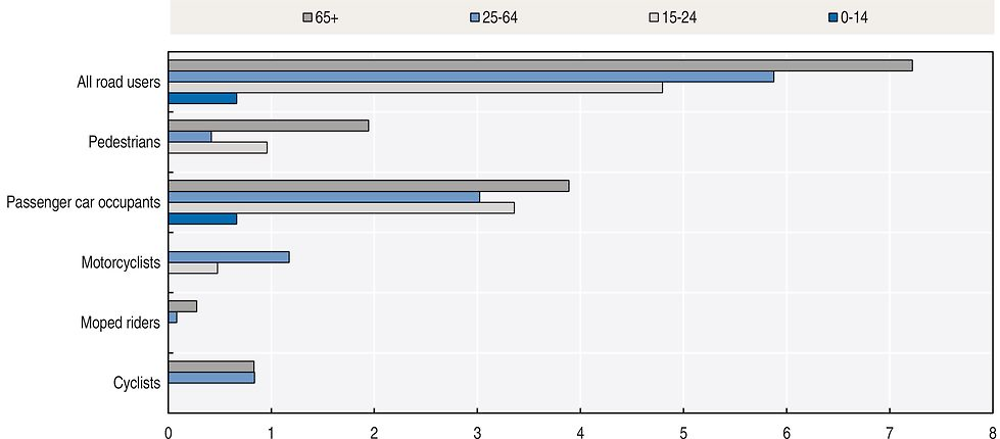
Road safety by age group
Since 2000, all age groups have benefited from the improvements in road safety, with the best results for children and young people (0-20).
In 2014, there was no road fatality among children aged five and under and for those between 10 and 14. There were only 2 road fatalities among the 18-20.
The senior citizen is now the age group the most at risk in traffic. They are particularly vulnerable as pedestrians.
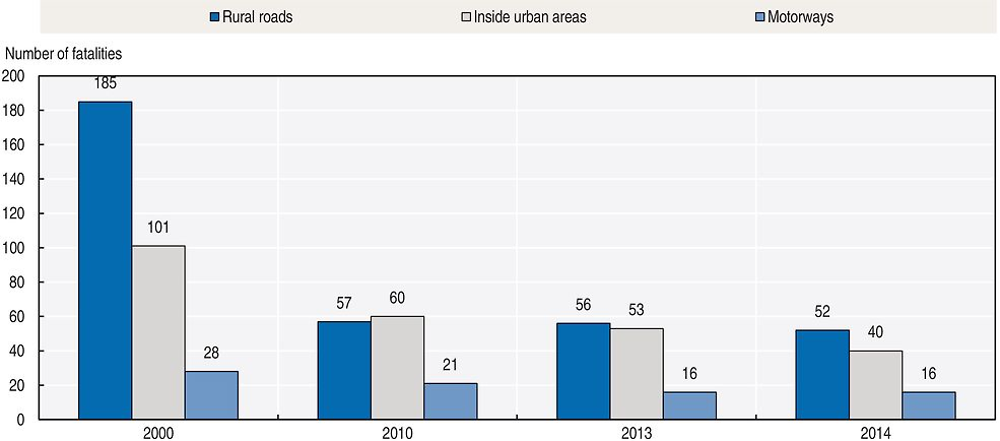
Road safety by road type
In 2014, around half (48%) of the fatalities occurred on rural roads, 37% on urban roads and 15% on motorways. Since 2000, the number of fatalities decreased more rapidly on the rural network.
Economic costs of traffic crashes
Traffic crashes represent a significant cost for society, estimated in 2014 at around EUR 1 billion, or 2.69% of GDP. The figure is based on the number of reported crashes and an estimate of non-reported crashes, using the methodology Harmonised European Approaches for Transport Costing and Project Assessment (HEATCO), adapted to the specific conditions of Slovenia.
Recent trends in road user behaviour
Speed
Speeding is a major cause of traffic crashes in Slovenia. In 2014 the number of traffic crashes caused by speeding was reduced by 7% when compared to 2013. However, speeding is still a major cause of traffic crashes in Slovenia. In 2014, 31% of road fatalities involved speeding.
Speeding is an important issue particularly in urban areas; where the average speed is well above the 50 km/h speed limit. In 2013 the average speed during daytime was 122 km/h on motorways, 79 km/h on rural roads and 55 km/h on urban roads
The table below summarises the main speed limits in Slovenia .
Drink driving
The maximum permissible blood alcohol content is 0.5 g/l for most drivers and 0.0 g/l for professional drivers and drivers who have had their licence for fewer than three years. Driving under the influence of alcohol is a major safety issue in Slovenia and is responsible for about one-third of serious injury crashes.
A crash is defined as an alcohol related crash when one of the active participants has a blood alcohol content above the limit.
In 2014, 23% of road fatalities were caused by drunk drivers. The number of drink driving crashes was reduced by 8% in 2014 compared to 2013 and the number of road users killed due to drink driving was reduced by 34%. The average blood alcohol content of drivers involved in a fatal crash was 1.45 g/l.
Drugs and driving
A crash is defined as a drug related crash when one of the participants tests positive for drugs (via a blood test).
In 2014, the official statistics attribute 0.3% of traffic crashes to drivers under the influence of drugs. However it should be noted that police officers very rarely check if the driver is under influence of drugs.
Distraction
The use of hand-held mobile phones while driving is not allowed in Slovenia. The use of hands-free devices is tolerated. There is no statistical data available on the effect of mobile phone use on Slovenian traffic crashes.
Sleepiness and fatigue
There is no data available on the influence of fatigue on crashes.
Seat belts and helmets
Seat belt use has been compulsory in front seats since 1977 and in rear seats since 1998. In 2011, the rate of seat belt use was 94% in front seats and 66% in rear seats for adults.
Dedicated child restraint is compulsory for children under 150 cm. Child restraint use on rear seats is 94% for children under 8 years old and seat belt use is 87% for children 8-14 (2011 data).
In 2014, 9 of the 41 drivers killed in traffic accidents were not wearing a seat belt.
A helmet is compulsory for riders and passengers of motorcycles and mopeds. Helmets are also compulsory for cyclists under 15 years.
There is no data available on the helmet-wearing rate for motorcycle and moped riders. A survey conducted in 2011 in Ljubljana and Maribor – the two largest cities in Slovenia – showed that 5% of cyclists wore a helmet.
National road safety strategies and targets
Organisation of road safety
The Slovenian Traffic Safety Agency was created in 2010, in accordance with the Road Traffic Safety Act of 1 September 2010. It is an independent agency financially linked to the Ministry of Infrastructure.
The agency is the main national traffic safety organisation, bringing together expertise in the road safety field. The agency’s mission covers research and analysis, preventive and educational programmes, support for development of programmes for national road safety, drivers, vehicles and driver rehabilitation. The agency will also take over independent investigation of fatal crashes.
Road safety strategy for 2013-22
The Slovenian National Road Safety Programme 2013-22 was adopted by the government in March 2013. The programme is based on Vision Zero, aiming at no fatalities or seriously injured persons on Slovenian roads. Priorities addressed in the national road safety programme are:
-
driver education and training
-
preventative action and media campaigns for vulnerable road users such as pedestrians, children, the elderly and cyclists
-
measures against the main killers on the roads: speed and alcohol.
Implementation of the National Road Safety Programme has been established at three levels:
-
Political level: The parliament reviews the programme annually.
-
Strategic level: A board of directors, nominated by the government, prepares the strategy, defines the main measures and assigns responsibilities for them. It also provides financial and other resources and monitors the programme.
-
Professional level: An inter-ministerial working group was established to monitor and implement the programme, bringing together individual experts, organisations and non-governmental organisations in the field of road safety. Local councils, civil society and some companies are also involved.
In the framework of the 2013-22 strategy, biennial action plans are elaborated. The current action plan covers the years 2015 and 2016.
Road safety targets
The main target is, by 2022, to halve the number of fatalities and those seriously injured, attaining a fatality rate below 3.5 fatalities per 100 000 inhabitants and fewer than 230 seriously injured per million inhabitants.
Monitoring targets
A board of directors regularly monitors the implementation of the National Road Safety Programme. It provides strategic guidelines towards the achievement of national road safety targets. In 2015, the board of directors made an in-depth evaluation of the 2014 action plan and submitted their recommendations to parliament.
As of 2014, with 108 road deaths, Slovenia seems on track to reach its 2022 target. An average annual reduction of 4-5% should be maintained to reach the target.
Recent safety measures (2013-16)
Road safety management
-
In 2013, the government established a board of directors to monitor lead and supervise the implementation of the National Road Safety Programme.
Road users
Driving licence
-
In 2014, Slovenia introduced an electronic test for the theory section of the driving test.
Cycling
-
Safe cycling: The Slovenian Traffic Safety Agency has launched a pilot project focusing on the promotion of safe cycling in the wider context of mobility, sustainable transport, and health and congestion policy. Within this project, a new measure, “sharrow”, has been implemented in Maribor, Slovenia’s second largest city. Sharrow is shared-lane marking to indicate a shared space for cyclists and drivers. A symbol placed in the centre of a lane indicates that a bicyclist may use the full lane. Cyclist counters are being introduced in the capital Ljubljana to record cyclist activity. The cyclist counter is devoted to promoting cycling and increasing bicycle use. The Slovenian Traffic Safety Agency is conducting before/after analysis on the two implemented measures and is organising other activities to promote safe cycling.
-
In May 2015 a preventive campaign was co-ordinated by the Slovenian Traffic Safety Agency to increase responsible behaviour among cyclists and also among other road users. The focus was also on the benefits of safety helmets.
Pedestrian safety
-
In March 2015, a new initiative, “a safe and friendly community for pedestrians”, was implemented to promote good practice and effective safety measures for pedestrians. Municipalities achieving a safe and friendly community for pedestrians are rewarded.
Education and awareness
-
Road safety campaigns are regularly conducted focusing on the main road safety topics (speeding, drink driving, seatbelt use, etc.…)
-
A campaign to improve road safety among elderly road users was launched in March 2015. It includes refreshment classes on traffic regulations, sessions on safe motorway driving, practical advice on health criteria, driving with a driving instructor, test driving simulator etc. Preventive events are organised in different municipalities all over Slovenia.
-
In August and September 2015 campaigns focused on safe routes to schools. Activities included the review of school paths, a review and update of the school path maps, meetings with school teachers and parents and promotion of the priority of pedestrians at pedestrian crossings in urban areas.
Infrastructure
-
The road network is regularly audited, with identification and treatment of high risk sections.
-
In 2015, a set of measures was implemented to prevent “wrong way” driving on the motorway network, including the installation of new traffic signs and equipment on public roads.
-
In September 2014, the Slovenian Traffic Safety Agency organised training for road safety auditors. These sessions involved local and foreign experts, who presented innovations in the field of road safety auditing and inspection.
References
Websites
-
Slovenia Traffic Safety Agency: www.avp-rs.si.
-
Slovenian Infrastructure Agency : www.di.gov.si/en/.
-
Slovenian Traffic Statistics: www.policija.si/eng/index.php/statistics (accessed 20 April 2016).
← 1. All data stem from the Slovenian Traffic Safety Agency and IRTAD unless otherwise noted. For more information please contact: [email protected].