Chapter 34. Serbia
This chapter presents detailed 2014 and 2015 road safety data for Serbia. It looks at trends in traffic and road safety from the years 1990 to 2015 and road user behaviour patterns. This includes data on speed, drink driving, drugs and driving, distracted driving, fatigue, and seat belt and helmet use. The chapter reviews Serbia’s road safety strategy and national targets to 2020 and the performance indicators put into place to help with monitoring. It also highlights the most recently implemented safety measures.1
Serbia has made progress in its data collection process and following a major revision of its database in 2015 is now in line with requirements of the European Commission.
In 2014, there were 536 reported road deaths, a 17.5% decrease compared to 2013. This is the lowest number of fatalities since records began. Excessive or inappropriate speed was responsible for 52% of these fatalities. An increase of 12.1% was noted for 2015 with 601 fatalities, although this is still under 2013 figures and is the second lowest figure since road death data collection began. An improved Law on Road Traffic Safety along with other measures has in part contributed to this progress.
Definitions applied in Serbia
-
Road fatality: Any person who died immediately or within 30 days as a result of a road crash.
-
Serious injury: Serbia has not yet adopted a definition for serious injury in police records.
Data collection
Data on road deaths are available since 1981. More detailed information on road crashes is available from 1996 onward and is included in the police crash database established in 1996. The last major revision of the road accident database was conducted in 2015. Following this revision, the road accident database is now completely harmonised with the European Commission Common Accident Data Set (CADaS) requirements and since 1 January 2016, the traffic police collect data on road crashes in accordance with the CADaS recommendations. Around 400 traffic police involved in the data collection process during a crash scene investigation have been trained in the new system.
The traffic police must attend the scene of all fatal and injury road crashes and crashes with important material damage (above RSD 200 000 dinars [EUR 2 000]). They are responsible for securing the site, organising relief and collecting data. For other crashes, participants are allowed to fill in the special form, without calling traffic police. However, if one of the participants requires the presence of the traffic police, the traffic police are required to go to the crash scene. Data on crashes not covered by the traffic police are collected by insurance companies.
Information on injury severity is recorded by the traffic police based on information from hospitals. Hospitals are obliged to call the police for every person admitted to hospital claiming to have been involved in a road crash. There is no information on the level of underreporting.
A project named “New Road Safety Database”, funded by the World Bank, will be completed at the end of 2016, with the aim of connecting all relevant road safety data holders into a unique database. Most improvements are expected in the field of injury data accuracy and data from insurance companies. This unique database will in particular allow calculation of the number of persons seriously injured with a maximum abbreviated injury score of 3 and above (MAIS3+), which is the definition recommended by IRTAD and the European Commission of a person seriously injured.
This road safety database (operated by Road Traffic Safety Agency) has already been publicly available since June 2015. A link to the database is publicly available through a Web GIS application (http://serbia.gdi.net/azbs/ [accessed 25 April 2016]). Further development is expected in the next few years, especially in terms of providing precise data on the location of each road crash.
Most recent safety data
Road crashes in 2015
In 2015, there were 601 reported road fatalities in the Republic of Serbia. This is an increase of 12.1% when compared to 2014. Nevertheless, this figure is below that of 2013 and is the second lowest number of fatalities since data on road crashes has been monitored in the Republic of Serbia.
Road crashes in 2014
In 2014, there were 536 reported road deaths, i.e. a 17.5% decrease compared to 2013. This is the lowest number of fatalities since 1981.
These relatively good results are partially the result of the improved Law on Road Traffic Safety enacted in 2009, which was accompanied by a series of education, prevention and other measures. In 2014, the institutional organisation and coordination of road safety activities were improved. Serbia also started to implement a number of European Union directives, rules and recommendations, and started to upgrade the Law on Road Traffic Safety during 2015.
Trends in traffic and road safety (1990-2015)
Traffic
Between 2001 and 2014, the number of registered motorised vehicles increased by 35%. Between 2010 and 2015, there was continued growth in the number of registered vehicles reaching an overall increase of 25%.
Road safety
Crashes and casualties
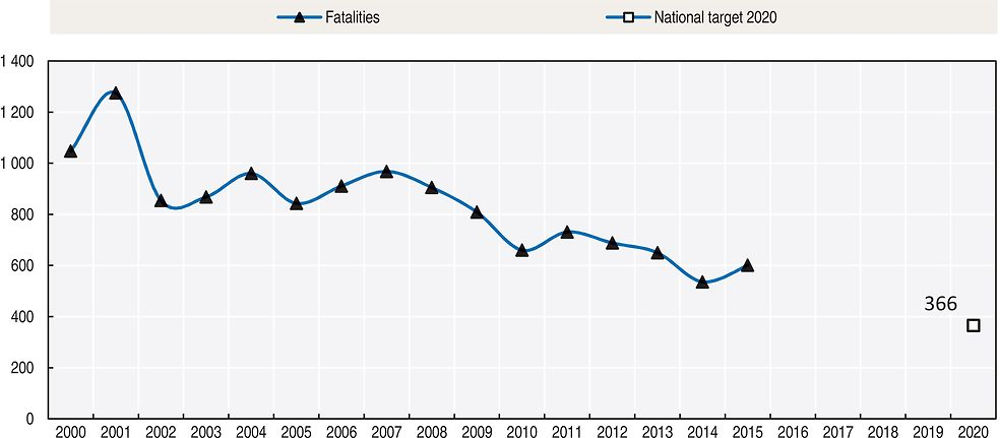
Between 2010 and 2015, the number of fatalities decreased by 8.9%. Serbia reached the lowest number of fatalities since records began in 2014. Between 2010 and 2014, the number of fatalities decreased by 18.8%.
A number of important measures have been implemented since the adoption of the Law on Road Traffic Safety in 2009:
-
establishment of institutions like the national Road Traffic Safety Coordination Body, Road Traffic Safety Agency, etc.
-
introduction of a penalty point system
-
introduction a graduated licensing system (in 2012)
-
reduction of the maximum legal blood alcohol content (BAC) to 0.3 g/l
-
introduction of a 50 km/h speed limit in urban areas
-
compulsory seat belt wearing for rear seats.
Rates
In 2014, the reported death rate per 100 000 inhabitants was 7.5. It rose to 8.4 in 2015.
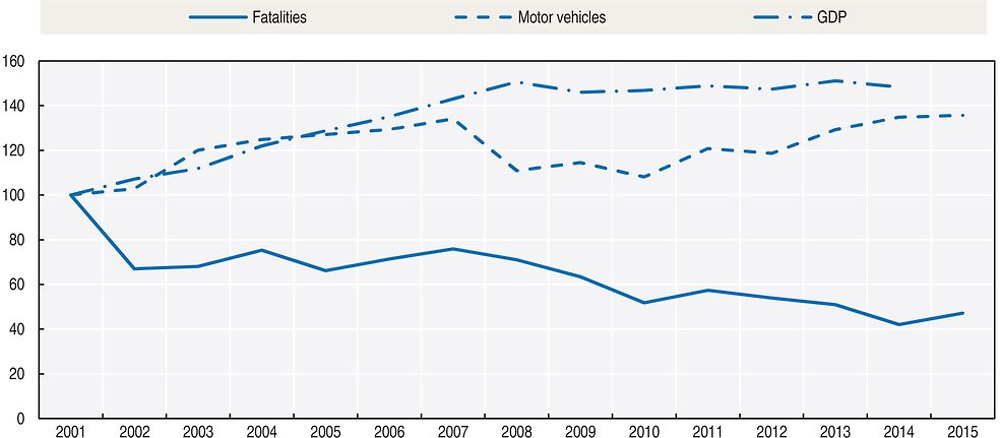
Source: World Bank for Gross Domestic Product (GDP; constant prices).
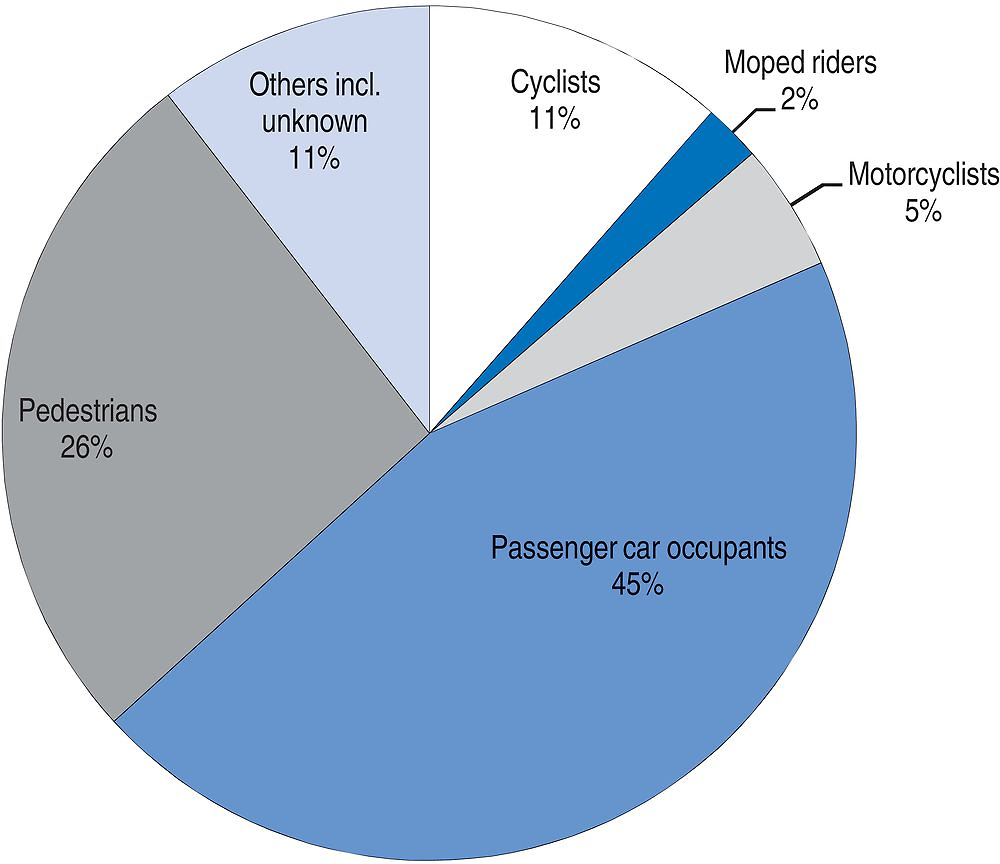
Road safety by user group
In 2015, passenger car occupants represented 45% of traffic fatalities, pedestrians 26% and powered two-wheelers 7%.
The number of motorcyclist fatalities increased significantly between 2000 and 2008, when it reached its highest value. Since 2009, the number of motorcyclist fatalities has decreased overall, with fluctuations from year to year.
Since 2010, the situation has improved for all road users, except cyclists. In 2015 in particular, the number of cyclists killed increased by 38%
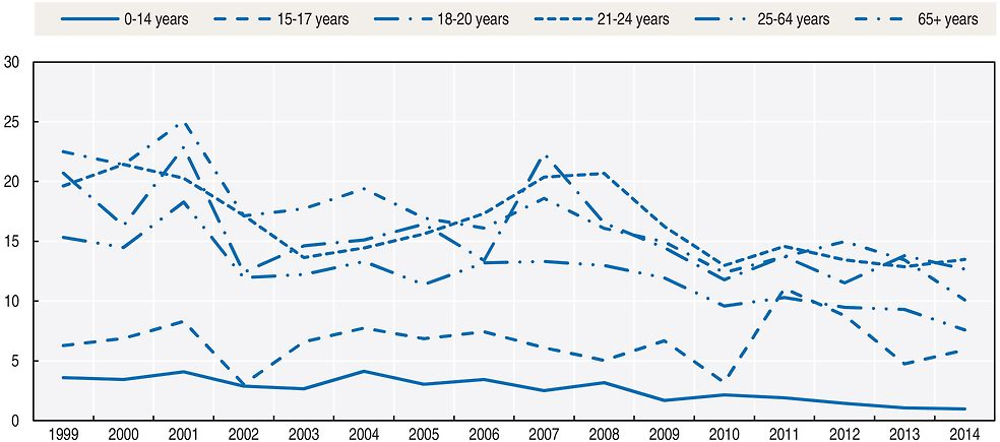
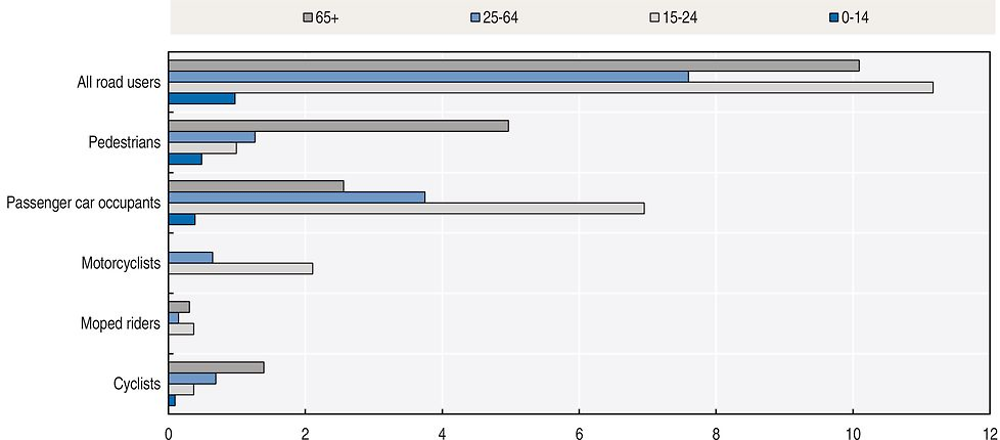
Road safety by age group
Since 2000, children under 14 have mostly benefited from road safety improvements. The smallest progress concerned the 18-20 age group, which are particularly at risk in traffic with a fatality rate nearly twice the rate of the average population (13.5 for the 18-20; and 7.5 for the average population).
Elderly people are particularly vulnerable as pedestrians. Half of the pedestrians killed in traffic are aged 65 and over.
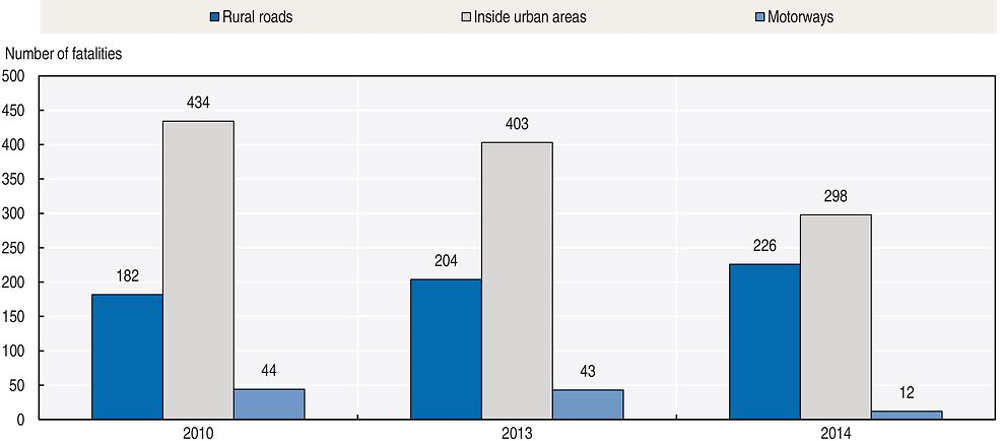
Road safety by road type
Unlike most other IRTAD countries, the majority of fatalities occur inside built-up areas. In 2014, 56% of fatalities occurred in urban roads, 42% on roads outside built-up areas, and 2% on motorways. The most common problems in built-up areas are the following:
-
main state roads pass through built-up areas
-
local roads and street networks lack adequate features to protect vulnerable road users, especially pedestrians and cyclists.
Economic costs of traffic crashes
Based on a recent study (Ross et al., 2012), in 2013 road crashes represented a total cost of about EUR 303.5 million. This estimate was used to guide development of the proposed road safety strategy for the period 2015-20.
Recent trends in road user behaviour
Speed
The table below summarises the main speed limits in Serbia.
Speeding is determined as the most frequent cause of road crashes in Serbia. In 2014, excessive or inappropriate speed was responsible for 52% of fatal road crashes. The implementation of the new crash form (implemented within the CADaS recommendations) will enable a more precise analysis of crash contribution factors, including the contribution of excessive speed for various types of crashes.
Speed measurement conducted in 2015 showed that 51% of passenger car drivers are exceeding the speed limit in urban areas. This share is 47% on motorways and 35% on roads.
Drink driving
In Serbia, the maximum authorised blood alcohol content (BAC) is 0.3 g/l. The limit of 0.0 g/l is applied to the following categories of road users:
-
drivers of motor vehicles registered for the transport of more than 8 passengers (not including driver)
-
drivers of vehicles with a maximum allowed weight over than 3.5 tonnes
-
drivers of motor vehicles for the public transport of people or goods
-
drivers of vehicles for special transport or the transport of dangerous goods
-
drivers of motorcycles, mopeds, light tricycles and quadricycles
-
driving instructors and examiners
-
novice drivers and persons who supervise novice drivers
-
drivers of vehicles with priority right of way or vehicles in a police escort.
Over the past 10 years, between 5-7% of fatal crashes were attributed to drink driving. A survey conducted in 2015 showed that 0.75% of all drivers were under the influence of alcohol.
Drugs and driving
The Law on Road Traffic Safety forbids driving under the influence of illicit drugs.
Distraction
Distracted driving is recognised as a growing problem in Serbia. However there are no adequate surveys to assess the extent of the phenomenon.
Since 2009, it is illegal to use a hand-held mobile phone or similar device while driving (hands-free devices are allowed). The penalty for this is about EUR 50. It is also illegal for a pedestrian to use a mobile phone or headset while crossing a street.
According to a survey conducted in 2015, 5.2% of all drivers used a mobile phone while driving.
Fatigue and sleepiness
In 2013, fatigue was reported as the main contributing factor in 38 road crashes, causing the deaths of three people.
Seat belts and helmets
Seat belt use has been compulsory for front seats since 1982 and for rear seats since 2009. Child restraints have been compulsory since 2009 for children up to three years old. The Law on Road Traffic Safety under preparation will include new requirements, in particular dedicated child seats for all children between infancy and 12 years of age and below 135 cm in height.
A roadside survey undertaken in 2015 indicated that the seat belt wearing rate is 73% for front-seat occupants and 7.4% for rear-seat occupants. Child restraint use is 44% for children up to 3 years old and only 14.7% for children between 4 and 12 years old.
All riders of powered two-wheelers are required to wear a helmet. In 2015, the helmet-wearing rate was 74% for moped riders and 89% for motorcyclists.
There is no mandatory helmet law for cyclists.
National road safety strategies and targets
Organisation of road safety
In Serbia, the leading agency for road safety is the Ministry of Transport with the support of the Road Traffic Safety Agency. The national Road Traffic Safety Co-ordination Body is composed of ministers in charge of traffic issues, interior affairs, health, labour, justice, education, and trade and services, with the main aim being to establish co‐operation and harmonise efforts to improve road safety.
The government established the Road Traffic Safety Agency to manage legal and technical issues in the field of road traffic safety. The agency also co-operates with regional and local bodies for road traffic safety.
Road safety strategy for 2015-20
In June 2015, the Republic of Serbia adopted the National Strategy for Road Traffic Safety for the period 2015-20.
Road safety targets and monitoring
The strategy 2015-2020 includes several targets:
-
No children killed in traffic by 2020.
-
Reduce the number of road deaths and those seriously injured by 50% between 2011 and 2020.
-
To halve, between 2011 and 2020, the total annual social-economic costs of road crashes.
To guide actions towards the achievement of these goals, a set of performance indicators has been established based on recommendations from the European SafetyNet project.
Recent safety measures (2013-16)
Road safety management
-
In 2014 and 2015, the establishment of local bodies in charge of road traffic safety continued. At the end of 2015, such bodies were established in 149 municipalities, out of 161 local communities (municipalities and cities) that needed to have one. In the coming years, efforts will focus on improvements of the professional capacities of these bodies. Educational seminars have been organised in order to strengthen the knowledge of local communities’ representatives in road traffic safety, and this project continues in 2016.
-
In order to decentralise road safety activities to each local community, two crucial steps have been taken. In the first half of 2015, each local community received a road safety analysis based on road crash data, injuries and safety performance indicators. Those road safety analyses were prepared by the Road Traffic Safety Agency. The objective is to provide all local communities with a basic and common review so that they can quickly start to create measures based on data. Secondly, through a process of benchmarking of local communities, the road safety system in each local community is evaluated, and best practice is transferred across different local communities.
Safety data management
-
In 2015, Serbia completed training of the traffic police to collect data on road accidents according to the CADaS recommendations by the European Commission.
-
Since 2015, the Road Safety Database is publicly available through the Web GIS Application (http://en.abs.gov.rs/database [accessed 25 April 2016]). Users are able to choose filters and columns for data exporting and can easily get a wide range of different analysis. The database and web-based application will be further developed in 2016.
Legal Regulations
-
The new law on the working hours of mobile workers in road transport and tachographs (Official Gazette of RS, No. 96/15) was adopted and published in November 2015. This law gives clear legal power to control officers to check compliance with Regulation (EC) No. 561/2006, as well as to fulfil obligations regarding percentages and numbers of checked drivers’ working hours in compliance with Directive 2006/22/EC of the European Parliament and of the Council.
Road users
Media campaigns
-
Several safety campaigns were launched or pursued in 2015. The Road Traffic Safety Agency conducted four nation-wide road traffic safety campaigns:
-
Click for life – fasten your seatbelt (to increase usage of seatbelts).
-
#BIRAMZIVOT (#ICHOOSELIFE) targeting young drivers.
-
Do not drink and drive.
-
Work together for child safety in road traffic.
-
Education, training and enforcement
-
In 2015, Serbia began conducting obligatory seminars for knowledge improvement of licenced lecturers, instructors and examiners who work in the new-driver licencing system (driving schools’ system). These seminars will continue in future.
-
The Road Traffic Safety Agency manages two important educational projects. The first is peer education for future drivers in high schools. The second is called “I’m still driving”, in which paraplegics injured in a road crash present the importance of safe behaviour in road traffic through their own experience. The Road Traffic Safety Agency also regularly conducts education for children in elementary schools through a mascot who knows all the road traffic rules and behaves safely in traffic.
Vehicles
-
During 2015, trailer manufacturers concluded a homologation process.
Recent and ongoing research
Three important research projects were completed in 2015:
-
Benchmarking of road safety at a local level and development of a road safety management system in local communities. The Road Traffic Safety Agency launched a pilot project in 11 local communities. The purpose of the project is to identify needs and problems of local communities and to transfer best practise between local communities.
-
In 2013, Serbia started monitoring road safety performance and road user behaviour through a set of safety performance indicators. Monitoring is conducted by the Road Traffic Safety Agency twice a year.
-
The Road Traffic Safety Agency ordered a project named “Analysis of educational needs of children in pre-school and elementary school”.
More information can be found at: http://en.abs.gov.rs/brochures (accessed 25 April 2016).
References
Ross et al. (2012), Costs of road accidents, The Republika Srpska, Banja Luka.
Websites
-
Road Traffic Safety Agency of Serbia: www.abs.gov.rs.
← 1. The Republic of Serbia joined the International Road Traffic and Accident Database (IRTAD) group in 2013. Data and information provided in this report stem from the Road Traffic Safety Agency (RTSA) unless otherwise noted and have not been validated by IRTAD. For more information contact [email protected] or [email protected].