Chapter 28. The Netherlands
This chapter presents 2014 road safety data for the Netherlands along with fatality data from 2015. It looks at trends in traffic and road safety from the years 1990 to 2014 and road user behaviour patterns. This includes data on speed, drink driving, drugs and driving, distracted driving, fatigue and seat belt usage. The chapter reviews the Dutch road safety strategy and national targets to 2020 and the progress achieved thus far. It also looks at ongoing research and recently implemented safety measures.1
Dutch roads are among the safest in the world for motorists. In 2014, there were 570 fatalities, identical to the number recorded for 2013, equalling a fatality rate of 3.4 per 100 000 inhabitants. However, the 2015 fatality total shows a 9% increase with 621 fatalities. Overall, between 2000 and 2014 road deaths were reduced by 51%; however, the number of people seriously injured increased by nearly 44%. Of these, less than 10% are occupants of passenger vehicles, and an increasing proportion of those injuries do not involve any motorised vehicle. This is largely due to an increase in cycling, E-bikes and electric mobility scooter use by senior citizens. The focus of the Dutch road safety strategy is to improve cycling infrastructure and safety for vulnerable users.
Road safety data collection
Definitions applied in the Netherlands
-
Road fatality: Death resulting from a road crash within 30 days of the crash.
-
Seriously injured: Person admitted to hospital for an injury with a Maximum Abbreviated Injury Score of two or more (MAIS2+).
-
Slightly injured: Other injury, not admitted or admitted with a Maximum Abbreviated Injury Scale score of one (MAIS1).
Data collection
In the Netherlands, Statistics Netherlands works together with the Ministry of Infrastructure and the Environment (Rijkswaterstaat) to match police-reported fatalities with other records including court files and death certificate records to arrive at the actual number of road traffic fatalities. Both the police-reported number and the actual number have been published annually since 1996. This report uses the actual number of fatalities unless there is a specific reference to “reported” numbers. In 2014, the police number was 84% of the actual number. For more information: www.swov.nl/UK/Research/cijfers/Cijfers_Registratiegraad-UK.htm (accessed 17 May 2016).
Police reporting of road crashes does not meet the requirements of the Institute for Road Safety Research (SWOV, Stichting Wetenschappelijk Onderzoek Verkeersveiligheid) and the Ministry of Infrastructure and the Environment. A national information system for the police implemented in 2009 led to lower data quality and a smaller number of reported crashes. New procedures are intended to improve the police data as from 2015 at the earliest.
Research on serious traffic injuries shows that the number of police-reported hospitalised casualties is not a good indicator. SWOV matches the Dutch police data to hospital discharge records and the MAIS score is affixed based on the ICD-derived AIS scores of patients whose injuries were coded in ICD9cm (International Classification of Diseases, 9th revision Clinical modification, WHO 1980).The estimated actual number of serious injuries is now based on the data from both police and hospital databases, and the definition of a serious injury is based on the MAIS, not the police report. Based on this method, the Netherlands is also able to report on MAIS2 or MAIS3+.
Ambulance data are being made available for traffic safety research (years 2009-14). There are different reporting systems and external causes are not always recorded. Although this data source has unknown quality, its usefulness is under investigation so as to have more information on accident locations.
At the National Road Safety Congress on 24 April 2014, the Dutch Association of Insurance companies, the national police and road safety data consultant Via launched the STAR Safety Deal. Eleven national stakeholders signed an agreement to facilitate crash reporting by road users. The STAR initiative launched a smartphone app in March 2016, enabling road crash reports by individuals, supported and (partly) verified by police or an insurance company. Crashes can also be reported via the online tool, www.mobiels chademelden.nl. This source too is of unknown quality. Hopes are that serious crashes with bicycles and without motor vehicles involved can be reported with this app. Currently, less than 5% of these crashes are reported by the police, while they are the cause of more than half of all serious road injuries in the Netherlands.
Most recent safety data
Road crashes in 2015 – final actual data
In 2015 there were 621 road fatalities, an increase of 9% compared to 2014.
A larger number of male car occupants and senior citizens on mobility scooters were killed.
Road crashes in 2014
In 2014, as in 2013, 570 people lost their lives in road traffic crashes. The number of serious injuries (MAIS3+) was estimated at 7 500 which indicates an increase of 17%. The number of MAIS2+ increased by 10% to 20 700 (Bos, 2015).
Trends in traffic and road safety (1990-2014)
Traffic
Between 1990 and 2014, the number of motorised vehicles increased by 68% and the overall vehicle distance travelled by 34%. Passenger car mobility has decreased among younger drivers during recent years, levelling the rate of growth.
Since 2000, the proportion of mobility across the main transport modes has remained almost unchanged (KiM, 2013). In 2014, slightly less than half of all trips were made by car (46%), slightly over a quarter of trips by bicycle (27%), one in twenty-five trips (4%) by public transport (train, tram, bus or metro), and one-fifth of trips (21%) by some other means (mainly walking, including taxi, mobility scooter) (KiM, 2015).
Of the total distance travelled in 2014, cars accounted for 72%, public transport for 12% and bicycles for 9%.
From 2000 to 2014, the distance cycled increased by 24%. The largest share of this growth has been from electric bicycles, which have rapidly increased in popularity (KiM, 2013, 2014, 2015). Distances per bicycle trip have increased due to better services offered to cyclists, the expansion of urban areas and the rising popularity of electric bikes. The current estimate (2013 data) is that 10% of Dutch people own electric bikes, and for people aged 65 and over, that proportion is 25%. E-bike users travel twice as far as those in the same age group riding regular bicycles. In 2014, the bicycle mobility of persons of 65 years and older is for 37% on E-bikes (KiM, 2015).
Road safety
Crashes and casualties
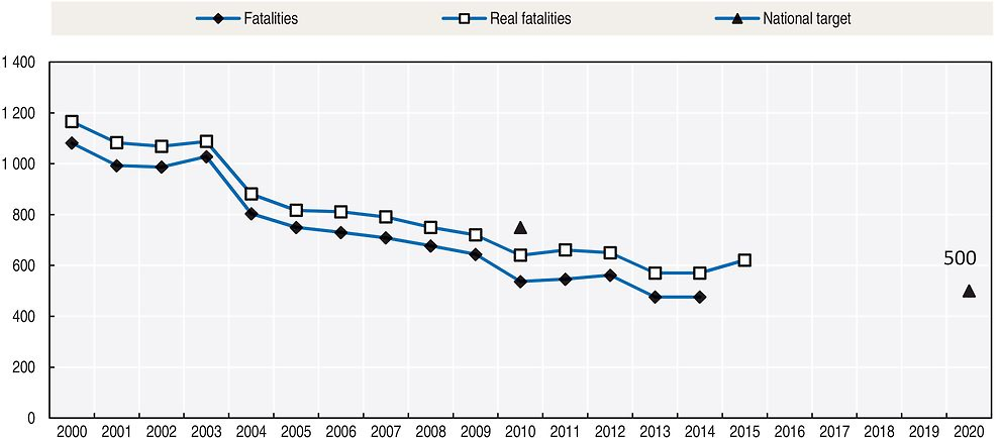
Between 1990 and 2014, the number of fatalities decreased by 61%. From 2000 to 2014, the number of fatalities fell by 51% (numbers from 1990-95 were adjusted to compensate for police underreporting).
Weijermars et al. (2014a) studied the major road safety developments in the Netherlands in the period 2000-12 and underlying contributory factors. On the favourable side, the number of actual fatalities in the period of 2000-13 decreased from 1 166 to 570. Less favourable developments were that the number of cyclist fatalities did not decrease significantly. The number of fatalities among senior citizens decreased at a lower rate than for other age categories. Also, the number of those seriously injured has increased. The number of casualties in crashes in which no motorised vehicles were involved more than doubled between 2000 and 2011.
The traffic system changed considerably in the period of 2000-12F. The design of the underlying road network improved and enforcement for a number of risk-increasing behaviours (speeding, drink driving, failing to use seat belts and helmets) was intensified in the period 2000-10 but decreased after 2010. Moreover, the European New Car Assessment Programme (Euro NCAP) for passenger cars played a major role in stimulating the production of safer vehicles. Passive vehicle safety systems such as airbags and seat belts played an important role in reducing injuries, and active safety systems, car bonnets and exterior airbags help protect pedestrians and cyclists in case of a crash. Improvements in the medical care, including more regionalisation, mobile medical teams and air ambulances, have further contributed to the decrease in fatalities. The national road safety policy emphasis has shifted to vulnerable road users (Weijermars et al., 2014b).
Analysis of seriously injured data
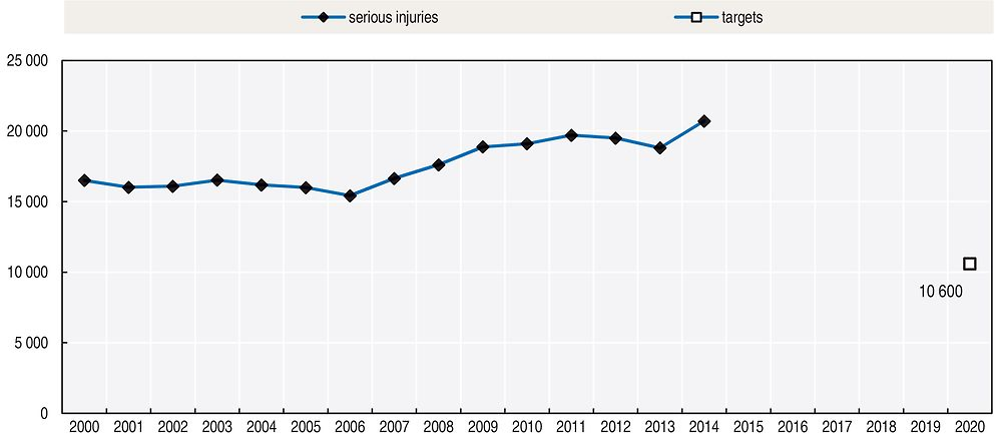
Figure 28.1 shows the development in the number of serious road injuries in the period 2000 to 2014 (injury severity ≥ MAIS = 2). Although a decline seemed to have started in 2012 and 2013, the entire period shows an increasing trend. The number of those seriously injured reached a new high in 2014 at 20 700 (SWOV, 2015b).
During the last ten years, the largest increase in the proportion of serious road injuries occurred in crashes not involving a motor vehicle. The number of serious road injuries among occupants of passenger cars and vans is the only group that has shown a significant decline over the last ten years. In 2009, this group constituted about 15% of the number of serious road injuries in the hospital register. Presently, less than 10% of the serious road injuries are occupants of passenger cars or delivery vans.
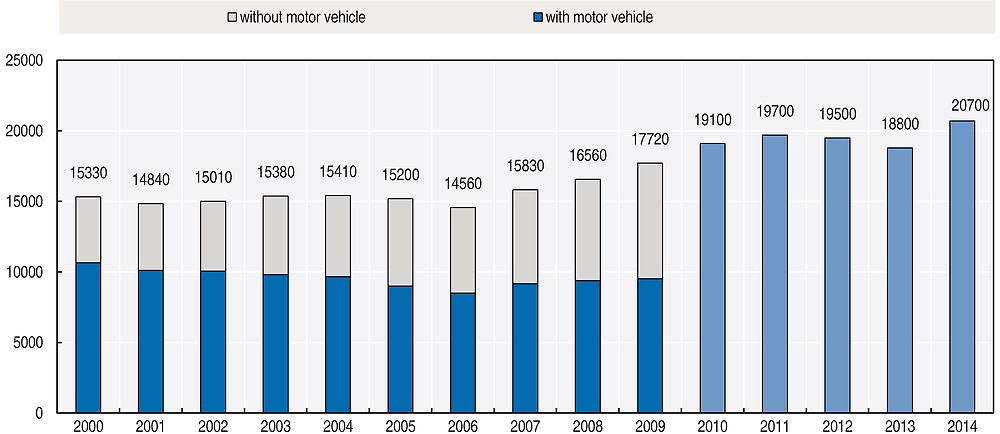
Note: Following 2009, the precise distribution between N-casualties and M-casualties cannot be determined.
Source: DHD, IenM, and SWOV.
Mortality rates
In 2014, there were 3.4 road fatalities per 100 000 inhabitants. Between 2000 and 2014, the mortality rate, expressed in terms of deaths per 100 000 inhabitants, fell by 54%.
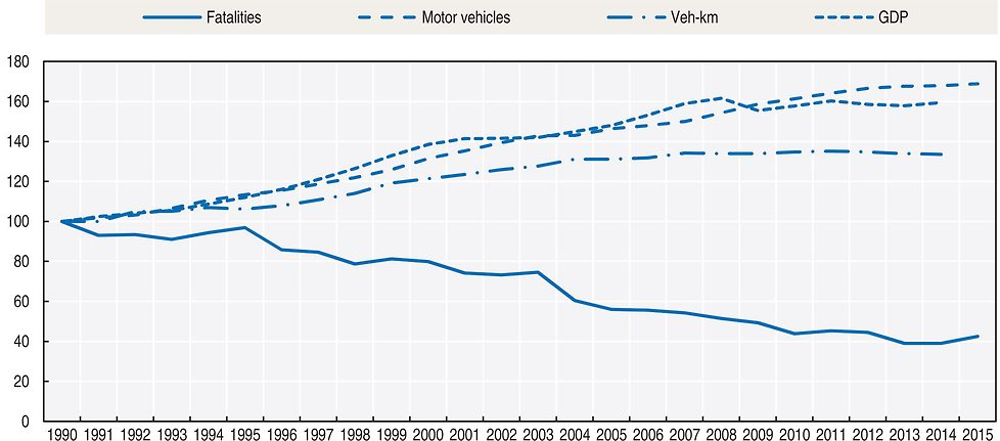
Note: Source: World Bank for Growth Domestic Product (GDP; constant prices).
Road safety by user group
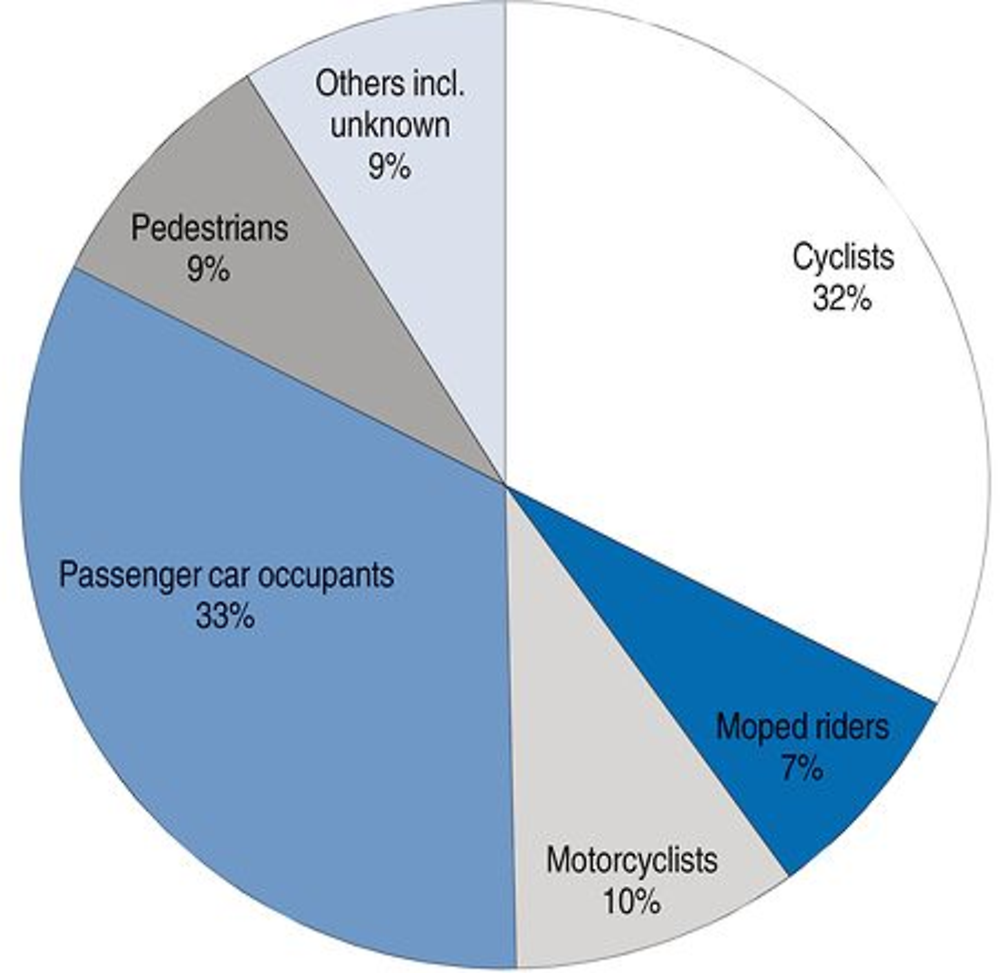
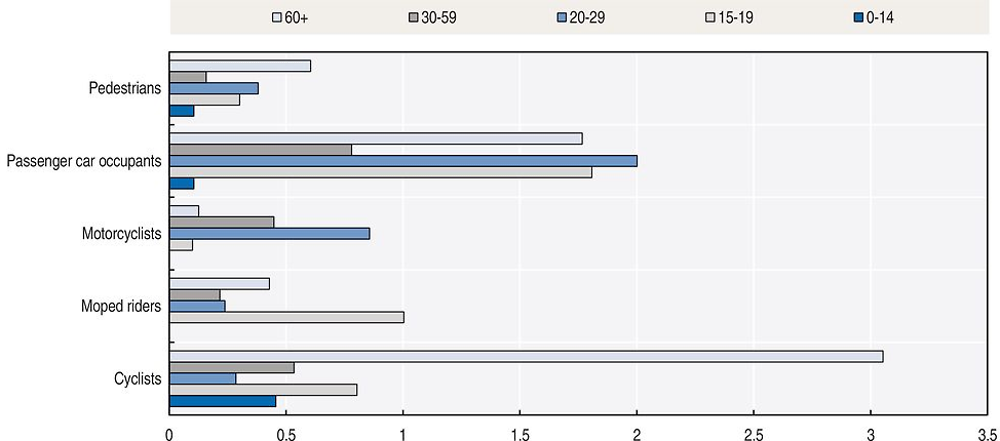
Over the long term all user groups, but especially car occupants, have benefited from safety improvements.
In the period 2000-14, all crashes involving a passenger car showed a strong decrease in the number of fatalities. The number of pedestrians and moped riders killed decreased by more than 50%. The number of cyclists killed fell by 21%.
In 2014 the number of fatalities was equal to that of 2013. The significant drop among motorcycle riders has been undone. The number of cyclists killed in traffic remains high. Pedestrians were less often killed in traffic. Since 2013 it is possible to report electric bicycles in police crash forms. There were 16 reported fatalities in 2013 and 2014 among E‐bikes riders, i.e. 12% of the total number of reported cyclists killed in traffic.
Regarding injuries, many persons are injured in crashes without the involvement of a motor vehicle. While in some countries these victims are not considered as road traffic victims, their number in the Netherlands exceeds the number of those seriously injured in motor vehicle crashes.
In 2014 the actual number of seriously injured (MAIS2+) was 20 700, of which 7 500 were MAIS3+. Half of the seriously injured resulted from bicycle crashes (bicycle alone, bicycle-bicycle, bicycle-pedestrian). Special attention is now being given to this growing group of injured persons.
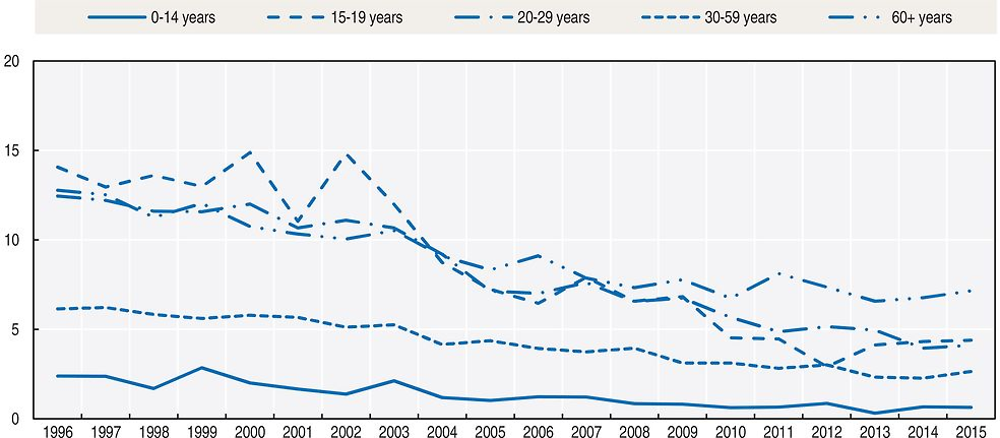
Road safety by age group
The number of fatalities varies with age. Inexperienced riders and drivers are killed more often in traffic, as are vulnerable road users. People aged over 65 represent another vulnerable group, especially while cycling.
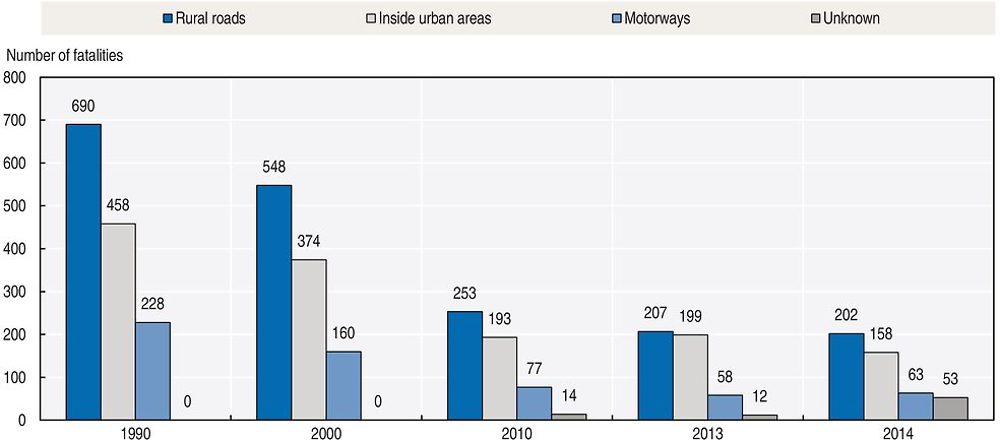
Road safety by road type
In 2014, 42% of reported fatalities occurred on rural roads, 33% on urban roads and 13% on motorways. For another 11% the road type is unknown. The decrease in fatalities over the last 20 years has been achieved mainly through the improvement of rural roads. Traffic has significantly increased on motorways.
Economic costs of traffic crashes
Traffic crashes represent a significant cost for society, estimated in 2009 at around EUR 13 billion, equivalent to 2.2% of the Dutch gross domestic product (SWOV, 2014). The following six categories have been included in the estimate:
-
medical costs
-
production loss
-
loss of quality of life (based on a willingness-to-pay method)
-
property damage
-
settlement costs
-
congestion costs.
Recent trends in road user behaviour
Speed
Between 1 September 2012 and 2015, speed limits were raised to 130 km/h on about 1 200 km of motorways, i.e. half of the motorway network .On these motorways a speed of 130 km/h is allowed during the day and at night (except where speed limits are lowered due to environmental concerns). A trial evaluation of limit change on eight motorway road sections indicated that limit change on most sections was associated with a 2 to 3 km/h increase in mean speed and 2.5 to 3.5 km/h increase for V85 speed (Beenker et al., 2012)
The table below summarises the main speed limits in the Netherlands. For an explanation on the road categorisation Advancing Sustainable Safety see www.sustainablesafety.nl.
Drink driving
Until 2006, the maximum authorised blood alcohol content (BAC) was 0.5 g/l for all drivers of motor vehicles, but in 2006 a lower limit of 0.2 g/l was applied for novice drivers during their first five years. For cyclists the legal limit is also 0.5 g/l. There is no limit for pedestrians.
Alcohol-related fatalities are defined according to the SafetyNet definition: Any death occurring within 30 days as a result of a fatal road crash in which any active participant was found with a blood alcohol level above the legal limit.
In the Netherlands, testing of a deceased person for recent use of psychoactive substances is prohibited. Police reports regarding the use of psychoactive substances by seriously injured road users is not reliable. Regional hospital studies found that in the period 2000-04, 28% of seriously injured drivers had a BAC of 0.5 g/l or more, and in the period 2007-09 this proportion remained the same.
Drugs and driving
Legislation on driving under the influence of illicit drugs was expected to be introduced in 2015 but was postponed to a later date (probably 2017). This legislation entails legal limits being set for five different types of drugs. Furthermore, zero tolerance limits are proposed for combined use of drug-drug and drug-alcohol. Saliva testers and a test on physical features and behavioural characteristics will be made available to police in the Netherlands to enforce the proposed legislation.
Results of hospital studies show that approximately 10% of the seriously injured drivers were positive for illicit drugs. As for alcohol, Dutch legislation prohibits post mortem drug testing.
Distraction
Holding a phone while driving has been illegal in the Netherlands since April 2002. Additional legislation relevant to distracted driving is applicable in cases where behaviour that explicitly endangers road safety is directly observed.
A survey conducted in 2015 among over 900 Dutch car drivers indicated that 61% had never used a hand-held phone while driving in the past 12 months, whereas nearly 5% did so regularly or even at nearly every trip. Almost one-fifth of Dutch drivers reported using a hands-free phone frequently or even nearly every trip. In 2011, slightly over 100 000 Dutch drivers were fined for hand-held phone use while driving, in 2012 about 64 000 drivers and in 2013 about 69 000 drivers. In 2012, the fine for hand-held phone use while driving was increased from EUR 180 to EUR 220.
Phone use is estimated to contribute to 3% to 4% of bicycle crashes involving injuries (Goldenbeld et al., 2010). This excludes listening to music.
Sleepiness and fatigue
A 2015 survey on fatigue among more than 1 500 Dutch car drivers suggests that driver fatigue is considered a widespread problem. Nearly half of Dutch drivers (47%) reported that sleepiness negatively affected their driving performance, 60% said they continued to drive after starting to feel sleepy and 10% continued driving even when the drive took more than one hour. Almost one-quarter took no break when they started to feel sleepy. One in ten Dutch drivers said that they were aware of an increased driving risk from their sleepiness.
Seat belts and helmets
Seat belt use has been compulsory in front seats since 1975 and in rear seats since 1992. At the last national seat belt measurement in the Netherlands in 2010, the rate of seat belt use was above 95% in front and rear seats in passenger cars. For vans (87%) and trucks, the rate of use was lower. No seat belt measurements have been performed since 2010.
Helmet wearing has been compulsory on motorcycles since 1972 and on mopeds (up to 50 cc, maximum speed 45 km/h) since 1975. A helmet is not compulsory on light mopeds (up to 50 cc, maximum speed 25 km/h) and bicycles. The latter moped category constitutes a road safety problem, as these mopeds are regularly modified to much higher maximum speeds.
The proportion of riders wearing a helmet depends on the vehicle type: nearly all motorcycle riders wear helmets. In 2008, 96% of moped riders, but very few light moped riders, wore helmets. The use of moped helmets by passengers has increased and in 2008, 86% wore them. No national monitoring of helmet wearing has occurred since 2008.
National road safety strategies and targets
Organisation of road safety
In the Netherlands, the Ministry of Infrastructure and the Environment (Directorate General Mobility – Roads and Traffic Safety section) is the central agency for road safety, responsible for overseeing and co-ordinating all road safety activities. In particular, it is responsible for:
-
Co-ordination of intergovernmental working processes and road safety decision making at the level of central government and co-ordination of national mass media campaigns. Regional and local governments have their own authority over their roads and the safety of their infrastructure. The ministry is responsible for road safety policy and together with decentral governments they set policy targets.
-
Periodic review of legislation, rules and standards against best practice; recommendations for improvement; monitoring and evaluation; establishing and supporting data systems used to monitor road safety.
-
Compilation and dissemination of national statistics, co-operating with the Ministry of Infrastructure and the Environment, Statistics Netherlands and SWOV.
Road safety strategy for 2008-2020
Road safety policy in the Netherlands is guided by a philosophy of sustainable road safety, based on several key concepts, including that the human being is the reference standard and prevention is preferable to a curative approach. The policy follows five safety principles: road functionality; homogeneity of mass and speed and direction; physical and social tolerance; recognition and predictability of roads and behaviour; and state of awareness.
In 2008, the Road Safety Strategic Plan 2008-2020 (SPV) was developed by the then Ministry of Transport and received support in Parliament. The SPV is based on three cornerstones: co-operation, an integral approach and sustainable safety. Continuation of measures that have proven successful is ensured. Measures to reduce the risk of vulnerable road users and a tougher approach on traffic offenders are among 12 areas of focus. Mobility demands and the social context of road users are taken into account.
In 2012, the strategic plan was revised in agreement with its four-yearly evaluation conducted by SWOV. The Policy Stimulus Road Safety Initiative contains extra measures aimed at road safety improvement for cyclists, elderly road users, infrastructure, and road users in general.
Road safety targets
The current targets in the SPV for 2020 are a maximum of 500 road fatalities and a maximum of 10 600 MAIS2+ road injuries. If current developments and efforts continue, the target for 2020 with respect to fatalities seems feasible. Without additional safety measures it will be very difficult to achieve the target for serious road injuries.
Monitoring
The plan is assessed regularly and adapted if necessary.
A recent SWOV report (Aarts et al.) indicates that it is uncertain, even unlikely, that the targets for traffic fatalities and serious road injuries will be met. SWOV was asked to identify additional measures that could increase the feasibility of the targets. The results have been summarised in a number of possible scenarios concerning choices for road safety in the Netherlands.
The annual assessment report on road safety developments in 2014 observes that the Policy Stimulus Road Safety Initiative has correctly identified cyclists and the over 60s as the most important target groups requiring attention (Duivenvoorden et al., 2015).
Note: 2015 data are provisional.
Recent safety measures (2013-16)
Road safety management
-
Mandatory inquiries into fatal crashes on the Trans-European Transport Network are effective as of 1 January 2014.
-
Since March 2016, it is possible to self-report road crashes with an app (in IOS and Android). The European Damage Form is no longer required by insurers if all motor vehicles involved are Dutch. Injury crashes and crashes without motor vehicles can also be reported. The police will start to use (a similar version of) this app for their data entry.
Road users
Speed management
-
The new limit of 130 km/h on motorways was introduced in September 2012 on 60% of the motorway network. On a third of this length the limit is dynamic, with 130 km/h permitted only between 7 pm and 6 am. On roads with environmental or safety concerns the 120 km/h limit or the 100 km/h limit was maintained. Preliminary analysis in 2014 showed hardly any change in the level of safety, however in 2015 an increased number of fatalities on roads with the 130 km/h-limit was reported. Further investigation will follow.
Enforcement
-
Since 1 January 2015 a new regulation has been operative for repeat traffic offenders that enables imposition of higher sanctions if the violation is repeated within a 2 year time frame. Major violations under this new regime include: driving without a licence, dangerous road behaviour, not correctly securing load, driving without a licence plate, ignoring stop signs and using the emergency lane on motorways. Min V&J, 2014).
Education and licensing
-
Licensing for driving tractors was changed on 1 July 2015. The category T replaces the T‐certificate. This concerns agricultural and forestry tractors and motor vehicles with limited speed. In anticipation of the new category, theoretical and practical examinations to obtain the T certificate have been adapted to emphasise driving on public roads and road safety.
Cycling safety
-
The Policy Stimulus Road Safety Initiative contains extra measures aimed at cyclists. It requires municipalities to survey road safety bottlenecks for cyclists and to make plans for improvement containing behavioural measures as well as infrastructural measures. To monitor progress in this domain all municipalities were asked to complete a survey on their cycling policies (Weijermars et al., 2014b, Duivenvoorden et al., 2015).
-
The Royal Dutch Touring Club (ANWB) has initiated a project to improve the safety of the cycling infrastructure in the Netherlands – and, in the longer term, also in other countries: the Safe Cycling Network. This project was inspired in part by the international European Road Assessment Programme (EuroRAP/iRAP). The objective is to develop a system of expertise to help road authorities assess cycling infrastructure (and therefore cycling safety). Unsafe cycling infrastructure needs to be surveyed and measures taken.
Mopeds
-
The proper place for slow mopeds (speeds no higher than 25 km/h) is an issue: Should they use cycling paths or roadways in urban areas? The ministry has now allowed municipalities to make their own choice.
-
Since July 2014 a new rule for the confiscation of a moped licence, in the case of a tuned-up moped, has been in operation. This enables police to confiscate the licence when the measured speed of a moped is higher than allowed after a measurement correction (Minister van Veiligheid en Justitie, 2013).
Infrastructure
-
Provincial authorities have long-range traffic, transport and mobility plans in which infrastructure measures play an important role. These include reconstruction of risky intersections, construction of roundabouts, safer roadsides, upgrading or downgrading roads to achieve more credible speed limits, more recognisable and uniform road markings, safer cycling facilities, safer cycling crossings, safer cycling paths, and better integration of maintenance and infrastructure improvement.
Vehicles
-
The development of passive vehicle safety systems and the increasing penetration rate of safety technologies play an important role in reducing injuries. Recent examples are active bonnet safety systems and airbags on the outside of the vehicle body to protect pedestrians and cyclists in case of a crash.
Post-crash measures
-
Trauma care is undergoing regionalisation and Mobile Medical Teams have been introduced, four of which have an air ambulance at their disposal (Weijermars et al., 2014a). These and further improvements in medical care have contributed to the decrease in the number of fatalities in the period 2000-12.
Recent and ongoing research
-
Estimating the number of serious road injuries, by linking police and hospital data. Efforts to obtain ambulance data. For further details see Bos, N.M. et al. (2015), Serious road injuries 2014; Estimate of the number of serious road injuries in 2014. SWOV, The Hague, www.swov.nl/rapport/r-2015-18.pdf.
-
Annual monitor of the road safety situation in The Netherlands and evaluation of policies. For further details see Groot-Mesken, J. de et al. (2015) Monitor Policy Stimulus Road Safety 2015. www.swov.nl/rapport/r-2015-20.pdf; Duivenvoorden, C.W.A.E. et al. (2015), Monitor Policy Stimulus Road Safety 2015 – Research justification. SWOV, The Hague, www.swov.nl/rapport/r-2015-20a.pdf.
-
Automated vehicles and taking back control of the vehicle. For further details see Vlakveld, W. (2015), Transition of control in highly automated vehicles. A literature review. SWOV, The Hague, www.swov.nl/rapport/r-2015-22.pdf; Vlakveld, W., L. Vissers, K. Hulleman and N. van Nes (2015), An empirical exploration of the impact of transition of control on situation awareness for potential hazards. SWOV, The Hague, www.swov.nl/rapport/r-2015-23.pdf.
-
Road Safety Outlook 2020 and 2030. For further details see Weijermars, W.A.M., F.D. Bijleveld, S. Houwing, H.L. Stipdonk and A. Dijkstra (2015), Road safety forecasts for 2020 and 2030; Estimate of the expected numbers of fatalities and serious road injuries. SWOV, The Hague, www.swov.nl/rapport/r-2015-17a.pdf.
References
Aarts L.T., R.G. Eenink, W.A.M. Weijermars (2014), Achieving the road safety targets: Exploring the opportunities for increasing the feasibility. SWOV, The Hague, www.swov.nl/rapport/R-2014-37.pdf English summary page 6: www.swov.nl/rapport/R-2014-37a.pdf.
Beenker, N., B. van Engelenburg and A. van Veluwen (2012), “Verkeerskundige evaluatie proeftrajecten 130 km/h”, Nationaal Verkeerskunde Congres, 2012.
Duivenvoorden, C. et al. (2013), Evaluation of an initiative to reward correct traffic behaviour in the Province of Limburg: Study into the effects of a pilot with individual and collective town area-related rewards for speed behaviour in urban areas, SWOV, Leidschendam, www.swov.nl/rapport/r-2013-07.pdf.
Goldenbeld, C and S.Houwing (2015), Staandehoudingen in het verkeer, SWOV, Den Haag.
Goldenbeld, Ch., M. Houtenbos, and E. Ehlers (2010), The use of portable media players and mobile phones while cycling; Results of a large-scale internet survey, SWOV, Leidschendam, www.swov.nl/rapport/r-2010-05.pdf.
KIM (2013), Mobility Report 2013, Netherlands Institute for Transport Policy Analysis, www.kimnet.nl/binaries/kimnet/documenten/rapporten/2013/10/29/mobiliteitsbalans-2013/mobiliteitsbalans-2013.pdf.
KIM (2014), Mobility Report 2014, Netherlands Institute for Transport Policy Analysis, web.minienm.nl/mob2014/documents/Mobiliteitsbeeld_2014.pdf.
KIM (2015), Mobility Report 2015, Netherlands Institute for Transport Policy Analysis, web.minienm.nl/mob2015/documents/Mobiliteitsbeeld_2015.pdf.
Minister van Veiligheid en Justitie (2013), Toezeggingen en verzoeken verkeershandhaving, Brief aan de Tweede Kamer, 18 november 2013, Kamerstuk 29398, nr. 387, Ministerie van Veiligheid en Justitie, The Hague.
Minister van Veiligheid en Justitie (2014), Stand van zaken aanpak veelplegers in het verkeer, Brief aan de Tweede Kamer, 25 september 2014, kenmerk 544441, Ministerie van Veiligheid en Justitie, The Hague.
SWOV (2011), Driver fatigue: prevalence and state awareness of drivers of passenger cars and trucks; A questionnaire study among driving licence holders in the Netherlands SWOV Leidschendam, www.swov.nl/rapport/r-2011-04.pdf.
SWOV (2012a), Road safety of children in the Netherland,. SWOV Fact sheet, www.swov.nl/rapport/Factsheets/UK/FS_Children.pdf.
SWOV (2012b), Traffic education for children 4-12 years old, SWOV Fact sheet, www.swov.nl/rapport/Factsheets/UK/FS_Traffic_education_children.pdf.
SWOV (2012c), Seat belts, airbags and child protection device, SWOV Fact sheet, www.swov.nl/rapport/Factsheets/UK/FS_Seatbelts.pdf.
SWOV (2014), Road crash costs, SWOV Fact sheet, www.swov.nl/rapport/Factsheets/UK/FS_Costs.pdf.
SWOV (2015a). Fear appeals and confronting information campaigns. SWOV Fact sheet, July 2015, www.swov.nl/rapport/Factsheets/UK/FS_Fear_appeals.pdf.
SWOV (2015b). Serious road injuries in the Netherlands. SWOV Factsheet December 2015, www.swov.nl/rapport/Factsheets/UK/FS_Serious_road_injuries.pdf.
SWOV (2016). Phone use by cyclists and pedestrians. SWOV Facstheet, January 2016, www.swov.nl/rapport/Factsheets/UK/FS_Use_of_media_devices_cyclists.pdf.
Van Schagen, I. et al. (2010), Speed measurements during the public information campaign ‘Keep to the limit’, SWOV, Leidschendam, www.swov.nl/rapport/d-2010-09.pdf.
Van Schagen, I. and S. de Craen (2014), Accompanied driving put into practice; Survey among 2toDrivers and their coaches. SWOV, The Hague, www.swov.nl/rapport/r-2014-15a.pdf.
Weijermars, W. et al. (2014a), Road safety assessment 2000-2012; Causes and consequences of road unsafety, SWOV, The Hague, www.swov.nl/rapport/r-2014-24.pdf.
Weijermars, W. et al. (2014b), Monitor Policy Stimulus Road Safety 2014 – Research justification, SWOV, The Hague, www.swov.nl/rapport/r-2014-36a.pdf.
Websites
-
SWOV – Dutch research institute for safety research: www.swov.nl.
-
Ministry of Infrastructure and the Environment www.government.nl/ministries/ministry-of-infrastructure-and-the-environment.
-
Statistics Netherlands www.cbs.nl.
-
Cycling Embassy www.dutchcycling.nl.
← 1. Statistics in the Netherlands distinguish between reported and actual (or real) numbers of casualties. The former category covers casualties reported by the police. Actual numbers are higher, as they take into account data available from sources such as court files and death certificates. This report uses the real number of fatalities unless there is a specific reference to the “reported” numbers.
All data stem from SWOV, the Ministry of Infrastructure and the Environment and IRTAD unless otherwise noted. For more information please contact: [email protected].