Chapter 12. France
This chapter presents 2014 road safety data for France along with provisional data from 2015. It looks at trends in traffic and road safety from the years 1990 to 2014 and road user behaviour patterns. This includes data on speed, drink driving, drugs and driving, distracted driving, fatigue and seat belt and helmet use. The chapter reviews France’s road safety strategy and national targets to 2020. It also looks at the most recently implemented safety measures and on-going research.1
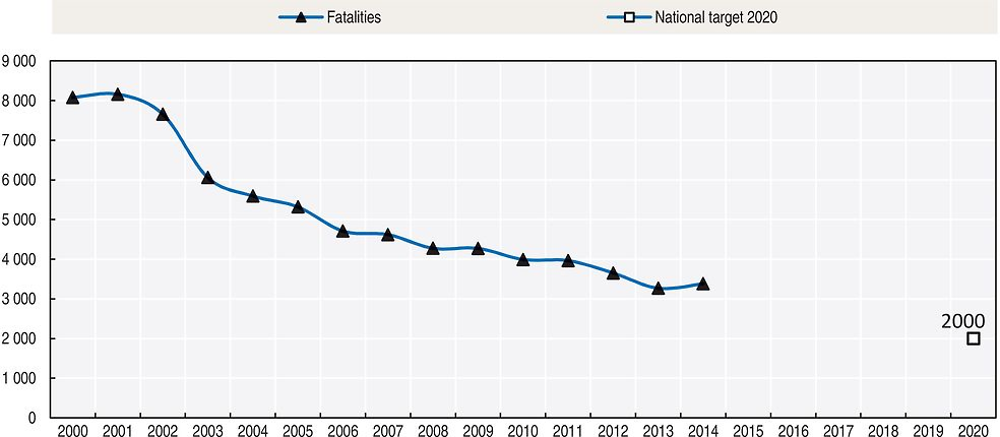
France, with its road network of one million kilometres, reduced its fatality rate by another 15% between 2010 and 2014. In December 2015 the government confirmed its 2020 target of 2000 deaths or less per year. However, both 2014 and 2015 have seen an increase in fatalities of 3.5% and 2.4% respectively. Favourable weather conditions and increased mobility are factors contributing to the 2014 increase; and a dramatic truck and coach accident in 2015 with 41 fatalities also needs to be taken into account. A new 22-point action plan was announced in October 2015 aiming in part to further protect vulnerable users and combat dangerous driving.
Road safety data collection
Definitions applied in France
-
Road fatality: Person who died within 30 days of a road crash. Before 2005, fatalities were counted within six days. For international comparisons, a correction factor of 1.069 is applied for the years before 2005.
-
Hospitalised: Non-fatal casualty who stayed longer than 24 hours in hospital. Before 2005, this category used the duration of more than 6 days for the hospital stay.
-
Slightly injured: Non-fatal casualty who received medical care but did not stay in hospital longer than 24 hours (or 6 days before 2005).
-
Seriously injured: Person who is injured with at least one injury ranking three or more on Maximum Abbreviated Injury Scale (MAIS3+), not including those who died within 30 days.
Data collection
French official road safety information comes from the National Road Traffic Accident (RTA) database and presents results for mainland France only, unless specified that data from overseas areas are included.
Road traffic accidents leading to injury are recorded by police force into their own software programme according to a dedicated format Injury Accident Analysis Bulletin (BAAC, Bulletins d’analyse d’accident corporel). These files are then gathered centrally through a web-based programme and constitute the National RTA database. This process is managed by the French Road Safety Observatory (ONISR, Observatoire national interministériel de la sécurité routière), with the assistance of technical teams from the French Research Centre on Risks, Environment, Mobility and Planning (CEREMA, Centre d’études et d’expertise sur les risques, l’environnement, la mobilité et l’aménagement) and the network of local observatories to check and complement the information as necessary.
Proven suicides and intentional murders are not registered as road traffic accidents.
Monitoring the quality of data is ensured partially by comparing it with the Rhone registry, i.e., information gathered from hospitals of the Rhone county on all road traffic crash victims who went to hospital for medical care. Information on the number of fatalities is very accurate. Serious injury crashes are usually recorded accurately as well, except for single vehicle crashes of powered two-wheelers and cyclists. There are some variations across the country over the way slight injury accidents are recorded. The French Institute of Science and Technology for Transport, Development and Networks (IFSTTAR) estimates that the number of injured people is significantly under-estimated and could be four times greater than the registered number.
Based on the expertise developed by using both the Rhone registry and the National RTA database, IFSTTAR has been tasked with providing a national estimate for MAIS3+ victims to provide the relevant information requested by the European Commission for their 2014 baseline.
Most recent safety data
Road crashes in 2015 – provisional data
Based on provisional data, it is estimated that 3 464 persons lost their lives on French roads in 2015. This is 80 more than in 2014, i.e. a 2.4% increase. This is the second consecutive year with an increase in the number of road fatalities.
Between 2010 and 2015, estimates show a decrease in road fatalities for motorcyclists (-12%), pedestrians (-5%), moped riders (-40%) and car occupants (-15%). By contrast, fatalities among cyclists increased by 3% increase compared to 2010. The number of people killed in collective road transport, usually well under 10 persons each year, included in 2015 the 41 coach passengers killed in the dramatic crash of October between a coach and a truck.
Road crashes in 2014
In 2014, 3 384 people were killed on French roads, a 3.5% increase when compared with 2013. This increase needs to take into account the favourable weather conditions in France in 2013, with a very cold and wet first semester. There was a 15% decrease in fatalities between 2010 and 2014, a decrease similar to the period 2006 to 2010.
In 2014, temperatures were the warmest since 1900, enhancing personal mobility. However, the very rainy 2014 summer limited motorcycle outings and contributed to a significant decrease in the usual high number of summer motorcyclist fatalities.
In 2014, among the 3 384 road fatalities, it was registered that:
-
three quarters were male
-
64% died on roads outside built-up areas
-
nearly a quarter were less than 24 years old
-
nearly a quarter died in a crash involving a driver with a licence not older than two years.
-
a quarter were motorcyclists or moped users.
Trends in traffic and road safety (1990-2015)
Traffic
Between 1990 and 2014, the number of motorised vehicles increased by 38% and the overall vehicle kilometres driven by 31%. Light vehicle traffic increased consistently from 1990 to 2003 and then remained more or less stable until 2009 and then increased again by 3% over the next 5 years. Utility vehicle traffic increased regularly until 2005; then remained stable; it increased again by 9% between 2009 and 2014. After a regular increase from 1990 to 2007, heavy goods vehicle (HGV) traffic dramatically dropped by 18.5 % between 2007 and 2009 due to the economic downturn. It has been fairly stable since 2009.
Road safety
Crashes and casualties
The number of road fatalities peaked in 1972 with about 18 000 fatalities. France had a fatality rate of 35 deaths per 100 000 inhabitants. Since then, the number of fatalities has followed a downward trend, with fluctuations from year to year. Between 1990 and 2015, the number of road fatalities decreased by more than 70%.
Between 1990 and 2000, important measures include:
-
In 1989 the publication of the White Paper on Road Safety paved the way for road safety policies on improving and enhancing enforcement that would come into effect 10 years later.
-
The maximum speed limit in built-up areas was set at 50 km/h in 1990, and the maximum allowable blood alcohol content level (BAC) was lowered to 0.5 g/l.
-
The demerit point system was introduced in 1992.
-
Most motorway network construction was achieved during this period.
-
Most vehicles were equipped with airbags.
-
The educational continuum was implemented.
Despite these measures, fatalities only decreased by 20% in the decade, as traffic increased by 20%. In 2000, there were 15 people killed per billion vehicle kilometres driven and 14 per 100 000 inhabitants.
In July 2002, French President Jacques Chirac declared road safety to be one of his four main priorities. Between 2000 and 2010 important safety changes included:
-
The first permanent automated speed cameras were introduced in 2003.
-
A Road Safety National Council was established for public and private stakeholders to meet and present action proposals to the government.
-
Probationary licences were introduced in 2004.
-
A driver caught exceeding the maximum blood alcohol concentration level would lose six demerit points out of 12 (or 6 out of 6 for drivers in their probation period).
These changes made it possible to break through the symbolic level of 5 000 fatalities per year in 2006. Fatalities fell by 51 % over the 10 year period. Experts attribute 75% of the improvement to a reduction in average speed and 11% to improved vehicle safety. At the same time, traffic was up 7%.
Between 2010 and 2012, fatalities decreased by 8.5%, in line with the trend observed at the end of the 2000s.
As a result of favourable weather conditions in particular, 2013 was marked by an accelerated decline in the number of fatalities, with a 10.5% decrease compared to 2012.
In 2014, the increase of car occupant fatalities compensated the decline. The increase among car occupant fatalities continued fuelling the upward trend in 2015.
Rates
In 2014, the fatality rate expressed in terms of deaths per 100 000 inhabitants was 5.3 and the fatality risks, expressed in terms of deaths per billion vehicle-kilometres was 5.9. In 1990 the respective rates were 15.8 and 25.2, which means that the risk of dying on a French road was divided by about four between 1990 and 2014. During the same period, the number of vehicles per 1 000 inhabitants increased by 22%.
Analysis of seriously injured data
IFSTTAR estimates the number of people in road traffic crashes with a MAIS3+ injury. This modelling work is currently being evaluated. Based on these estimates, 43% of persons injured with a MAIS of 3 or above were powered two-wheelers riders, 28% were car occupants, 14% cyclists and 12% pedestrians. This means that nearly 70% of those seriously injured are vulnerable road users.
These data also show a slower reduction in the number of people seriously injured compared to the number of fatalities, and wide variation for different road users. Between 2000 and 2012, the number of fatalities decreased by 55%, while the number of seriously injured decreased by 43 %. Between 2006 and 2012, the decrease was 22% for fatalities and 19% for MAIS3+ injuries. The table below show the reduction in fatalities and seriously injured for various road user groups.
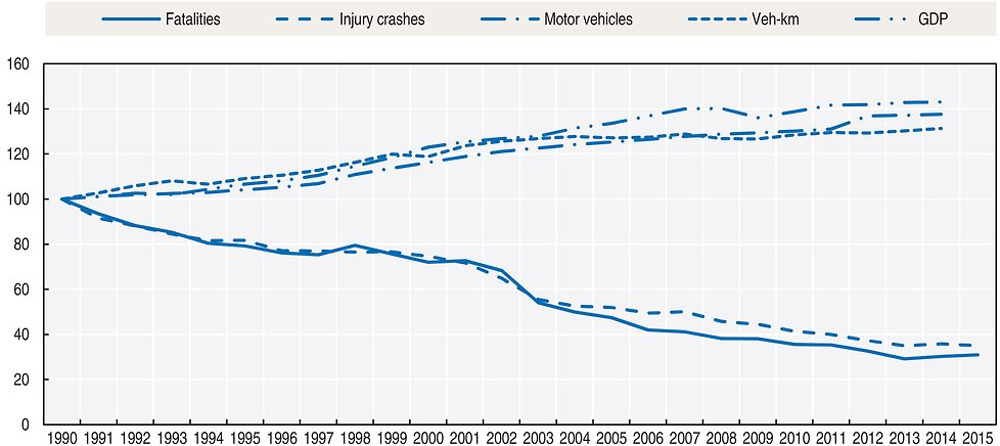
Source: World Bank for Gross Domestic Product (GDP; constant prices).
Road safety by user group
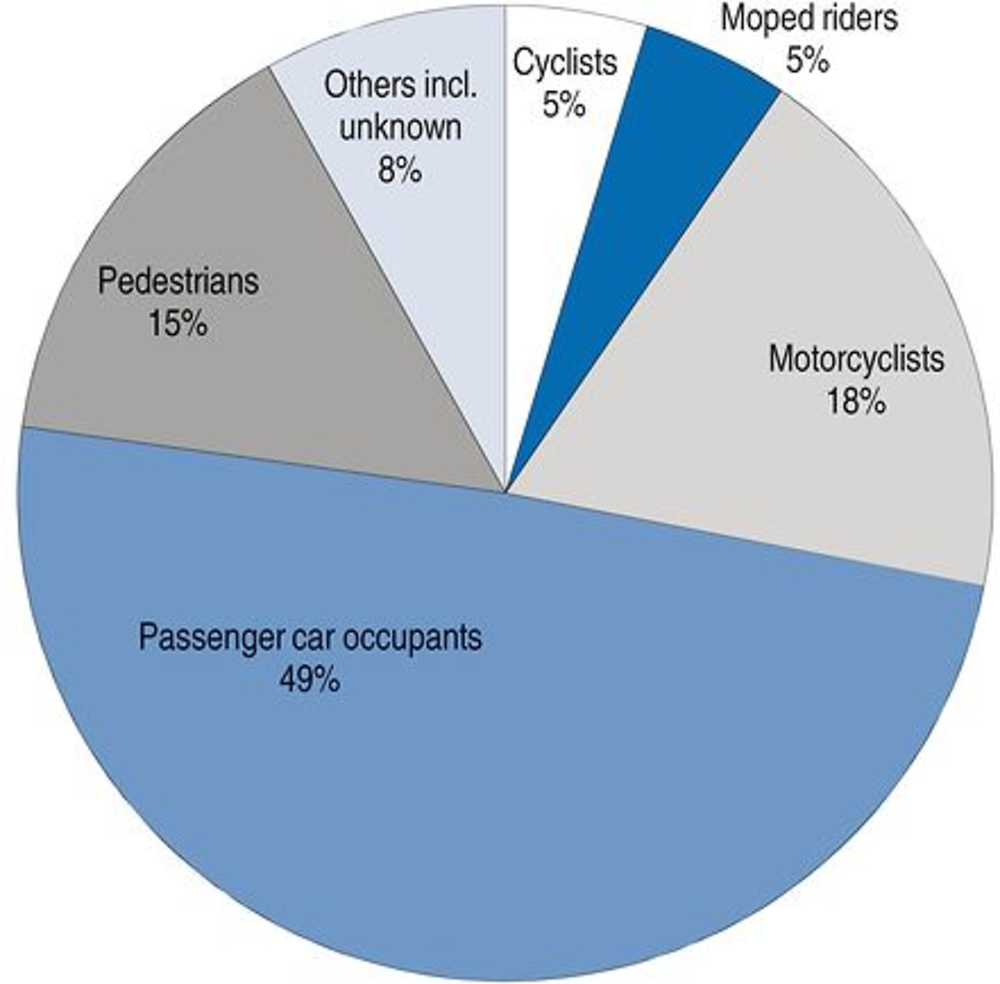
The reduction in road deaths since 2000 did not benefit all categories of users in the same manner. The greatest reductions were observed for car occupants (-69%) and moped riders (-64%). The number of motorcyclists killed decreased by 33%. The number of pedestrians and cyclists killed decreased by 41%. These gains were achieved mainly in the first half of the period. A stagnation has been observed since 2007 for cyclists and since 2009 for pedestrians.
Powered two-wheelers (moped riders and motorcyclists) are overrepresented in road fatalities. While they account for less than 2% of distance travelled, they represent 23% of total fatalities and 43% of the seriously injured. The risk of fatality per kilometre driven is 19 times higher for a motorcyclist than for a car occupant. However, some progress is being observed, in part attributed to a decrease in speed of passenger cars and to a lesser extents of motorcyclists themselves. The implementation of speed cameras able to record the rear motorcycle plate has contributed to an annual average reduction of 3.5% of motorcyclists killed since 2005 (with strong annual fluctuations due to weather conditions)
In 2014, pedestrians and cyclists represented about 20% of all fatalities, and their mortality has increased since 2013 by 7 and 8% respectively.
Road safety by age group
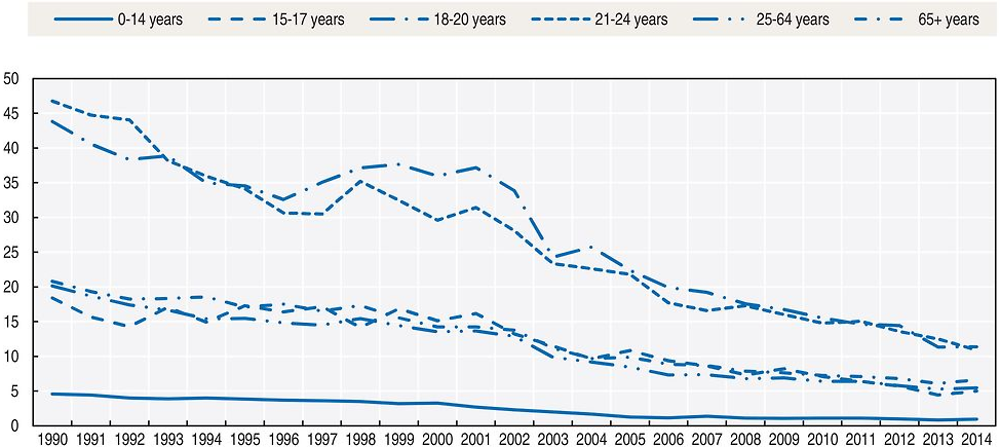
The 18-29 year olds are the most affected by road crashes, as young men are more often prone to risky behaviour (in particular driving at high speed), and the majority of novice drivers are also in this age group. In 2014, they represented 28% of all fatalities but only 14% of the population. The 15-17 year-old group are also associated with a high number of injured hospitalised in the BAAC file, but their mortality is now moderate following a strong decrease in the number of moped riders in the 2000s.
Between 2000 and 2014, the different age groups followed different trends. This is the result of both an evolution in individual risk and demographic change. Regarding the impact of demographic changes, the population aged 65 and above has increased significantly since 2011. To a lesser extent, the upward trend for the 45-64 age group (the baby boomers) and those 75 and over is continuing. As the population ages, improvement in road safety for the older generation is becoming an important focus.
As a consequence between 2000 and 2014, the number of fatalities among these age groups declined more slowly than for the average population. Strongest decreases were observed for the 0-14 (-71%), the 15-17 (-67%) and the 18-24 (-66%), while fatalities among the population aged 75 and above only decreased by 51%. Between 2010 and 2014, fatalities among the 65-75 age group increased by 7%.
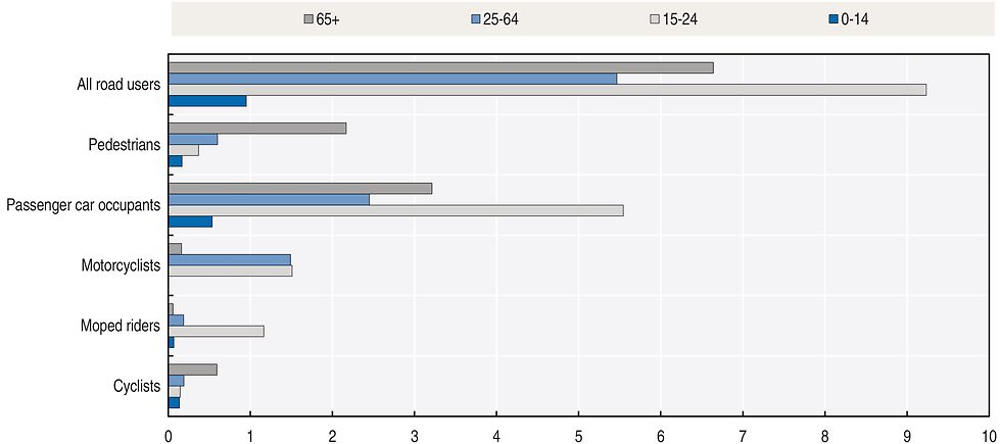
The repartition of road fatalities by travel mode is largely influenced by age, given the minimum age required to drive certain vehicles. Thus the 15-17 age group represents the largest share of fatalities among moped riders, despite a decrease from 37% to 27%. Children under 14 and those above 65 are particularly vulnerable as pedestrians and cyclists. In 2014, children under 14 represented 10% of cyclist fatalities. People aged 65 years old and over represented 43% of cyclist fatalities and 51% of pedestrian fatalities but only 18% of the population.
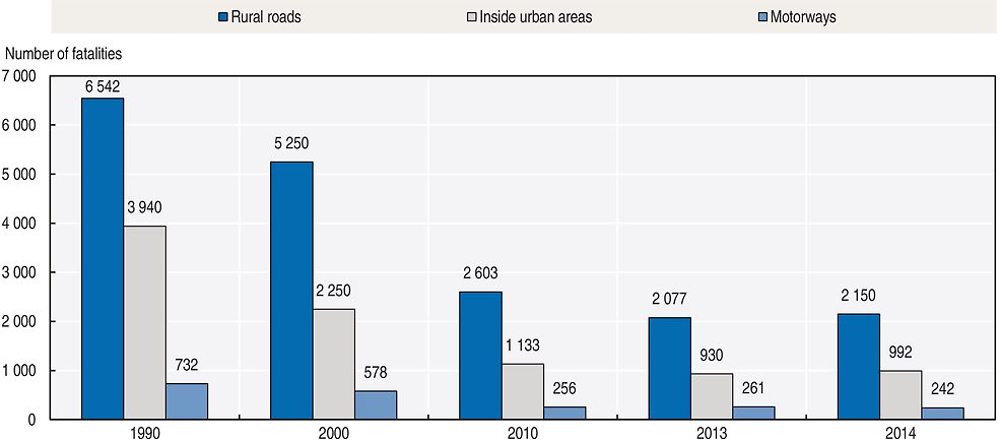
Road safety by road type
In 2014, France counted more than 1 million kilometres of roads. When fatalities per billion vehicle-kilometres travelled are broken down by type of road, the risk on country roads is much higher. Motorways are the safest network, since they absorb 25% of the traffic and account for 7% of fatalities.
Since 2000, the decrease in the number of fatalities in built up areas and rural roads has been of the same magnitude, about 60%. On the motorway network, the number of fatalities decreased more than on the rest of the network up to 2008 but mortality has stagnated since.
In 2014, 64% of fatalities occurred on rural roads, 29% on urban roads and 7% on motorways. More than half of all road deaths are on a 90 km/h speed limit road, outside built-up areas. In 2014, road mortality decreased only on the motorway network (-7%), but it is still 2% above the 2010 level. Moreover, initial estimates for 2015 indicate a very marked increase of fatalities on motorways.
Economic costs of traffic crashes
Road traffic crashes represent a significant cost for society. Based on reported crashes, the cost was estimated in 2014 at about EUR 37.3 billion, or 1.5% of GDP. These costs cannot be directly compared to the costs published for previous years, as unit values for a road fatality, injured person and property damage have been rebased following a 2014 instruction on the socio economic evaluation of projects following recommendations from the OECD (CGSP, 2013).
Costs of road crashes take into account production losses, affective loss for the relatives, medical costs and the loss of quality of life.
The total costs could actually be much higher, when taking into account non-reported crashes. IFSTTAR estimates that the number of injured people could be four times greater than the registered number, and the number of hospitalised nearly twice as great. This could lead to a global total of EUR 50 billion, representing 2% of the GDP of France.
Recent trends in road user behaviour
Speed
In 2014, inappropriate or excessive speed was the main cause in 26% of fatal crashes.
Between 2000 and 2011, average speeds during daytime decreased by 10 km/h or more on all non-urban networks. Car speeds decreased the most, as cars were the first targeted by automatic speed cameras. HGV speeds started decreasing later in the period and in a more moderate way. Motorcycle average speeds have also decreased, but they remain nearly 10% higher than car average speeds.
However, speed measurements undertaken in 2015 revealed that the average speed increased by 4 km/h on the motorway network (speed limit: 130 km/h) compared to 2012. The average speed also increased by 2 km/h on the dual carriageway network (speed limit: 110 km/h).
The table below summarises the main speed limits in France.
Drink driving
The maximum authorised blood alcohol content (BAC) is 0.5 g/l for all drivers (including cyclists). For bus and coach drivers the maximum authorised BAC is 0.2 g/l. Since 1 July 2015 the maximum authorised BAC is 0.2 g/l for novice drivers during their probation period. The use of alcolocks should be extended for drivers found guilty of drink-driving offences by court.
It is estimated that alcohol is the main cause of 19% of fatalities and a contributing factor in 28% of fatal crashes. This proportion has remained stable, around 30%, since 2000.
Drinking and driving involves all age groups, except the older generation.
Drugs and driving
A study among drivers estimated that 3% of crashes could be attributed to the consumption of prescription drugs. Benzodiazepines (anxiolytic or hypnotic) and antidepressants, widely used in France, are associated with a significant increase in the risk of causing a road crash.
Since 2010 between 21% and 26% of fatal crashes have involved use of illegal drugs. In 2014, it was estimated that illegal drugs were a factor in 23% of fatalities. It is estimated that illegal drugs are the main cause of more than 5% of fatal crashes.
The 18-35 year-old group are the most affected by drug impaired driving, representing 67% of drivers testing positive for drugs. Among drivers tested with a BAC above the legal limit of 0.5 g/l, at least one-third also tested positive in a drug test.
Since 2003, driving under the influence of substances or plants classified as narcotics constitutes an offence. Testing is approved for the following categories: cannabinoids, amphetamines, cocaine and opiates. It is planned to conduct more random drug tests, using a saliva-testing kit, which is less expensive than blood tests.
Distraction
Some international studies show that between 25% and 50% of injury crashes are due to a lack of attention, but these incidents are difficult to report. In police files, the factor “distracted attention” was mentioned in 271 fatal cases in 2014 (8% of fatalities), 240 due to drivers’ lack of attention and 33 due to pedestrians’ lack of attention.
It is forbidden to drive with a hand-held mobile phone, but the use of hands-free mobile phones is tolerated. A study undertaken in 2010 estimated that 10% of injury crashes could be attributed to phone use while driving.
While phoning when driving is a growing concern, the concern is even greater over the expanding number of communication functions offered by a smartphone.
Since 1 July 2015, drivers are prohibited from using any device attached to the ear while driving, whether used for phone calls or for listening to music or the radio (headphones, headsets).
Sleepiness and fatigue
According to police records, sickness/fatigue is a contributing factor in 9% of fatal crashes. Its prevalence is greater on motorways, where it is reported as a contributing factor in 18% of fatal crashes.
Seat belts and helmets
Seat belt wearing has been compulsory in front seats in urban areas at night and urban motorways since 1975 and at all times since 1979. They have been compulsory in rear seats since 1990. Children under 10 must be seated in a rear seat and be adequately restrained, taking into account their weight and height.
The seat belt wearing rate is among the highest in OECD countries; however, there is still room for improvement, especially for rear seats. In 2014, 21% of car occupants killed and 31% of utilitarian vehicle occupants killed were not wearing a seat belt or the seat belt was not well buckled when the crash occurred, 11% of front-seat passengers and 17% of rear seat passengers were not wearing a seat belt, 41% of fatalities involving a driver under the influence of alcohol were not wearing a seat belt and 30% of road users killed at night were not wearing a seat belt.
It is estimated that 150 lives could have been saved if all vehicle occupants had worn their seat belts.
Wearing a helmet was made compulsory in 1973 for motorcyclists with engines over 125cc and for moped riders and motorcyclists with engines of 50cc to 125cc in rural areas. This obligation was extended to urban areas in 1975. The helmet-wearing rate of powered two-wheelers (it is difficult to discriminate between mopeds and motorcycles during observations) is almost 100% during week days but only 90% during the weekend. In 2014, 36 of the moped or motorcycle riders killed (18 motorcyclists killed (3%) and 18 moped riders killed (12%) were not wearing a helmet.
There is no mandatory helmet use law for cyclists so far. However, recent research by IFSTTAR has demonstrated that the risk of severe injury was considerably reduced when wearing a helmet. In particular the chance of a severe head injury (MAIS3+) was reduced by 66% in urban areas and by 97% outside urban areas. Mandatory wearing of bicycle helmets for children up to 12 should be in effect by the end of 2016.
National road safety strategies and targets
Organisation of road safety
Since the change of government in 2012, the lead agency for road safety (Road Safety Inter-ministerial Directorate) reports to the Minister of the Interior. The Minister of the Interior chairs the Inter-ministerial Road Safety Committee, an assembly of ministries’ representatives in which decisions are taken. The ONISR observatory reports to the road safety director and is in charge of managing the road traffic accident database, analysing road safety performance and organising research to prepare for new measures. The National Road Safety Council, composed of 50 members from public service, enterprises, victims and road users’ representatives, is in charge of presenting road safety action proposals to the government. Its mandate terminated in 2015. It should be renewed in 2016 for the period 2016-19.
Road safety strategy for 2011-20
In order to reduce the number of road deaths by half over the period 2011-20, which would mean fewer than 2 000 persons killed on French roads at the end of the decade, the government has tasked the National Road Safety Council to work on new road safety measures. In the meantime, the Ministry of Interior works with other ministries on more technical measures that are required and assesses the feasibility and implementation of what the National Road Safety Council proposes.
The key priorities identified by the government are to:
-
reduce fatalities among young people and novice drivers
-
reduce fatalities among motorised two-wheelers
-
combat the main crash-contributing factors of speed and impaired (alcohol/drug) driving.
The Minister of Interior announced on 26 January 2015 an action plan with 26 road safety measures, aimed in particular at reducing injuries among vulnerable road users as they represent 70% of the seriously injured. Nineteen measures were implemented as of 31 December 2015.
The Inter-ministerial Road Safety Committee (CISR) met on 2 October 2015 for the first time since May 2011. A 22-point action plan was announced, accompanied by 33 additional measures, articulated around the following objectives:
-
to increase the fight against dangerous behaviour on the roads
-
to protect vulnerable road users
-
to bring road safety into the digital era
-
to strengthen legal equality for all road users
Road safety targets
The current target of the French government is to reduce the number of road fatalities to below 2 000 by 2020, which is in line with the European Commission goal of halving the number of fatalities by 2020.
Monitoring
Since 2013, national indicators have been calculated for each local jurisdiction over a three-year period, and progress on the overall fatality numbers is benchmarked against the 2010 baseline. Since 2015, dashboards are issued on a quarterly basis to all county executives to assist them in the management of their local safety action plans.
At the end of 2014, it was estimated that France is one year behind schedule to achieve the 2020 target.
The government confirmed its aim to decrease the number of fatalities to 2 000 or less by 2020 when it published its action plan in December 2015. A pre-evaluation was conducted to assess which impact these measures may have (gains for road safety, socio-economic consequences).
The progress towards the 2020 target is measured using national indicators and published each year in the French Road Safety Observatory (ONISR) annual report. The projections of road fatalities produced through the simulation models of population dynamics are also considered a tool for the management of implemented policies. The assessment of the impact of road safety policies identifies issues and priorities, therefore influencing the choice of new measures to be implemented.
The new Sustainable Development Goals have encouraged consideration of an important component of road safety: sustainable mobility. The strong political will from the government to facilitate sustainable transport and mobility is manifested in various policies: the development of “active mobility” (cycling or walking), public transport projects and shared use of vehicles (carpooling, auto-sharing).
Recent safety measures (2013-16)
Road safety management
-
The expert committee advising the National Road Safety Council produced a first report in 2013 advising on measures to reduce the number of fatalities, including a reduced speed limit on single carriageways, the use of alcolocks, a reduced number of road side obstacles and strengthened road safety management. A specific report on road users with a higher risk (cyclists, motorcyclists, young people and seniors) was finalised in 2014.
-
The National Road Safety Council issued 17 recommendations to the government. Some of them have already been implemented (e.g. signs to announce fixed speed cameras, communication rather than enforcement around the use of self-alcohol testing, promoting accompanied driver education). Others were among the 26 measures announced in January 2015 by the Minister of Interior (e.g. regulations for motorcyclists driving between two lanes, forbidding the use of ear pieces and audio headsets, standardising powered two-wheeler number plates, defining auditing methods for local road networks to deal with road side obstacles, experimenting with some reduction in speed limits on single carriageways).
Road users
Driving license
-
As a result of a European Directive, since January 2013 new driving licence categories have been created to implement progressive access to more powerful motorised two-wheelers: AM for mopeds and A2 for motorcycles of average power.
-
The principle of progressive access to powered two-wheelers, in the form of the A2 licence, currently only concerns users under 24. The Inter-ministerial Road Safety Committee (CISR) announced the generalisation of the graduated licensing for all age levels in order to prevent quick access to powerful powered two-wheelers for new motorcyclists, which shall come into force in 2016.
-
Since 1 November 2014, accompanied driving practice is possible from the age of 15 (instead of 16 before). Young people can take the driving license examination at 17½, although they will not be driving on their own before they turn 18.
Speed management
-
In 2014, the speed camera fleet was strengthened with new automated speed cameras including control of average speeds. Other new automated cameras enforce stops at train crossings and traffic lights.
-
In 2015, France experimented with new speed management devices: fixed speed cameras that detect excess speed in both directions; speed cameras that take pictures of both the front and rear of the vehicle; traffic light radars to determine if they can be adapted to capturing excessive speed as well, and autonomous speed cameras for road works sections.
-
At the end of 2015, there were 2 180 fixed speed cameras (and 239 discriminating speed cameras), 809 mobile speed cameras (including 259 next generation radars and 22 autonomous speed cameras) and 712 traffic light radars. Fixed speed cameras are spread across all networks: 13% on motorways, 25.5% on trunk roads, 57, 5% on county roads and 3% on local roads. Traffic light radars are spread evenly (a third each) across major cities (with more than 500 000 inhabitants), middle cities (between 100 000 and 500 000 inhabitants) and minor cities (fewer than 100 000 inhabitants).
-
The inter-ministerial action plan defined a strategy for 2016 for automated speed control. The current objective is to modernise the cameras already in place and to multiply by four the number of controlled areas. It is planned for 10 000 mock speed cameras and 500 real ones to be installed within a three year period, bringing the overall total to 4 700 devices as compared to 4 200 today.
-
In accordance with the Safe System approach, traffic calming measures have been widely adopted in the urban space, such as “zone 30”. Since 2015, the mayor has the power to lower speed limits in all or part of urban and residential areas to 30 km/h.
Protective equipment for motorcyclists
-
A guide was released in 2012 to promote the benefits of individual protective equipment. In 2014 and 2015, a partnership with insurance companies, protective equipment providers and bikers’ associations set up an incentive scheme for users of motorised two-wheelers to purchase personal protective equipment as a package deal (gloves, boots, clothing and possibly an airbag suit).
-
In 2015, the Inter-ministerial Road Safety Committee (CISR) made it compulsory for motorcyclists to have technical checks for motorised two-wheelers on the occasion of a sale, and to wear certified gloves.
-
Wearing the safety vest is mandatory for motorcycle users in case of emergency stop.
Education and awareness
-
National advertising campaigns to combat alcohol and drug consumption when driving were widely disseminated (with the well-known character “Sam”, who drives and does not drink). A campaign was launched on the 10-year anniversary of “Sam”, www.lebureaudecom.fr/securiteroutiere/cp_emailing_sam_10ans_dec2015.html (accessed 25 April 2016).
-
At Christmas and New Year, a message is diffused to encourage a person who has been drinking to refrain from driving (“Quand on tient à quelqu’un, on le retient”). www.securite-routiere.gouv.fr/medias/campagnes/quand-on-tient-a-quelqu-un-on-le-retient2 (accessed 25 April 2016).
-
A new initiative concerning text messaging while driving was launched (“When you look at your smartphone while driving, who looks at the road?”). “Driving mode”, a mobile application, was also created to put the phone into standby mode while driving.
-
Important advertising campaigns for motorised two-wheeler users are conducted each year. To make motorcyclists more aware of crash circumstances, the slogan was: “With motorcycles, the danger is in thinking that there isn’t any!” The film won an award at the 2013 Global Road Safety Festival. French cinema continues to be mobilised in favour of road safety with the release of the short-film “When love will be dead” (“Lorsque l’amour sera mort”) in 600 movie theatres and on the internet. www.securite-routiere.gouv.fr/medias/campagnes/lorsque-l-amour-sera-mort-le-nouveau-film-d-erick-zonca (accessed 25 April 2016).
-
In 2015, a fact-checking platform (“A l’épreuve des faits”) was launched online to respond to common beliefs about, and enable citizens to acquire a better understanding of, road safety issues. www.securite-routiere.gouv.fr/en-parler-agir/a-l-epreuve-des-faits (accessed 25 April 2016).
-
A new programme entitled Shockwave (“Onde de choc”) was introduced to propose a new approach to road safety risks. The goal is to boost awareness that road crashes impact not only the victims, but also their family, their friends and the people they work with. www.lebureaudecom.fr/securiteroutiere/cp_emailing3_janv2016.html (accessed 25 April 2016).
Infrastructure
-
New motorways are being equipped with rumble strips on the edges of road markings to prevent crashes due to drowsiness.
-
As one of the 26 priority measures of January 2015, additional yellow “No Entry” signs can be installed on exit slip roads to prevent accessing the motorway the wrong way.
Vehicles
-
To improve understanding of crash mechanisms, the French government is supporting the European initiative to look into the feasibility of standardising CAN bus data in vehicles and making them available for research purposes.
Recent and ongoing research
Some research projects are presented below.
Mobility
-
Cycling and Walking Action Plan (PAMA): in 2014, 25 measures were announced by the Minister of the Environment with a view to encouraging cycling for both utility and recreational purposes. Its objective is to create a supportive framework to share public space and secure “active mobility”. A second phase was launched with the preparation of new measures by the beginning of 2016. www.certu-catalogue.fr/plan-d-actions-pour-les-mobilites-actives-pama.html (accessed 25 April 2016).
-
Pedestrian accidents on rehabilitated roads with dedicated lanes for public transport: this study focused on identifying pedestrian safety issues caused by the modernisation and sophistication of urban spaces. It analysed impact of urban development, the design of tramway platforms and bus lanes, and pedestrian behaviour (distraction, alcohol, decision-making criteria for crossing). www.territoires-ville.cerema.fr/IMG/pdf/150616-Rapport-Pi_TC-1erephase-V2_cle0eee6c.pdf (accessed 25 April 2016).
Powered two-wheel vehicles
-
Emergency braking of motorcycles: an experiment led by CEREMA and UTAC-CERAM (car, motorcycle and bicycle technical union), demonstrated that, in the case of emergency braking, braking distances are longer for motorcycles than those estimated for passenger cars (Rapport CEREMA “Freinage d’urgence motos vs voitures particulières”).
Ageing of the population
-
Studies on the mobility of senior citizens: several studies were carried out to identify indicators of cognitive and functional fragility (fatigue, slow movement, concentration problems) and how older population adapt their driving behaviour.
-
This subject was developed at the Entretiens Jacques-Cartier (www.territoires-ville.cerema.fr/les-aines-et-la-securite-routiere-a1025.html), and at a seminar in 2014 www.mobiliteinclusive. com/wp-content/uploads/2015/11/La-mobilite%CC%81-des-seniors-en-France.pdf (accessed 25 April 2016).
Infrastructure
-
Saving lives by return of analysis on accidents (SVRAI): this research highlights the contribution of crash analysis to road infrastructure and diagnosis of driver behaviour. www.ouest.cerema.fr/IMG/pdf/2011-10-11_Projet_SVRAI.pdf (accessed 25 April 2016).
-
Prevention of lane departures by use of audio rumble strips (ROADSENSE): the ROADSENSE project aims to define, conceive, deploy and validate experimentally the use of audio rumble strips installed at the edge the road which produce a sound alert and vibration when driving over it. This alert is intended to correct lane departures of distracted, disoriented or tired drivers. https://hal.archives-ouvertes.fr/hal-00810905/document (accessed 25 April 2016).
-
Impact of visual information on driving behaviour (I2V): this study identified and measured visual information (reading process, legibility, visual perception) and its impact on driving behaviour (decision-making process), to facilitate conception of traffic calming measures. http://actions-incitatives.ifsttar.fr/orsi-mobilites/encours/i2v/ (accessed 25 April 2016).
On-going research (3 or 4 year research programmes)
-
Evaluation of road safety policies (EPSR): the main objective of this study is to provide a systematic evaluation of road safety policies. It will offer a framework for assisting in the decision-making process (ex ante) and assessing the impact of road safety measures (ex post).
-
Scientific knowledge of motorcycles (COSMOS): this study based on the theory of commitment aims at inciting drivers to reduce speed with an engaging awareness and communication measure.
-
Estimation of the real number of seriously injured people in road crashes (REG-TRAUMA): this project is a continuation of previous work based on the linkage of the BAAC and the Rhone county hospital files to assess the real number of people seriously injured. Results are then extrapolated to estimate the number of people injured on the whole territory of France.
-
An improved understanding of injuries of road traffic accident victims based on the TraumaBase registry: a trauma registry entitled TraumaBase was created in the Ile-de-France region. This study aims at identifying potential statistical data and information on injuries from the TraumaBase registry, compared to those provided by the BAAC and the Rhone registry.
-
Business phone use during driving (TelProf): this exploratory analysis seeks to identify and learn more about the use of the telephone and nomadic systems by professionals. This study aims to provide ergonomic recommendations for the development of specific systems for professionals.
-
Senior citizens’ driving: accountability and adaptation (Cosera): the aim of this study is to improve knowledge of the road risk incurred by older road users due to their greater physical frailty and age-related cognitive impairment. Its second objective is to propose potential areas for improvement of interventions and educational activities.
-
Accessibility of the driving test for the deaf (Acosur): the aim of this research is to elaborate and assess a unique type of support, based on graphic visualisations and video content to facilitate learning the Highway Code for members of the public with linguistic difficulties.
References
CGSP (2013), L’évaluation socioéconomique des investissements publics. Commissariat général à la stratégie et à la prospective (CGSP), Paris.
Websites
-
ONISR – The French Road Safety Observatory: www.securite-routiere.gouv.fr/la-securite-routiere/l-observatoire-national-interministeriel-de-la-securite-routiere.
-
Road Safety in France: 2014 Annual Report. www.securite-routiere.gouv.fr/la-securite-routiere/l-observatoire-national-interministeriel-de-la-securite-routiere/accidentalite-routiere
-
French Road Safety Results- Provisional 2015. www.securite-routiere.gouv.fr/la-securite-routiere/l-observatoire-national-interministeriel-de-la-securite-routiere/english-version/road-safety-annual-reports-in-france.
-
-
IFSTTAR – The French Institute of Science and Technology for Transport, Development and Networks: www.ifsttar.fr/.
-
CEREMA – The French Research Centre on Risks, Environment, Mobility and Planning www.cerema.fr.
-
Health and Driving: This website gathers information from the latest news and scientific papers driving ability. http://medecins.inserr.org/.
← 1. All data stem from the Observatoire national interministériel de la sécurité routière (ONISR) and IRTAD unless otherwise noted. Data presented in this report concern the French metropolitan area. For more information please contact: [email protected].