Chapter 11. Finland
This chapter presents 2014 road safety data for Finland along with provisional data from 2015. It looks at trends in traffic and road safety from the years 1990 to 2014 and road user behaviour patterns. This includes data on speed, drink driving, drugs and driving, distracted driving, fatigue and seat belt usage. The chapter reviews Finland’s road safety strategy and national targets to 2020 and the progress achieved thus far. It also looks at recently implemented safety measures.1
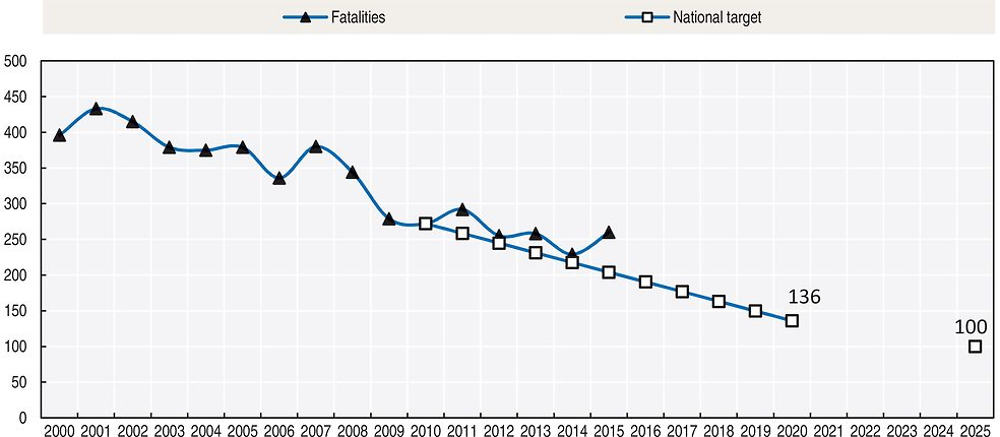
Overall positive safety trend in Finland continued in 2014, showing a decrease in the number of fatalities (-11%) compared to the previous year. The number of injury crashes remained at the same level as 2013. However, while the numbers of fatal crashes involving mopeds, motorcycles and passenger cars have decreased, the number of those killed amongst vulnerable users (cyclists and pedestrians) has increased. The target set for 2014 was nearly met (229 was 10 fatalities above the target). At the current pace, it is estimated that the 2020 target will be reached for injuries but not for fatalities.
Road safety data collection
Definitions applied in Finland
-
Road fatality: A person who died immediately in a crash or within the following 30 days. Suicides and presumed suicides are not removed from the statistics.
-
Injured person (as defined in police reports): A person not fatally injured in a traffic crash, but requiring medical care or observation in hospital, treatment at home (sick leave) or surgical treatment, such as stitches. Persons who sustain bruises or scratches that do not require the aforementioned treatment are not accounted for as “injured”. The classification “injured” is determined by the police officers present at the scene of the crash.
-
Seriously injured person: A person who suffers injuries with a score of three or above on the Abbreviated Injury Scale (MAIS3+).
Data on serious injuries have been reported from 2014 onwards and are integrated into the Statistics Finland database. This contains crash data reported by the police, complemented by injury severity information coming from the health care database.
Data collection
Traffic crash data in Finland are collected through two different channels: the police and the insurance companies.
Statistics Finland receives data on road traffic crashes from the police. Local police districts transfer the data to a central register, from which new data are processed and transferred to Statistics Finland three times a month. Statistics Finland verifies the data; make further enquiries to the police districts and, where necessary, supplements the data with data from other registers.
Statistics Finland supplements its annual data with data on deaths derived from statistics on causes of death. The data are also supplemented with information on crash locations from the Finnish Transport Agency’s Digiroad information system; data from the Rescue Services’ PRONTO statistics on resources and crashes; data on coercive measures from Justice Statistics; and data on fatal drink-driving crashes from the road crash investigation teams. Data on road traffic crashes are also supplemented annually by the Finnish Transport Safety Agency’s data on driving licences and motor vehicles.
Statistical coverage of fatal crashes is 100%. Reporting is controlled using death certificates. Due to the comprehensive coverage and severity, the number of traffic fatalities is a more reliable indicator of the trend in road safety than the figure for crashes. Coverage of injury crashes is about 20%. Coverage is worst for cyclists injured in single crashes. Many of the injury crashes are not reported to the police because, in a number of cases, the injuries are slight and compensation is settled between the parties involved.
In addition to statistics based on police reporting, the Traffic Safety Committee of Insurance Companies (VALT) compiles and publishes statistics on crashes investigated by the road crash investigation teams and crashes for which insurance compensation has been paid. The road crash investigation teams investigate nearly all fatal road traffic crashes in Finland. The findings of the teams are assembled into annually published reports, and the data are also used for special studies. The insurance company data are primarily based on information reported by insured policyholders. It is most useful in the case of damage-only crashes, as many minor crashes are reported to the insurance company but not to the police.
Hospitals and health centres also compile statistics on cases of traffic crashes, but the data collected are mainly intended for health-care services and cannot be properly used for traffic safety purposes. These data can be used as supplementary material, as they contain information excluded from other statistics, such as injuries caused in pedestrian and bicycle traffic.
Since 2014, police and hospital data have been linked to facilitate correct estimation of the number of serious injuries (defined as MAIS3+). More information can be found at: http://tieliikenneonnettomuudet.stat.fi/tieliikenneonnettomuudet_en.html.
Most recent safety data
Road crashes in 2015 – provisional data
Based on provisional data, there were 260 road fatalities in 2015, 31 more than in 2014. This represents a 13% increase in road fatalities in 2015 compared to 2014. The number of reported injury crashes is lower by 3% compared to 2014.
There is no immediate explanation for this increase. Numbers are rather low from a statistical point of view. Nevertheless, it can be noted that traffic volume increased by around 2% on main roads in 2015.
Road crashes in 2014
Overall, a positive safety trend continued in 2014, showing a decrease in the numbers of fatalities (-11%) compared to the previous year. The number of injury crashes remained at the same level as 2013. However, while the numbers of fatal crashes involving mopeds, motorcycles and passenger cars have decreased, the number of those killed amongst vulnerable users, cyclists and pedestrians has increased.
The number of fatal crashes involving heavy trucks continued to decrease in 2014, for the second year in a row. The number of fatal moped crashes has decreased since 2011, when a mandatory training and driving test for moped riders was introduced, reaching a record low of 3 fatalities in 2014.
Trends in traffic and road safety (1990-2014)
Traffic
In the last 25 years (1990-2014), distance travelled has increased by 37%. More recently, over the last 10 years, distance travelled by cars and vans has increased by 6%. In 2012 and 2013, it decreased slightly from the 2011 level, probably as a result of the economic downturn. In 2014 and 2015, distance travelled once again increased.
Road safety
Crashes and casualties
Between 1990 and 2014, the number of deaths decreased by 65.5%. In recent years (2000-14), deaths decreased by 42%. Overall, pedestrian and cyclist fatalities and those in urban areas decreased more than fatalities for car occupants and those in rural areas, with slight variations in the trends for pedestrians and cyclists for some recent years.
No single measure can be identified as the main reason for this positive road safety development. Between 2000 and 2014, a number of measures were implemented including:
-
lower speed limits in most urban areas
-
construction of pedestrian and bicycle paths
-
construction of 260 km of motorways
-
installation of automatic speed cameras on nearly 2 000 km of main roads
-
reform of driver education
-
renewal of the car fleet, with better safety performance and occupant protection than 15 years ago.
Rates
Since 1990, the death rate per 100 000 inhabitants has decreased by 67.8% and the death rate per billion vehicle-kilometres by about 74%. In 2014, the death rates per 100 000 inhabitants as well as per billion vehicle-kilometres were at 4.2.
Analysis of seriously injured data
In 2014, 519 persons injured in a traffic crash reported by the police had an MAIS of 3 or above and were considered seriously injured. This is a lower number than expected. In 2010, there were around 800 seriously injured persons (Trafi, 2014); however the conversion from the International Statistical Classification of Diseases (ICD10) to the Abbreviated Injury Score (AIS) was somewhat different in the 2010 estimation.
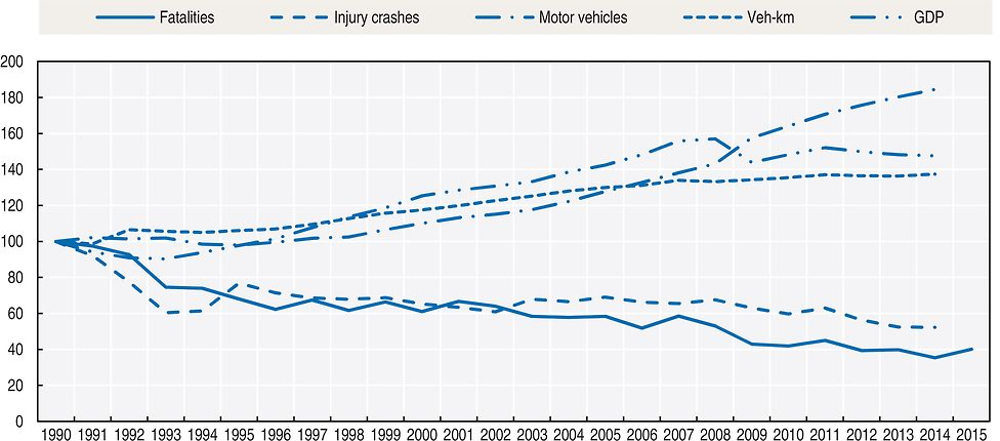
Source: World Bank for Gross Domestic Product (GDP; constant prices).
Road safety by user group
All user groups have benefited from important safety improvements since the 1990s. Cyclist and pedestrian user groups benefited the most from the progress in safety. There has also been a sharp drop in fatalities among moped riders.
However, the safety situation for motorcyclists has deteriorated since 2000. There were 10 motorcyclists killed in 2000 and 24 in 2013. Motorcycling grew rapidly in the 2000s and the number of registered motorcycles increased by 63% in that 10 year period. However, a positive change was observed in 2014, with 7 fewer motorcyclists killed. The number of injured motorcyclists also increased by 58% between 2000 and 2010, from 404 to 638, but decreased to 496 in 2014. There is no data on motorcycle traffic volume, and therefore it remains unclear whether the positive trend in motorcycle fatalities and crashes is due to reduced traffic.
Injury crashes involving mopeds more than doubled between 2000 and 2008, probably due to the increase of the moped fleet. The maximum was around 900 crashes in 2009. In 2012, 2013 and 2014, there were significantly fewer moped crashes, around 570 per year, due to new legislation requiring mandatory driving lessons and a driving test for moped riders, along with a decrease in registration of new mopeds.
Road safety by age group
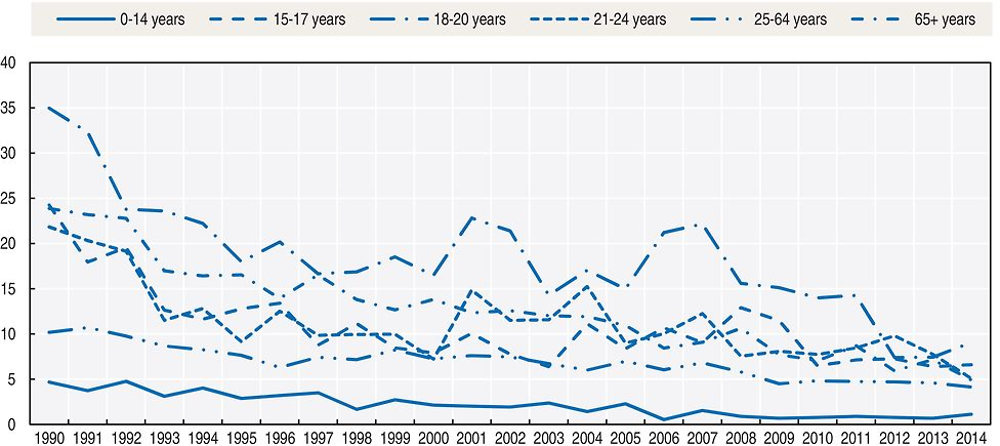
Since 1990, the reduction in fatalities has benefited all age groups, with the most impressive reduction for the youngest groups (0-14), for which fatalities decreased by almost 80%, from 45 in 1990 to 10 in 2014.
While the 18-20 age group has a mortality rate much higher than the other age groups, it was reduced by half in 2012 compared to 2010 then stabilised in 2013 and 2014, with a fatality rate of 9 killed per 100 000 population in 2014.
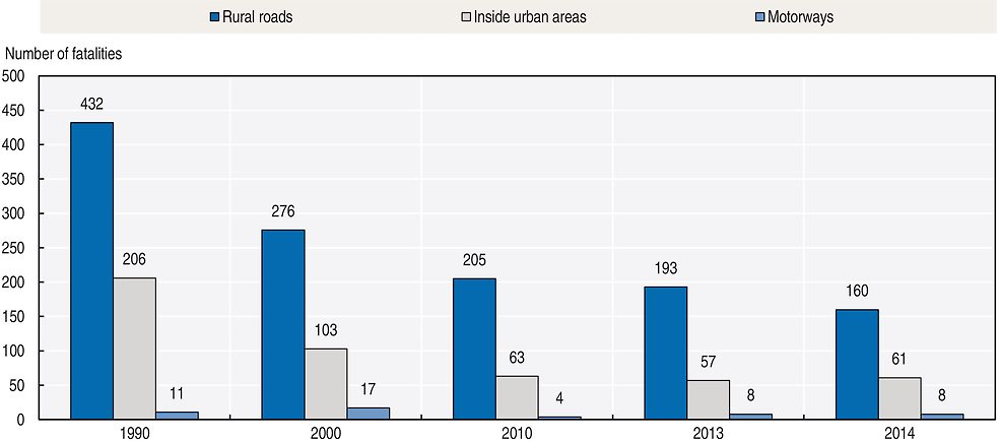
Road safety by road type
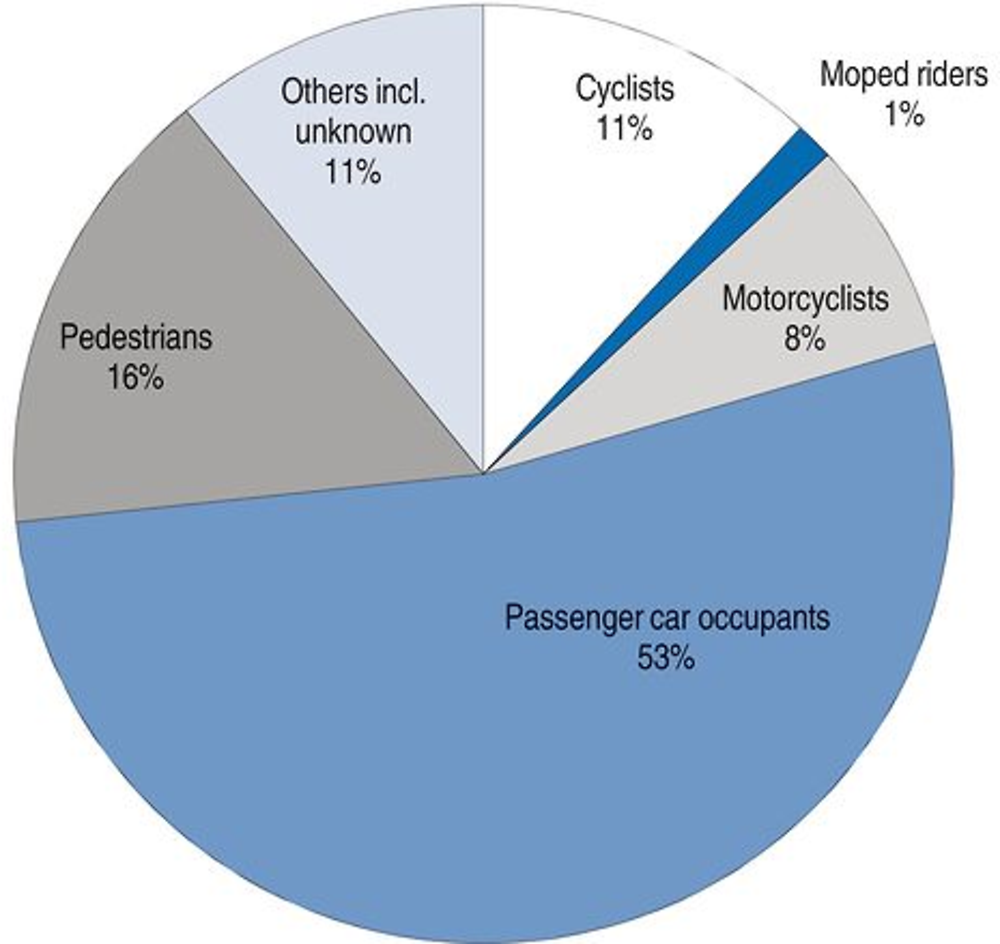
In 2014, around 70% of fatalities occurred on rural roads, 27% in urban areas and 3% on motorways. Since 1990, the reduction in deaths has been greater on urban roads.
Approximately one third of fatalities are due to frontal crashes, which typically occur on main roads outside built-up areas. Another third of fatalities are run-off-road crashes, typically on small country roads. Finland only has about 880 km of motorways, and they account for a minor share of crashes. High-risk roads are usually those with a single carriageway, no central fencing and 80 km/h or 100 km/h speed limits.
Economic costs of traffic crashes
The economic and social cost of road crashes is estimated based on actual medical and intervention costs (health care, police, fire brigade, etc.); loss of production calculated through an estimate of lost labour time; and loss of human well-being estimated on the basis of a willingness-to-pay method using values from other Nordic countries.
Cost analysis is conducted and updated every five years. In the near future, health care information on crash severity will be integrated to improve the estimates of health costs.
In 2014, the cost of road crashes based on police reported crashes was EUR 2.7 billion. This does not include costs associated with non-reported crashes.
Trafi is currently working in defining a monetary value for MAIS3+.
Recent trends in road user behaviour
According to the report from the road crash investigation teams, speeding or inappropriate speed is a contributing factor in 42% of all motor vehicle fatal crashes.
There have not been any major changes in mean speed over the past 10 years. Reduction of the mean speed by 1-3 km/h has been observed on road sections where speed cameras have been installed. While a high proportion of drivers exceed the speed limit, especially during the winter months when speed limits are lowered, the percentage of drivers speeding 10 km/h above the limit is relatively low: In 2015, 10% of drivers exceeded the speed limits by more than 10 km/h in summer and 14% in winter on main roads.
Speed cameras, implemented mainly during the 2000’s, cover around 3 000 km of the main roads.
The table below summarises the main speed limits in Finland.
Drink driving
The maximum authorised blood alcohol content (BAC) is 0.5 g/l for all drivers. In 2014, it was estimated that 18% of fatal crashes involved a driver with a BAC above the 0.5 g/l limit (this share was 24% in 2010, 25% in 2011, 17 % in 2012 and 22 % in 2013). It is typical in alcohol-related fatal crashes that the driver is strongly intoxicated. In 2014, 70% of drivers responsible for a fatal crash exceeded 1.2 g/l, the limit of aggravated drunk driving.
Those who die in drunk-driving crashes are most often the drunk drivers themselves. From 2013-15, 69% of killed persons were drunk drivers, 25% were their passengers and 6% were others.
The percentage of drivers under the influence of alcohol in traffic has slowly decreased from 0.25% in 1990. In 2013 and 2014, 0.14% of drivers had a BAC above the legal limit (Löytty, 2015).
Drugs and driving
In 2014, 13 drivers involved in fatal crashes were suspected of driving under the influence of drugs (17 drivers in 2013). 5 of them also had a BAC above the 0.5 g/l limit.
Distraction
In Finland, it is forbidden to drive with a hand-held mobile phone, while hands-free devices are tolerated. Around three fatal crashes every year are related to mobile phone use while driving (Jääskeläinen, 2014).
Sleepiness and fatigue
Road accident investigations teams have assessed that falling asleep or a decrease of alertness was the immediate risk factor in 14 fatal crashes in 2014. A total of 34 crashes involved background risks related to fatigue or decrease of alertness.
Seat belts and helmets
Seat belt use has been compulsory for front seats since 1975 and for rear seats since 1987. There has been a significant increase in seat belt use by car drivers since 1980.
Based on monitoring by Liikenneturva the seat belt wearing rate is 96% for front seats on rural roads, 93% for front seats on urban roads, and 88% for rear seats.
According to the road crash investigation teams, 39% of car or van occupants killed were not wearing a seat belt. It is estimated that 100% seat belt usage would have saved 30 lives in 2012.
Under Finnish law, children under 135 cm in height must wear a safety device determined by their weight when in a car.
Helmet wearing is compulsory for all motorcycle and moped riders.
Although it has been mandatory to wear a helmet while cycling since 2003, this is not enforced. The bicycle-helmet usage rate was 25% in 2004 and reached 41% in 2014. Most small children wear helmets, but teenagers and elderly people tend not to do so. The usage rate in Helsinki is about 60%, but rates in northern Finland are much lower.
National road safety strategies and targets
Organisation of road safety
The Ministry of Transport and Communications is responsible for drafting legislation concerning road safety.
The Ministry’s main agencies involved in road safety are:
-
The Finnish Transport Agency, which is responsible for road design, construction and maintenance, and for road and traffic signs.
-
The Finnish Transport Safety Agency, which is responsible for vehicle registration, supervision of driving schools and driving licence operations, and organisation of matters related to vehicle inspection. The agency’s responsibilities also include campaigning for road and traffic safety.
-
Liikenneturva (Finnish Road Safety Council) which implements campaigns for road and traffic safety, disseminates information, contributes to road safety education for various age groups and provides further training for drivers.
Road safety strategy for 2011-20
The road safety programme for the years 2012-14 has ended. Preparations for a new programme have started.
Road safety targets
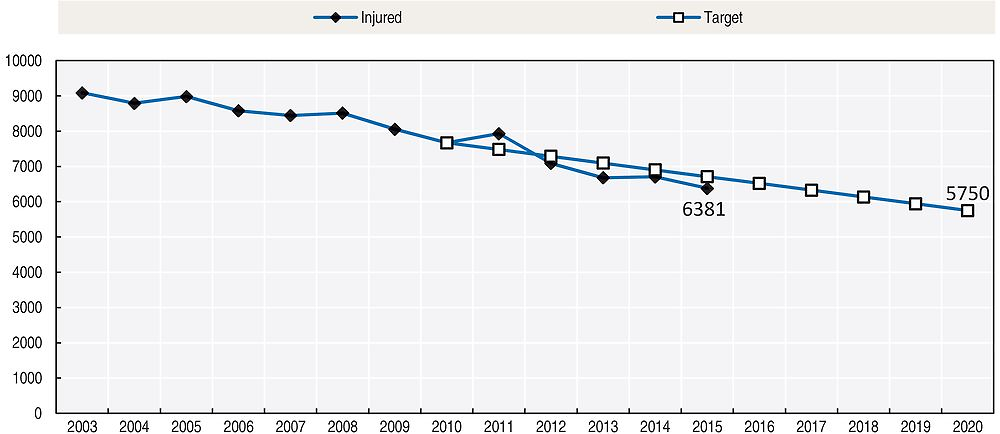
The target for 2020 is based on the target set by the European Commission to reduce by half the number of fatalities by 2020 compared to 2010 level. In addition, there is a target to reduce by 25% the number of persons seriously injured.
The corresponding numerical targets are:
-
fewer than 219 fatalities (or 40 fatalities per million inhabitants) by 2014
-
fewer than 137 fatalities (or 24 fatalities per million inhabitants) by 2020
-
fewer than 5 750 police-reported injuries by 2020
-
long-term target of fewer than 100 fatalities by 2025.
Monitoring targets
The target set for 2014 was nearly met (229 was 10 fatalities above the target). At the current pace, it is estimated that the 2020 target will be reached for injuries but not for fatalities.
Implementation of the 2012-14 road safety programme was reviewed. Of the approximately 80 road safety measures included in the programme, nearly half were implemented well, about 40% were implemented partially, and six measures were not implemented at all. Campaigning, education, norms and studies were implemented well, while road improvements and increase of automatic traffic enforcement were implemented poorly. Road improvements lacked adequate funding.
When this programme was planned it was estimated that, if the implementation was extensive and efficient, it would reduce the annual number of road fatalities by 30-40 by 2014. However, the review indicates that only 14-18 fatalities were prevented. The most important measures implemented were the increased use of safety devices (helmets, seat belts, and reflectors), several campaigns and changes in winter maintenance and speed limits. The main shortcomings in the programme implementation were low use of alcolocks, no increase in fixed automatic speed enforcement, slow penalty system development and far fewer roads with median barrier than planned.
In the future, road safety programmes should be better integrated with target setting and steering in the various administrative sectors. Implementation of the programme should be better monitored and content of the programme should be modified when problems arise with fulfilment or changes in road safety.
Recent safety measures (2013-16)
Road safety management
Transport companies
-
The Transport Safety Agency is developing a management and practice model for road transport companies to promote safety culture in commercial traffic and a responsible and environmentally friendly operation.
Driving license
-
The new law on drivers’ licences came into force on 19 January 2013, with changes concerning licences and education. Different licences are now required for light four-wheel vehicles (moped cars) and moped licences.
Road users
Enforcement
-
Almost all fixed fines were doubled in September 2015. Now the lowest fine is EUR 20 and the largest EUR 200. Speeding is the most common reason for a fixed fine.
-
Installation of plate-recognition devices in police cars started in 2014. As of April 2015 around 100 devices were in use.
Vehicles
-
Finland’s vehicle fleet is one of the oldest in the European Union. The average age of passenger cars in traffic is 11 years. A trial incentive programme for car scrappage was conducted in 2015 to promote the replacement of old vehicles with modern vehicles. Around 8 000 old cars were replaced by new vehicles producing carbon dioxide emissions of 120 g/km or less.
-
At the beginning of 2016, a new classification for new types of very light electric vehicles came into force. Vehicles such as senior scooters and electric skateboards with a maximum speed of 15 km/h and a maximum power of 1 kW are considered as “pedestrians”. These devices are allowed on the sidewalk when travelling at walking speed and on bicycle paths when travelling at higher speeds. Vehicles with a maximum speed of 25 km/h and a maximum power of 1 kW power are considered as “bicycles”.
-
Finland will provide an Arctic intelligent transport system (ITS) test site for automated driving, designed for verifying and validating new ITS solutions and innovations in Arctic conditions with extreme seasonal changes. www.snowbox.fi/.
High capacity vehicles
-
Special permits for High Capacity Transport vehicle combinations have been granted since November 2013. At the end of 2015, there were 11 vehicle combinations in use, transporting sea containers, timber and foodstuff.
Recent and ongoing research
Some research projects are presented below.
-
Evaluation of the impacts of road traffic automation. The main focus areas in the study were the use and acceptance of the systems and the impacts on traffic flow and the transport system. www.trafi.fi/filebank/a/1421850491/c57dad45a028a573735b6850e24 c89d0/16652-Trafi_tutkimuksia_01-2015_-_Automaattiajaminen.pdf.
-
In Finland, all 120 km/h and most 100 km/h speed limits are reduced by 20 km/h during the winter months. According to a new study, the relative safety effect of lower wintertime speed limits has remained constant since the last evaluation a decade ago. The estimated benefit is a reduction of 15% in injury crashes and 29% in fatalities on these roads. http://www2.liikennevirasto.fi/julkaisut/pdf8/lts_2015-61_talviajan_no peusrajoitusten_web.pdf.
-
A browser-based learning game application for children aged 6 to 10 was launched, for improving the anticipation and observation skills needed when cycling in traffic: www.trafi.fi/filebank/a/1439879581/7f15ee21e2f0cdb69a37b57ea5ef934c/18289-Trafin_ tutkimuksia_13_2015_Liikenteen_havainnointia_opettava_peli_lapsipyorailijoille.pdf.
References
Official Statistics of Finland (OSF), Statistics on road traffic accidents, www.stat.fi.
Finnish Transport Safety Agency (Trafi), Finnish Road Traffic 2015: Safety and environmental impacts, http://katsaukset.trafi.fi/media/katsaukset/tieliikenne/finnish-road-traffic-2015.pdf.
Finnish Transport Safety Agency (Trafi), Finnish Road Traffic 2014: Safety and environmental impacts, http://pinnalla.trafi.fi/e-julkaisut/finnish_road_traffic_2014/pdf/Trafi__Finnish_roadtraffic_2014_EN.pdf.
Finnish Transport Safety Agency (Trafi) (2014), Tieliikenteessä vakavasti loukkaantuneiden määrän arviointi VAAKKU (Evaluation of the number of people seriously injured in road traffic), www.trafi.fi/filebank/a/1416923679/b8f9e9b07b0dca1231c3958a3c995e52/16298-Trafin_tutkimuksia_10-2014_-_Vakavasti_ loukkaantuneet.pdf.
Websites
-
Finnish Transport Safety Agency (Trafi): www.trafi.fi.
-
Ministry of Transport and Communications: www.lvm.fi.
-
Finnish Transport Agency: www.liikennevirasto.fi.
-
Liikenneturva – Finnish Road Safety Council: www.liikenneturva.fi.
-
Statistics Finland: www.stat.fi/index_en.html.
← 1. All data stem from the Finnish Transport Safety Agency (Trafi) and IRTAD unless otherwise noted. For more information please contact: [email protected].