Online Data Annex: Resources for Future Well-Being
This online-only annex provides detailed information about definitions, levels and (where available) changes since 2005 for the indicators on resources for future well-being featured in How’s Life? 2017. These indicators cover stocks of various types of capital (usually expressed on a per capita basis), flows (e.g. investment and depreciation bearing on these stocks) and risks that may negatively affect these stocks in the future. This illustrative set of measures concerning natural, human, economic and social resources (or “capital”), together with the statistics presented in the Online Data Annex: Current Well-Being, provide the foundation for the analysis in Chapter 1, and for the country profiles presented in Chapter 5. The dashboard found on the third page of each country profile, includes indicators drawn from both this annex and the online annex on indicators for current well-being; this is because, in some cases (i.e. exposure to air pollution, cognitive skills at 15, adult skills, long-term unemployment, life expectancy at birth, household net wealth, and voter turnout) the same indicators are relevant to both current well-being outcomes and the resources that help to sustain well-being over time.
Throughout this annex, when there are breaks in the series, non-comparable data are highlighted in grey. Missing data are denoted by “..”. ISO3 codes are used in charts and tables to identify countries. When the OECD average cannot be calculated over all OECD countries, the number of countries included is specified next to the OECD labels. The indicators shown are based on data that were last updated in the week of 24-31 July 2017.
This annex is available at www.oecd-ilibrary.org/economics/how-s-life-2017_how_life-2017-en.
NATURAL CAPITAL: Greenhouse gas emissions from domestic production
Definition
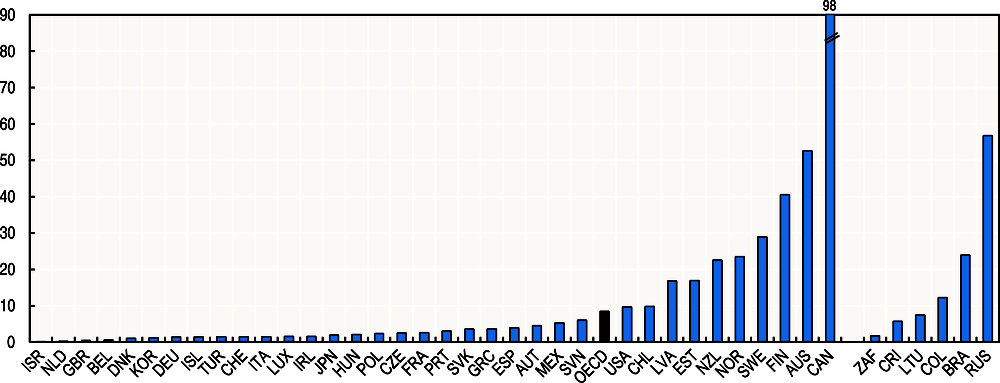
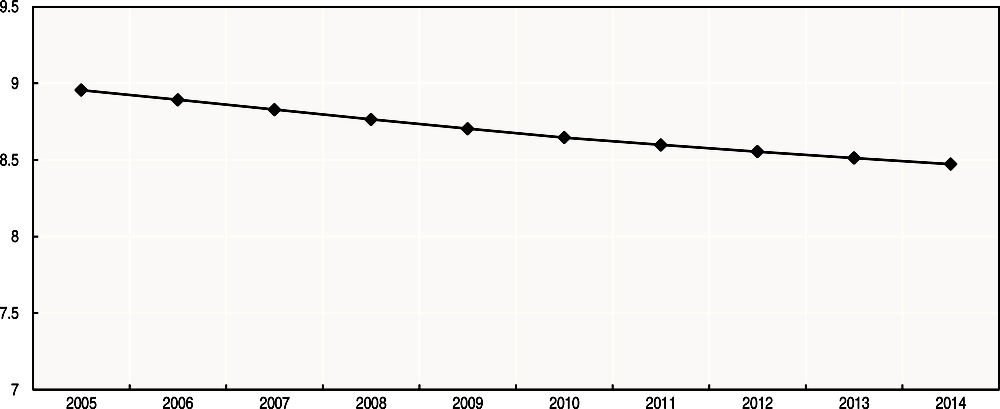
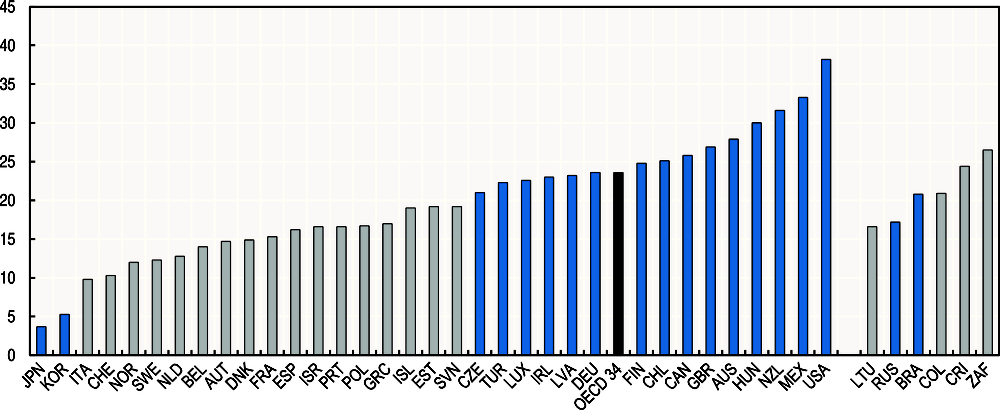
This indicator concerns man-made emissions of six different greenhouse gases – carbon dioxide (CO2, including emissions from energy use and industrial processes, e.g. cement production); methane (CH4, including methane emissions from solid waste, livestock, mining of hard coal and lignite, rice paddies, agriculture and leaks from natural gas pipelines); nitrous oxide (N2O); hydrofluorocarbons (HFCs); perfluorocarbons (PFCs); and sulphur hexafluoride (SF6) – weighted by their “warming potential”. It is expressed in tonnes per capita of CO2 equivalent. These emissions are flows that increase GHG concentrations in the atmosphere (thereby depleting a stock of natural capital). The data, which form part of the OECD Environment Statistics Database, are compiled on the basis of National Inventory Submissions 2014 to the United Nations Framework Convention on Climate Change (UNFCCC) and of replies to the OECD State of the Environment Questionnaire. The data refer to gross direct emissions excluding emissions or removals from land-use, land-use change and forestry.
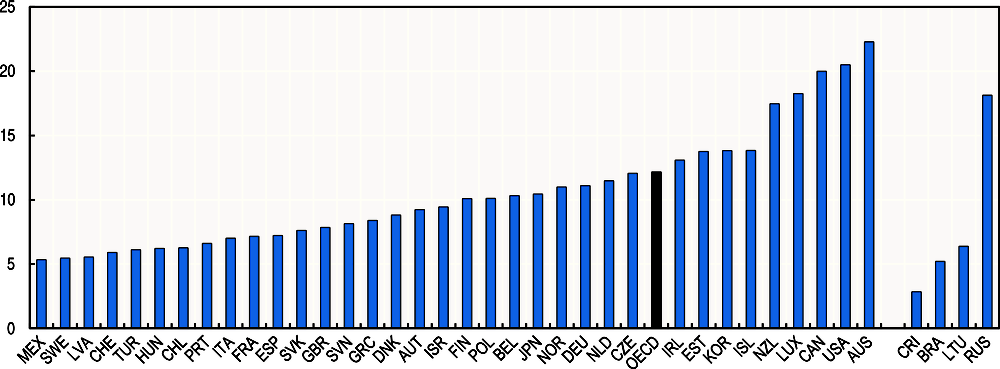
Note : The latest available year is 2014 for Israel; 2013 for Chile, Korea and Mexico; and 2012 for Brazil and Costa Rica. The OECD average is population-weighted.
Source : “Greenhouse gas emissions by source”, OECD Environment Statistics (database), https://doi.org/10.1787/data-00594-en.
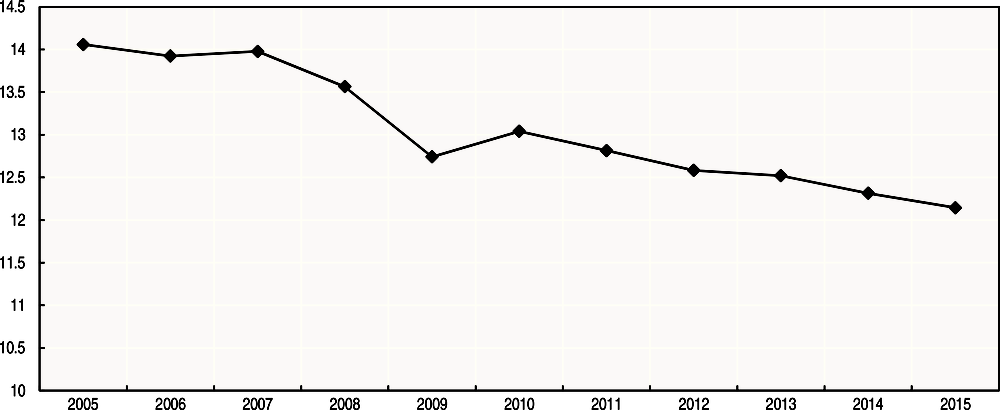
Note : The OECD average is population-weighted.
Source : “Greenhouse gas emissions by source”, OECD Environment Statistics (database), https://doi.org/10.1787/data-00594-en.
Further reading:
OECD (2012), OECD Environmental Outlook to 2050: The Consequences of Inaction, OECD Publishing, Paris, https://doi.org/10.1787/9789264122246-en.
NATURAL CAPITAL: CO2 emissions from domestic consumption
Definition
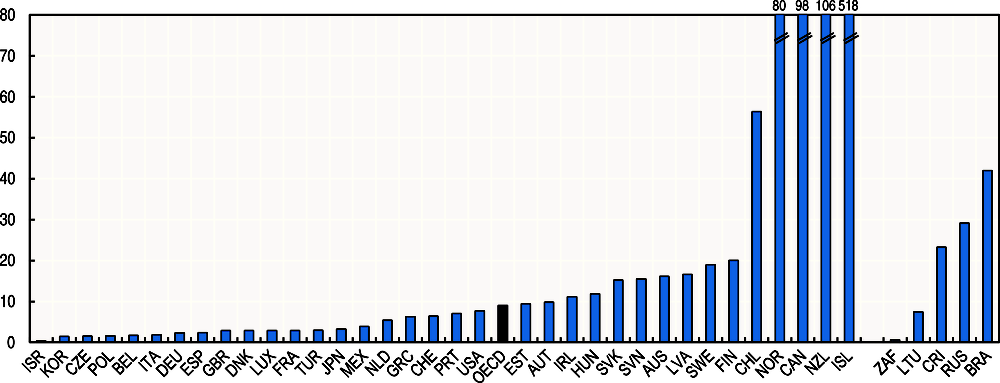
As a complement to “Greenhouse gas emissions from domestic production”, estimates of CO2 emissions from domestic consumption are also considered. This indicator is an estimate of the total emissions of carbon dioxide (CO2) associated with domestic consumption, including both CO2 emitted and consumed domestically and CO2 emitted abroad and embodied in imports. Emissions embodied in the domestic consumption of a country increase global GHG concentrations even when there are no increases in emissions from domestic production. This indicator is derived from the 2015 edition of the OECD Inter-Country Input-Output (ICIO) database, combined with IEA statistics on CO2 emissions from fuel combustion and other industry statistics. Per capita values are obtained by dividing the CO2 embodied in final demand by the country’s population data, as available in the UN World Population Prospects: The 2015 Revision, file POP/1-1. The data, which form part of the OECD Structural Analysis Databases, are compiled according to the methodology detailed in Wiebe and Yamano (2016).
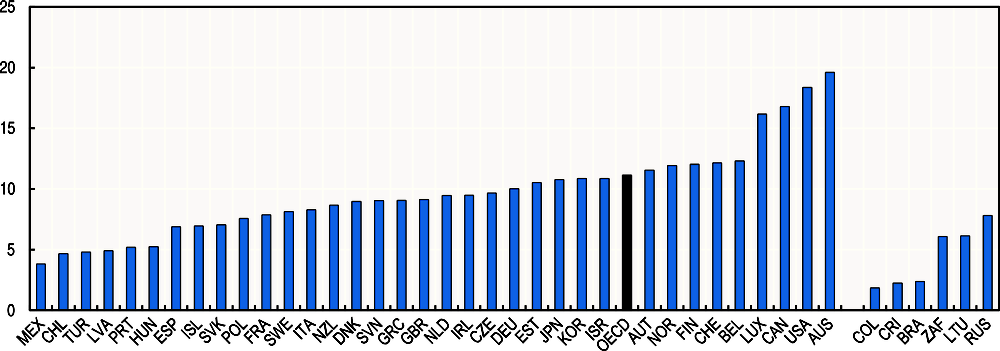
Note : The OECD average is population-weighted.
Source : “Carbon Dioxide Emissions embodied in International Trade”, OECD Structural Analysis (STAN) Databases, http://stats.oecd.org/Index.aspx?DataSetCode=IO_GHG_2015.
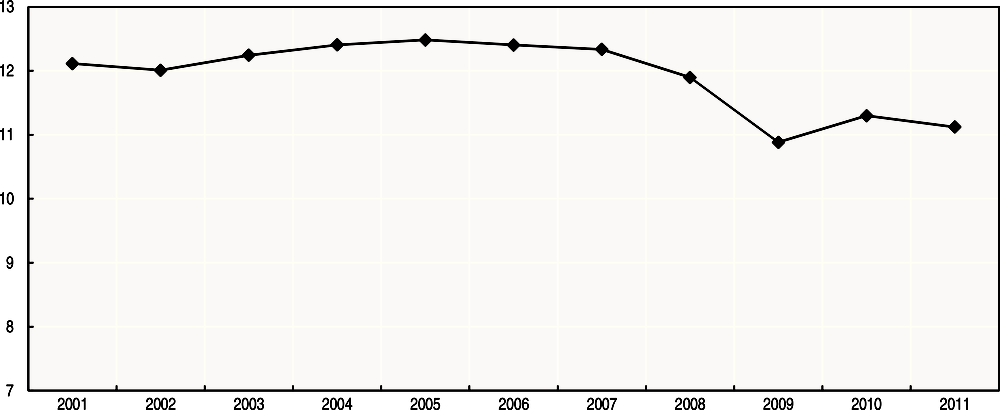
Note : The OECD average is population-weighted.
Source : “Carbon Dioxide Emissions embodied in International Trade”, OECD Structural Analysis (STAN) Databases, http://stats.oecd.org/Index.aspx?DataSetCode=IO_GHG_2015.
Further reading:
Wiebe, K. and N. Yamano (2016),“Estimating CO2 Emissions Embodied in Final Demand and Trade Using the OECD ICIO 2015: Methodology and Results”,OECD Science, Technology and Industry Working Papers, No. 2016/05, OECD Publishing, Paris, https://doi.org/10.1787/5jlrcm216xkl-en.
NATURAL CAPITAL: Forest area
Definition
This indicator refers to the stock of forest and wooded land, expressed in square kilometres per thousand people. It includes forested land spanning more than 0.5 hectares, and with a canopy cover of more than 10%, or trees able to reach these thresholds in situ. It excludes woodland or forest predominantly under agricultural or urban land use, or used only for recreational purposes. The data shown here come from the OECD Environment Statistics Database, which features data reported by UNECE and the UN Food and Agriculture Organisation’s (FAO) Global Forest Resources Assessment. The FAO’s assessment methodology relies on both country reports prepared by national correspondents and remote sensing.
Note : The OECD average is population-weighted.
Source : OECD calculations based on “Land Resources”, OECD Environment Statistics (database), http://stats.oecd.org/Index.aspx?DataSet Code=LAND_USE.
Note : The OECD average is population-weighted.
Source : OECD calculations based on “Land Resources”, OECD Environment Statistics (database), http://stats.oecd.org/Index.aspx?DataSetCode= LAND_USE.
Further reading:
OECD (2017), Green Growth Indicators 2017, OECD Green Growth Studies, OECD Publishing, Paris, https://doi.org/10.1787/9789264268586-en.
NATURAL CAPITAL: Renewable freshwater resources
Definition
This indicator is expressed as the long-term annual average availability of the stock of renewable freshwater, expressed in cubic metres per capita. It refers to the total volume of river run-off and groundwater generated, in natural conditions, exclusively by precipitation into a territory, plus the total volume of the flow of rivers and groundwater coming from neighbouring territories. This indicator is part of the OECD’s Green Growth Indicator set, and the data are drawn from the OECD Environment Statistics Database.
Note : Values for the United Kingdom refer to England and Wales only. The long-term annual average refers to the period 1961-90 for Austria; it excludes undergrounds flows and includes estimates for Belgium. Data refer to the period 1971-2004 for Canada; 2000-14 for Chile; 1974-2012 for Colombia; 1990-2014 for Costa Rica; the latest 20 years for the Czech Republic; the latest 30 years (including only data about fresh surface water) for Estonia; 1981-2010 (including inflow and outflow, with the latter computed using the throughput of rivers having their source in France but the mouth in another country) for France; 1993-2013 for Germany; 1971-2000 for Hungary; 2000-13 for Israel; 1971-2006 for Japan; 1974-2003 for Korea; 2005-13 for Latvia; 2000-14 for Lithuania; 1981-2010 for the Netherlands; 1951-2014 for Poland; 1971-2000 for Slovenia; 1990-2009 for Sweden; 1981-2010 for Switzerland; and 1980-2011 for Turkey. The OECD average is population-weighted.
Source : “Water: Freshwater resources (long-term averages)”, OECD Environment Statistics (database), http://stats.oecd.org/Index.aspx?Data SetCode=WATER_RESOURCES.
Further reading:
OECD (2017), Green Growth Indicators 2017, OECD Green Growth Studies, OECD Publishing, Paris, https://doi.org/10.1787/9789264268586-en.
NATURAL CAPITAL: Freshwater abstractions
Definition
This indicator is expressed as gross abstraction from groundwater or surface water bodies, in cubic metres per capita. It includes abstractions for agricultural (e.g. irrigation) and industrial use (e.g. cooling and industrial processes), as well as for public supply. These abstractions are a flow that depletes the available freshwater resources. For some countries, these data refer to water permits rather than to actual abstractions. This indicator is part of the OECD’s Green Growth Indicator set, and the data are drawn from the OECD Environment Statistics Database.
Note : The latest available year is 2016 for the Russian Federation; 2014 for Costa Rica, Denmark, Iceland, Israel, Korea, Mexico, Spain, Turkey; 2013 for Belgium, Canada, France, Germany and the United Kingdom; 2012 for Brazil, Colombia, Hungary, Japan, the Netherlands, Switzerland; 2011 for Australia; 2010 for New Zealand, Sweden and the United States; 2009 for Ireland; 2008 for Italy; 2007 for Norway and Portugal; 2006 for Finland; and 2005 for Iceland and Korea. Values for the United Kingdom refer to England and Wales only. The OECD average is an estimate based on imputations and excludes Chile, as no information is available for this country.
Source : “Water: Freshwater abstractions”, OECD Environment Statistics (database), http://stats.oecd.org/Index.aspx?DataSetCode= WATER_ABSTRACT and the Federal agency of water resources for the Russian Federation.
Further reading:
OECD (2017), Green Growth Indicators 2017, OECD Green Growth Studies, OECD Publishing, Paris, https://doi.org/10.1787/9789264268586-en.
NATURAL CAPITAL: Threatened species
Definition
This indicator refers to the percentage of mammals, birds and vascular plants that are critically endangered, endangered or vulnerable – i.e. those plants and animals that are in danger of extinction or soon likely to be, based on the IUCN Red List categories and criteria. The data shown here refer to threatened species as a percentage of all known species (as opposed to focusing only on indigenous species) and exclude fish, reptiles, amphibians, invertebrates or fungi. Threatened species imply a risk to the stock of biodiversity of a country. Data refer to the latest year available, which corresponds to the late 2000s for most countries. The data source is the OECD’s Green Growth Indicator set, part of the OECD Environment Statistics Database. The data on the state of threatened species are based on country replies to the Annual Quality Assurance (AQA) of OECD environmental reference series. These data are harmonised through the work of the OECD Working Party on Environmental Information (WPEI).
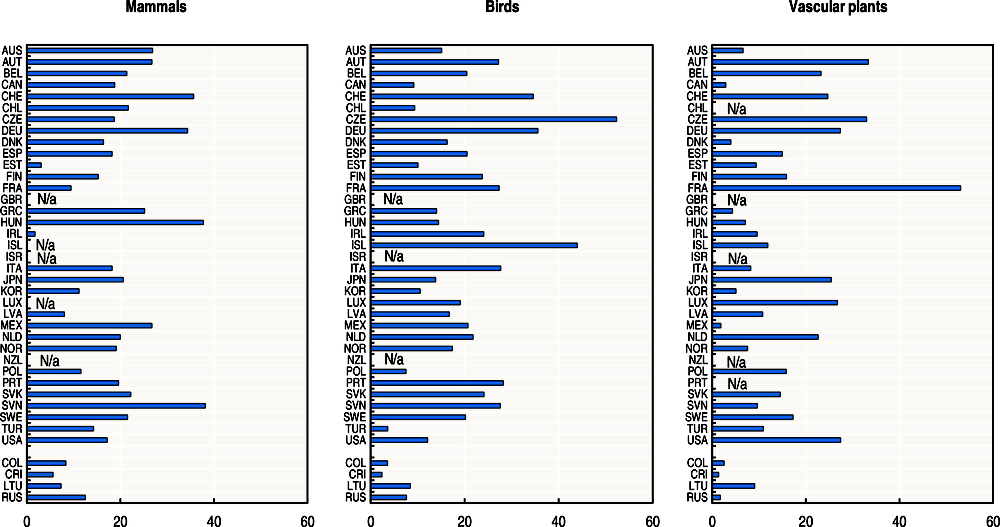
Note : “Threatened” refers to “endangered”, “critically endangered” and “vulnerable” species, i.e. species in danger of extinction and species soon likely to be in danger of extinction. The data presented here refer to the latest year available, which corresponds to the late 2000s for most countries.
Source : “Biodiversity: Threatened species”, OECD Environment Statistics (database), http://stats.oecd.org/Index.aspx?DataSetCode= WILD_LIFE.
Further reading:
OECD (2017), Green Growth Indicators 2017, OECD Green Growth Studies, OECD Publishing, Paris, https://doi.org/10.1787/9789264268586-en.
HUMAN CAPITAL: Young adult educational attainment
Definition
This indicator refers to the number of adults aged 25 to 34 having completed at least an upper secondary education, over the total population of the same age. While the educational attainment of the total population captures an important aspect of the stock of human capital of a country, this indicator is used here as it focuses on the renewal of that stock, i.e. young adults exiting the educational system to enter into the labour market. The definition of “at least upper secondary education” corresponds to the International Standard Classification of Education (ISCED 2011) levels 3 and above and includes both: i) programmes defined as “general”, which are often designed for preparing students for further education; and ii) programmes geared towards vocational education and training (VET). The data underlying this indicator are collected through the annual OECD questionnaire on National Educational Attainment Categories (NAEC) and are based on national Labour Force Survey data.
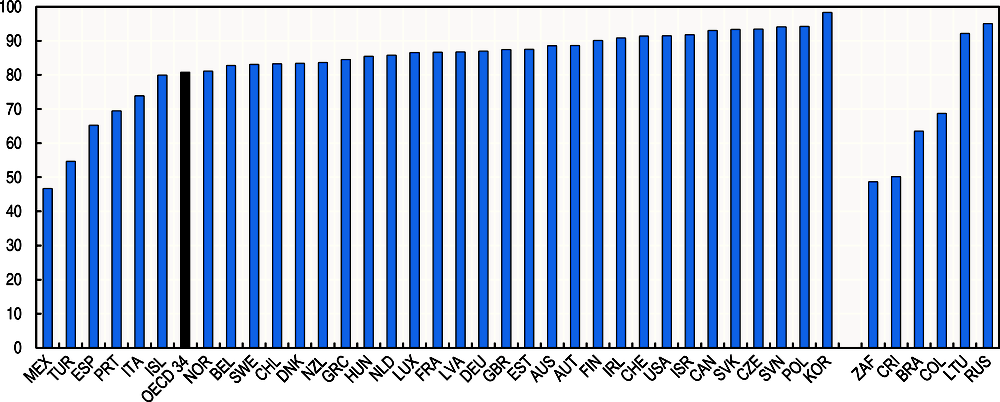
Note : Data are compiled following the ISCED 2011 classification for all countries except South Africa, where they are compiled following the ISCED-97 classification. The latest available year is 2015 for Brazil, Chile, Ireland, the Russian Federation and South Africa. The OECD average is population-weighted and excludes Japan.
Source : “Educational attainment and labour force status”, OECD Education at a glance (database), http://stats.oecd.org/Index.aspx?DataSet Code=EAG_NEAC.
Further reading:
OECD (2017), Education at a Glance 2017: OECD Indicators, OECD Publishing, Paris, https://doi.org/10.187/eag-2017-en.
HUMAN CAPITAL: Educational expectancy
Definition
This indicator is defined as the average duration of education that a 5-year-old child can expect to experience during his/her lifetime until reaching the age of 39, if current enrolment rates persist for the next 34 years. It is calculated based on current enrolment conditions by adding the net enrolment rates for each single year of age from the age of 5 onwards. This indicator provides, in a way, an advanced measure of how educational attainment will change in the future, i.e. when children will reach adult age. The data are based on the UOE (UNESCO, OECD and Eurostat) joint data collection on education systems administered annually.
Note : Data refer to 2014 for Greece and Japan. Data for Canada excludes early childhood and post-secondary non-tertiary education. The OECD average is population-weighted.
Source : OECD calculations based on “OECD (2017), Education at a Glance 2017: OECD Indicators”, OECD Publishing, Paris, https://doi.org/10.1787/eag-2017-en.
Further reading:
OECD (2017), Education at a Glance 2017: OECD Indicators, OECD Publishing, Paris, https://doi.org/10.187/eag-2017-en.
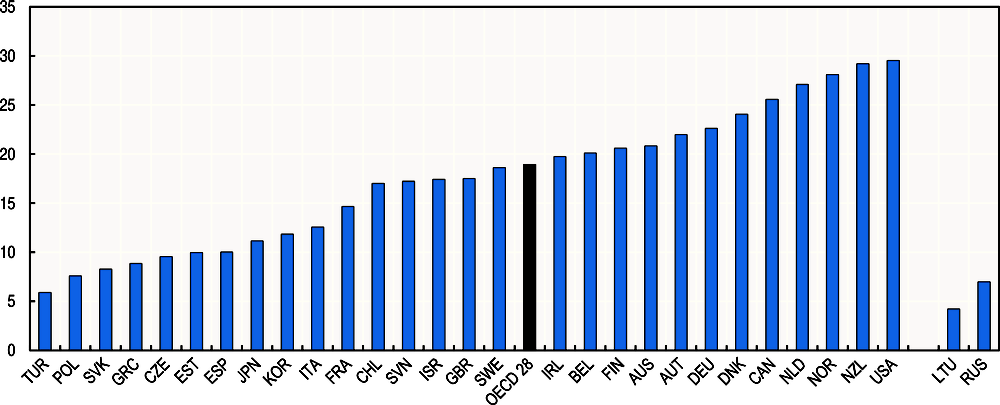
HUMAN CAPITAL: Smoking prevalence
Definition
This indicator is defined as the proportion of the population aged 15 and over who report that they are daily smokers. It is considered here as it represents a risk for future health, which is an important aspect of human capital. International comparability is limited due to the lack of standardisation in the measurement of smoking habits in health interview surveys across OECD countries. For example, there are variations across countries in the question wording, in the response categories provided to interviewees, and in the methods used for data collection. Data collections within OECD countries are also periodic rather than annual. The data come from national health interviews, health surveys and other household survey sources, and are compiled as part of the OECD’s Health Statistics Database.
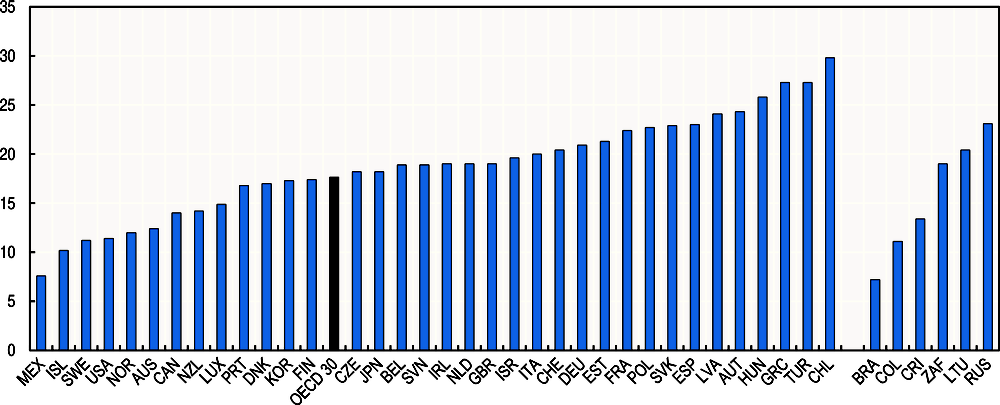
Note : The latest available year is 2015 for Brazil, Colombia, Costa Rica, Czech Republic, Finland, Japan, Korea, Mexico, South Africa, Sweden and the United States; 2014 for Austria, Belgium, Canada, France, Greece, Hungary, Latvia, Lithuania, Poland, Portugal, the Slovak Republic, Slovenia, Spain, Turkey and the United Kingdom; 2013 for Germany; 2012 for Switzerland; and 2009 for Chile. The OECD average is population-weighted and excludes Chile, Finland, Ireland, Mexico and the Netherlands.
Source : “Non-medical determinants of health”, OECD Health Statistics (database), http://stats.oecd.org/Index.aspx?DataSetCode= HEALTH_LVNG.
Further reading:
OECD (2017), Health at a Glance 2017: OECD Indicators, OECD Publishing, Paris, https://doi.org/10.1787/health_glance-2017-en.
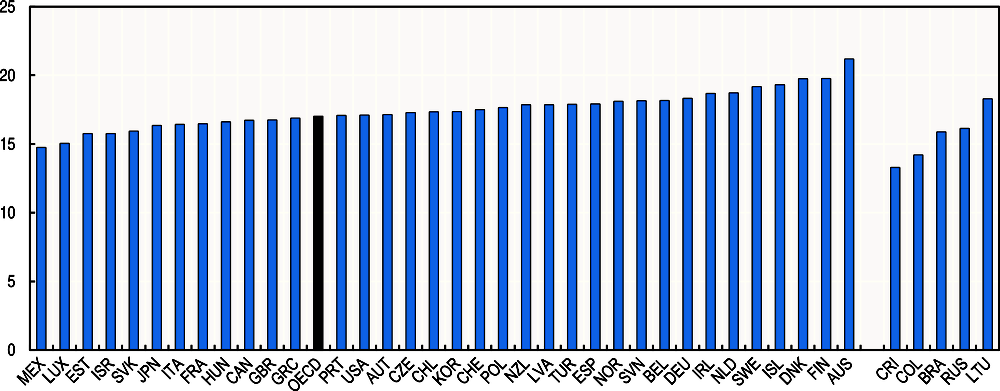
HUMAN CAPITAL: Obesity prevalence
Definition
This indicator refers to the proportion of people aged 15 and over who meet the criteria for obesity, defined as a Body Mass Index of 30 or more. This indicator is considered here as it represents a risk to future health and human capital. The Body Mass Index evaluates an individual’s weight in relation to their height (weight/height^2, where weight is measured in kilograms and height in metres). The classification for obesity used here may not be suitable for all ethnic groups, which may have equivalent levels of risk at a lower or higher BMI. The data shown here refer to different sources in different countries (see the note to Table A.36): in some countries, the data are based on self-reported information drawn from health interview surveys (which use a variety of different question formats and response scales) while in others they are measured directly in health examinations (with varied methods of administration). The estimates from health examinations are generally higher and more reliable than those from health interviews. The data are drawn from the OECD’s Health Statistics Database.
Note : The latest available year is 2015 for Iceland, Ireland, Italy, Japan, Korea, the Netherlands, Norway, Sweden and the United Kingdom; 2014 for Australia, Austria, Belgium, Colombia, Costa Rica, Denmark, France, Greece, Hungary, Lithuania, Luxembourg, Poland, Portugal, Slovenia, South Africa, Spain, the United States; 2013 for Brazil, Canada; 2012 for Germany, Switzerland; 2011 for Finland, Turkey; 2010 for the Czech Republic; 2009 for Chile. Data for Australia, Brazil, Canada, Chile, the Czech Republic, Finland, Germany, Hungary, Ireland, Japan, Korea, Latvia, Luxembourg, Mexico, New Zealand, the Russian Federation, the Slovak Republic, Turkey, the United Kingdom and the United States are based on health examinations. For all other countries (shown in grey) data are based on health interview surveys. The OECD average is population-weighted and excludes the Slovak Republic.
Source : “Non-medical determinants of health”, OECD Health Statistics (database), http://stats.oecd.org/Index.aspx?DataSetCode= HEALTH_LVNG.
Further reading:
OECD (2017), Health at a Glance 2017: OECD Indicators, OECD Publishing, Paris, https://doi.org/10.1787/health_glance-2017-en.
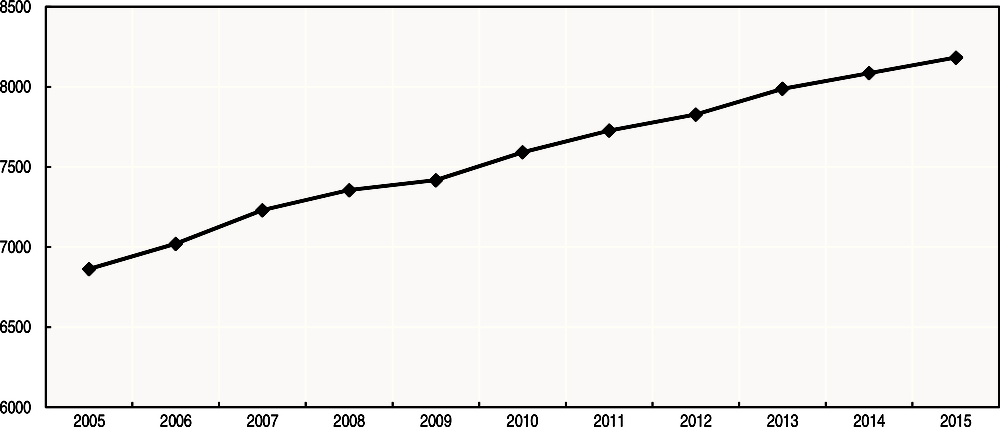
ECONOMIC RESOURCES: Produced fixed assets
Definition
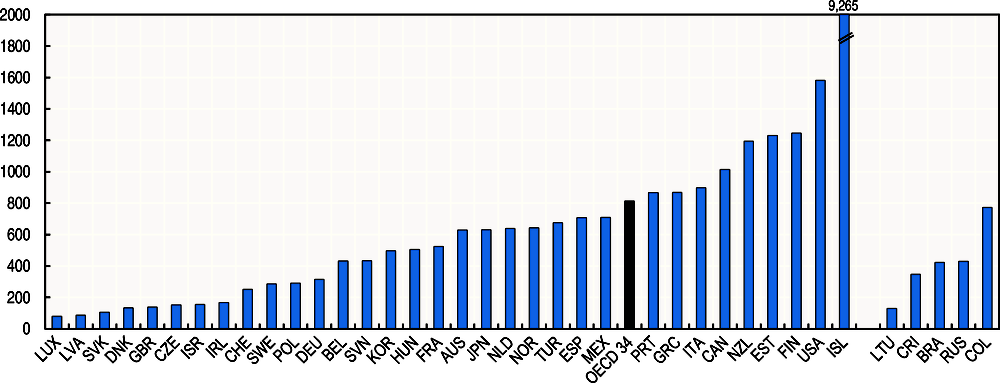
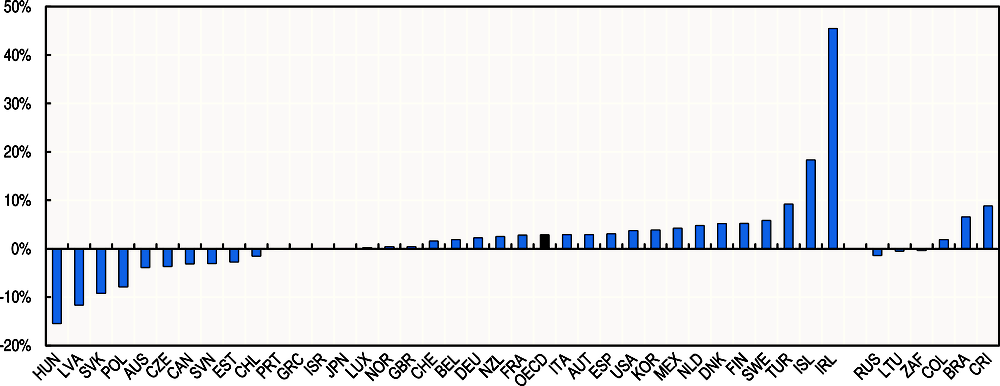
This indicator considers the value, at constant prices, of a country’s stock of produced economic assets, such as dwellings, non-residential buildings, infrastructure, machinery and equipment. The stocks are corrected to take into account the reduction in their value due to physical deterioration, normal obsolescence or normal accidental damage. These assets are derived, based on the perpetual inventory method, from past investment flows. It is presented in US dollars per capita, at 2010 prices using Purchasing Power Parities (PPPs) for GDP. The data refer to the total economy, as defined according to the System of National Accounts (SNA) 2008.
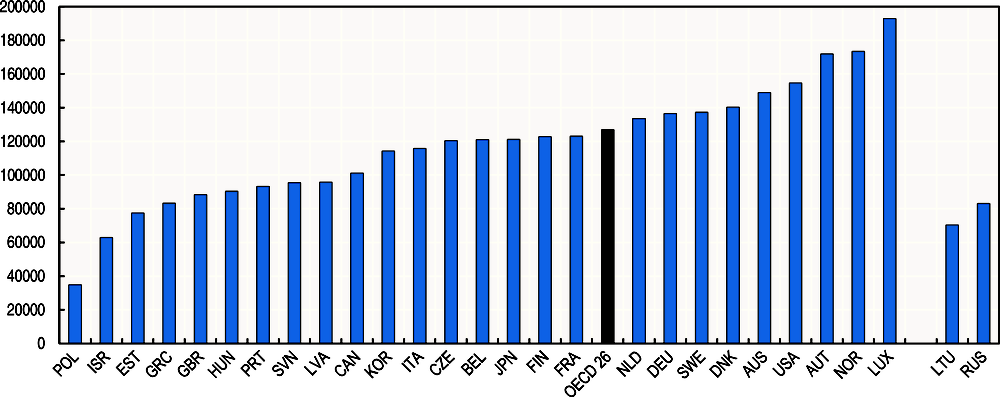
Note : The latest available year is 2016 for Canada, the Czech Republic, Finland and France; and 2014 for Belgium, Estonia, Greece, Hungary, Latvia, Lithuania, Norway, Poland and Portugal. Purchasing Power Parities (PPPs) are those for GDP and are fixed to 2010 to allow comparisons across values referring to different years. Stocks of produced assets are corrected for deterioration, obsolescence and accidental damage. The OECD average is population-weighted and excludes Chile, Iceland, Ireland, Mexico, New Zealand, the Slovak Republic, Spain, Switzerland and Turkey.
Source : OECD calculations based on “9B. Balance sheets for non-financial assets”, OECD National Accounts Statistics (database), http://dotstat.oecd.org/Index.aspx?DataSetCode=SNA_TABLE9B.
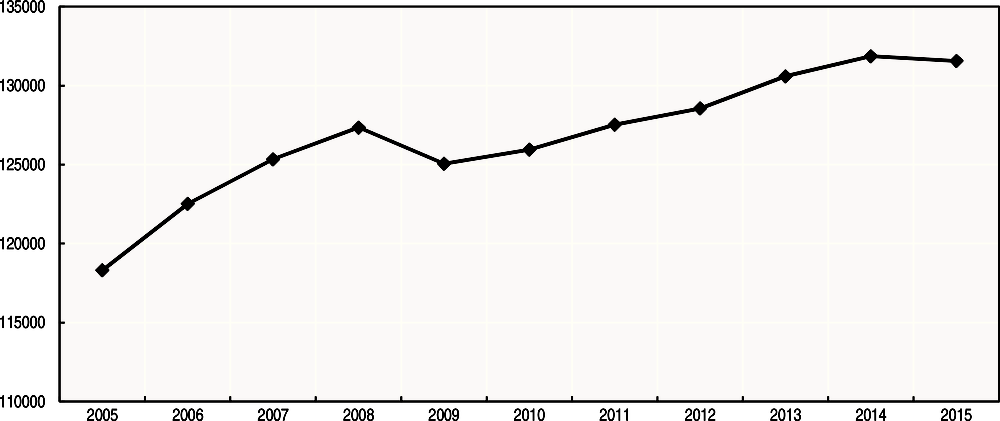
Note : Purchasing Power Parities (PPPs) are those for GDP. The OECD average is population-weighted; it excludes Belgium, Chile, Estonia, Greece, Hungary, Iceland, Ireland, Latvia, Mexico, New Zealand, Norway, Poland, Portugal, the Slovak Republic, Spain, Switzerland and Turkey, due to incomplete time series for these countries.
Source : OECD calculations based on “9B. Balance sheets for non-financial assets”, OECD National Accounts Statistics (database), http://dotstat.oecd.org/Index.aspx?DataSetCode=SNA_TABLE9B.
Further reading:
Lequiller, F. and D. Blades (2014), Understanding National Accounts: Second Edition, OECD Publishing, Paris, https://doi.org/10.1787/9789264214637-en.
ECONOMIC RESOURCES: Gross fixed capital formation
Definition
This indicator measures the total expenditures, at constant prices, devoted to buildings and machinery (i.e. investment in dwellings, buildings and other structures, transport equipment, other machinery and equipment, cultivated assets and intangible fixed assets) undertaken within a country, as defined according to the System of National Accounts (SNA) 2008. These expenditures represent a flow that adds to the stock of a country’s economic capital.
Note : The latest available year is 2015 for Australia, Colombia, Costa Rica, Israel, Japan, Korea, Mexico, New Zealand, Turkey and the United States; 2014 for South Africa; and 2011 for Brazil. The OECD average is the population-weighted average of the total expenditures devoted to buildings and machinery at constant prices.
Source : OECD National Accounts Statistics (database), https://doi.org/10.1787/na-data-en.
Note : The OECD average is the population-weighted average of the total expenditures devoted to buildings and machinery at constant prices.
Source : OECD National Accounts Statistics (database), https://doi.org/10.1787/na-data-en.
Further reading:
Lequiller, F. and D. Blades (2014), Understanding National Accounts: Second Edition, OECD Publishing, Paris, https://doi.org/10.1787/9789264214637-en.
ECONOMIC RESOURCES: Financial net worth of the total economy
Definition
This indicator refers to total financial assets minus total liabilities, expressed in per capita terms. As domestic assets and liabilities cancel each other, this measure captures the net foreign asset position of a country with respect to the rest of the world. This stock includes monetary gold, currency and other forms of bank deposits, debt securities, loans, equity and investment fund shares/units, insurance pension and standardised guarantees, and other accounts receivable/payable. Tradable instruments are recorded at current market values, whereas other instruments are valued at nominal or book values. Data in national currencies have been converted to US dollars using current PPPs for GDP.
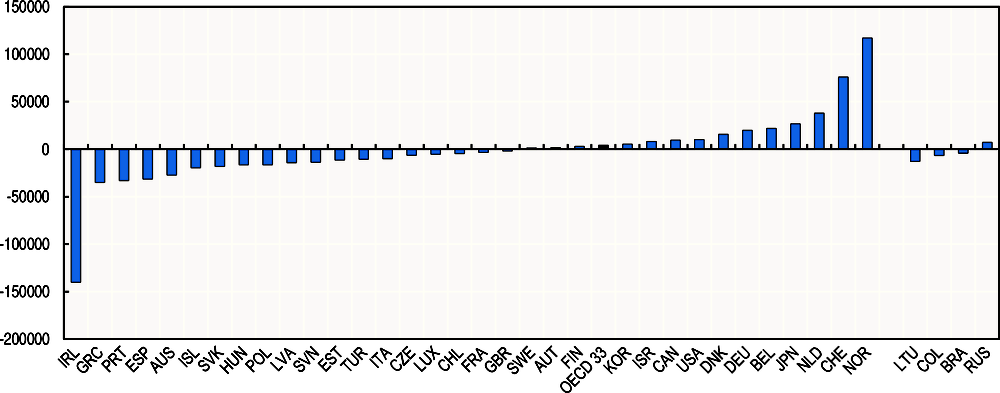
Note : The latest available year is 2015 for Australia, Canada, Chile, Colombia, Greece, Iceland, Israel, Korea, Lithuania, the Russian Federation, the Slovak Republic, Switzerland, Turkey and the United States; 2014 for Japan; and 2009 for Brazil. Purchasing Power Parities (PPPs) are those for GDP. The OECD average is population-weighted and excludes Mexico and New Zealand.
Source : OECD calculations based on OECD National Accounts Statistics (database), https://doi.org/10.1787/na-data-en.
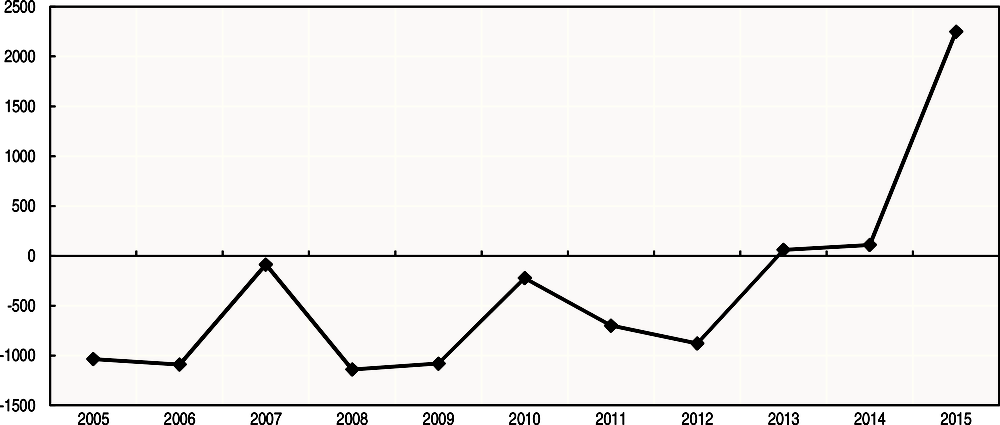
Note : Purchasing Power Parities (PPPs) are those for GDP. The OECD average is population-weighted and excludes Japan, Korea, Mexico, New Zealand and Turkey, due to incomplete time series for these countries.
Source : OECD calculations based on OECD National Accounts Statistics (database), https://doi.org/10.1787/na-data-en.
Further reading:
Lequiller, F. and D. Blades (2014), Understanding National Accounts: Second Edition, OECD Publishing, Paris, https://doi.org/10.1787/9789264214637-en.
ECONOMIC RESOURCES: Intellectual property assets
Definition
Intellectual property assets (e.g. research and development, software and databases, mineral exploration and evaluation, and entertainment, artistic and literary originals) are a measure of a country’s knowledge capital. Data are presented in US dollars per capita, at 2010 prices, using PPPs for GDP and refer to the total economy, as defined according to the System of National Accounts (SNA) 2008. These assets are derived, based on the perpetual inventory method, from past investment flows.
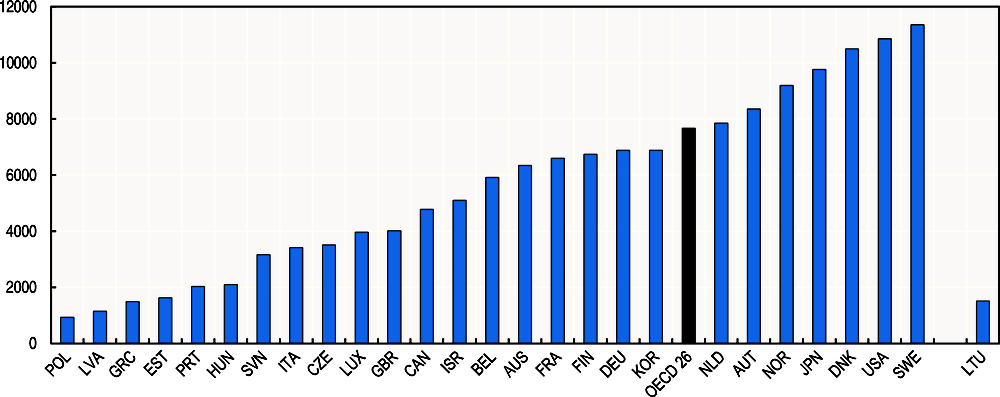
Note : The latest available year is 2016 for Canada, the Czech Republic, Finland and France; and 2014 for Belgium, Estonia, Greece, Hungary, Latvia, Lithuania, Norway, Poland, and Portugal. Purchasing Power Parities (PPPs) are those for GDP; they are fixed to 2010 to allow comparisons across values referring to different years. The OECD average is population-weighted; it excludes Chile, Iceland, Ireland, Mexico, New Zealand, the Slovak Republic, Spain, Switzerland and Turkey.
Source : OECD calculations based on OECD National Accounts Statistics (database), https://doi.org/10.1787/na-data-en.
Note : Purchasing Power Parities (PPPs) are those for GDP. The OECD average is population-weighted; it excludes Belgium, Chile, Estonia, Greece, Hungary, Iceland, Ireland, Latvia, Mexico, New Zealand, Norway, Poland, Portugal, the Slovak Republic, Spain, Switzerland and Turkey, due to incomplete time series for these countries.
Source : OECD calculations based on OECD National Accounts Statistics (database), https://doi.org/10.1787/na-data-en.
Further reading:
Lequiller, F. and D. Blades (2014), Understanding National Accounts: Second Edition, OECD Publishing, Paris, https://doi.org/10.1787/9789264214637-en.
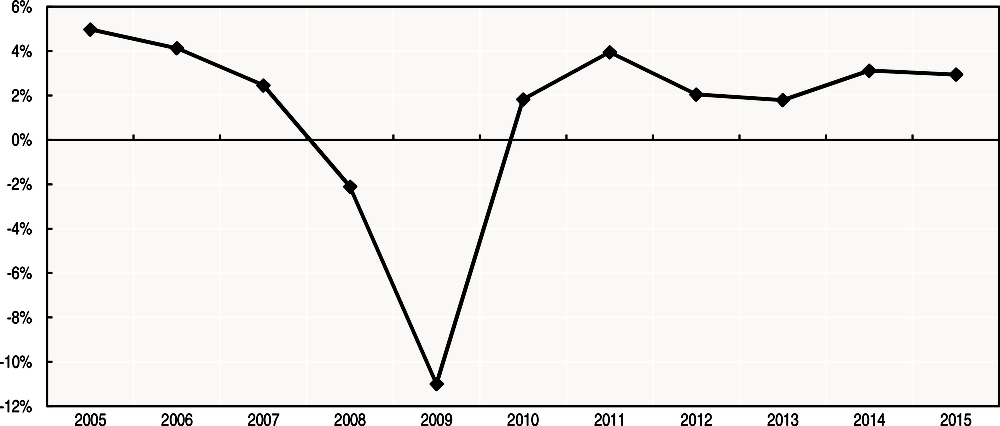
ECONOMIC RESOURCES: Investment in R&D
Definition
This indicator consists of the expenditure undertaken by resident producers on creative work carried out on a systematic basis in order to increase the stock of knowledge, including knowledge of man, culture and society, and the use of this stock of knowledge to devise new applications. Research is treated as capital formation except in cases where it is clear that the activity does not entail any economic benefit for its owner, in which case it is treated as intermediate consumption. Investment in R&D is expressed as a percentage of GDP, and represents a flow that adds to the stock of a country’s intellectual property assets.
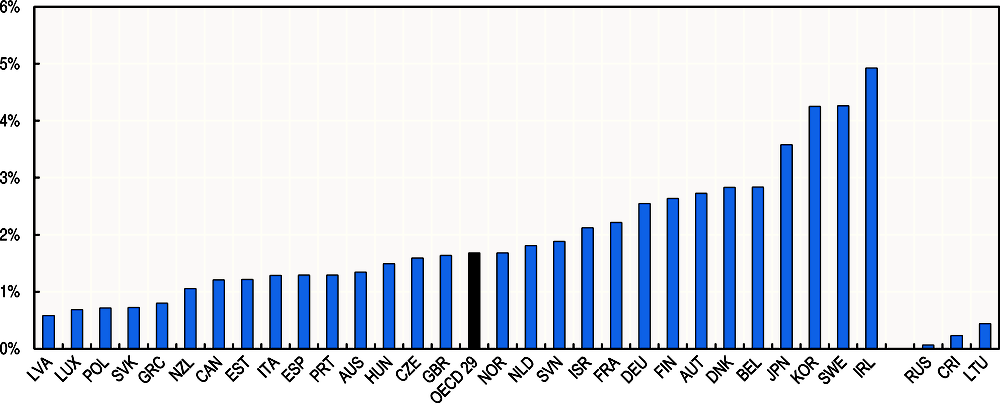
Note : The latest available year is 2016 for the Czech Republic, Finland and the Russian Federation; 2014 for Denmark, Estonia, Germany, Ireland, Latvia, Norway, Poland, Portugal, the Slovak Republic, Spain, Sweden; and 2013 for Costa Rica, Italy and Lithuania. The OECD average is weighted by the shares of GDP and excludes Chile, Iceland, Mexico, Switzerland, Turkey and the United States.
Source : OECD calculations based on “8A. Capital formation by activity ISIC rev4”, OECD National Accounts Statistics (database), http://stats.oecd.org/Index.aspx?DataSetCode=SNA_TABLE8A; Russian Federal State Statistics Service (Rosstat).
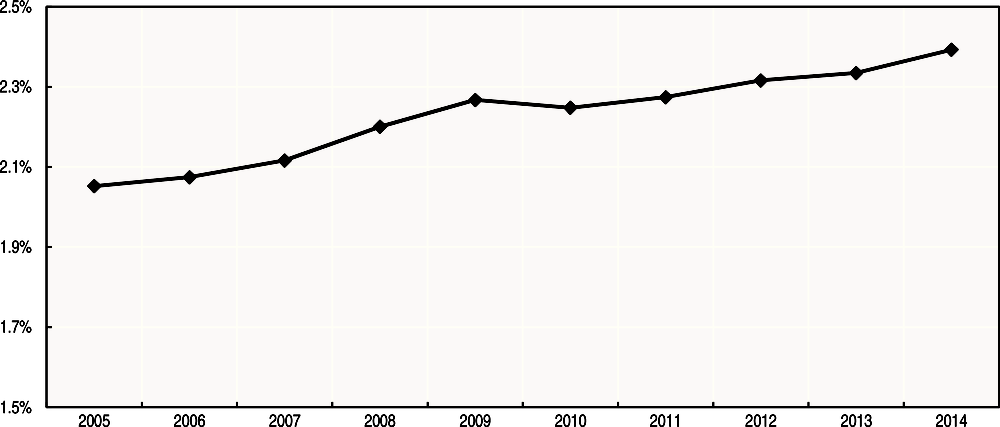
Note : The OECD average is weighted by the shares of GDP; its time series excludes Chile, Iceland, Italy, Mexico, Switzerland, Turkey and the United States.
Source : OECD calculations based “8A. Capital formation by activity ISIC rev4”, OECD National Accounts Statistics (database), http://stats.oecd.org/Index.aspx?DataSetCode=SNA_TABLE8A; Russian Federal State Statistics Service (Rosstat).
Further reading:
Lequiller, F. and D. Blades (2014), Understanding National Accounts: Second Edition, OECD Publishing, Paris, https://doi.org/10.1787/9789264214637-en.
ECONOMIC RESOURCES: Household debt
Definition
This indicator refers to the total outstanding debt of households as a percentage of their disposable income. Debt is calculated by summing liability categories such as loans, debt securities except financial derivatives, and other accounts payable. For most households, debt mainly consists of home mortgage loans and other liabilities such as credit lines, credit cards and other consumer credit (including automobile loans or student loans). Household debt, when it reaches unsustainable levels, represents a risk for the economic system.
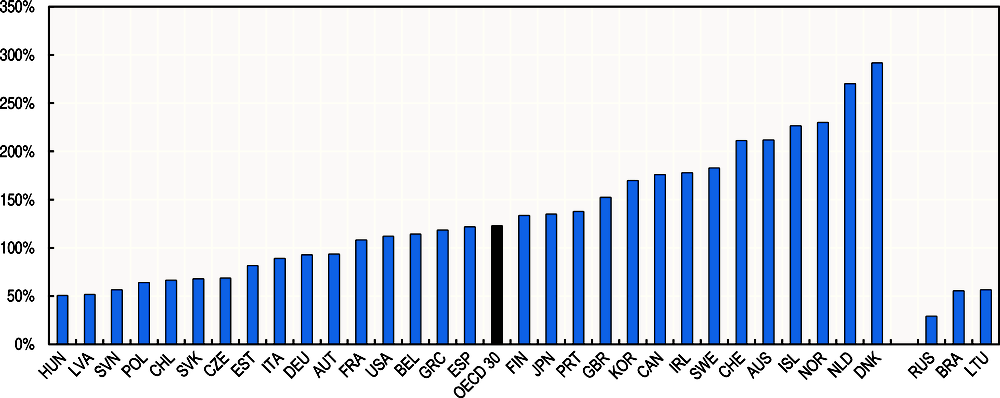
Note : The latest available year is 2016 for Canada, Denmark, Finland, Iceland, the Netherlands, Norway, Portugal, Sweden and the United Kingdom; and 2014 for Brazil and Iceland. The OECD average is weighted by the household net disposable income and excludes Israel, Luxembourg, Mexico, New Zealand and Turkey.
Source : OECD Financial dashboard (database), http://dotstat.oecd.org/Index.aspx?DataSetCode=FIN_IND_FBS.
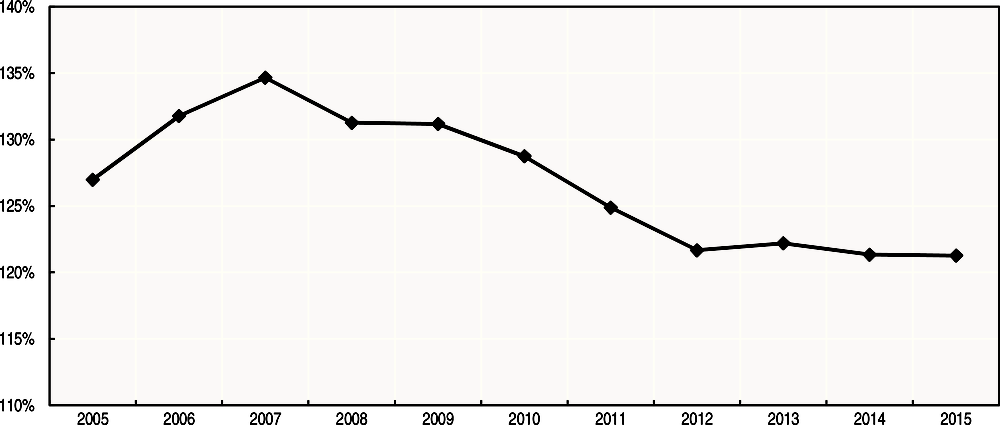
Note : The OECD average is weighted by the household net disposable income; it excludes Iceland, Israel, Korea, Luxembourg, Mexico, New Zealand and Turkey due to incomplete time series for these countries.
Source : OECD Financial dashboard (database), http://dotstat.oecd.org/Index.aspx?DataSetCode=FIN_IND_FBS.
Further reading:
Lequiller, F. and D. Blades (2014), Understanding National Accounts: Second Edition, OECD Publishing, Paris, https://doi.org/10.1787/9789264214637-en.
ECONOMIC RESOURCES: Financial net worth of the general government
Definition
This indicator refers to the total value of financial assets minus the total value of outstanding liabilities, excluding pension liabilities, held by the general government sector (which consists of central, state and local governments, as well as social security funds). Consistent with standard practice, it is expressed here as a percentage of GDP. The SNA 2008 defines financial assets of the government sector as: currency and deposits; debt securities, loans; equity and investment fund shares; insurance, pensions and standardised guarantee schemes; financial derivatives and employee stock options, and other accounts receivable. Monetary gold and special drawing rights (SDRs) are part of government financial assets in a very few countries such as Japan, the United Kingdom and the United States. Outstanding liabilities refer to the total liabilities as recorded in the financial balance sheet of the general government. To improve comparability across OECD countries, this indicator excludes pension liabilities (thus, it represents the “adjusted” financial net worth of the general government) because recording practices of pension liabilities for the general government sector differ across countries. As a result, financial net worth and adjusted financial net worth of general government (i.e. “adjusted” to exclude pension liabilities) are different for Australia, Canada, Sweden, Switzerland, the United Kingdom and the United States. A negative financial net worth of the government, when it reaches excessive negative levels, may represent a risk for the economic sustainability of a country.
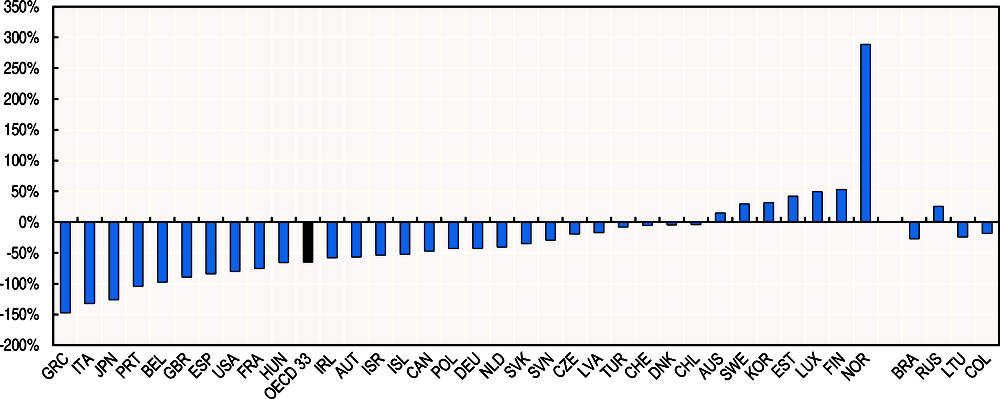
Note : The latest available year is 2015 for Austria, the Czech Republic, Estonia, France, Germany, Iceland, Ireland, Israel, Italy, Japan, Latvia, Lithuania, Luxembourg, the Russian Federation, the Slovak Republic, Switzerland, Turkey. The OECD average is population-weighted and excludes Mexico and New Zealand.
Source : OECD Financial dashboard (database), http://dotstat.oecd.org/Index.aspx?DataSetCode=FIN_IND_FBS.
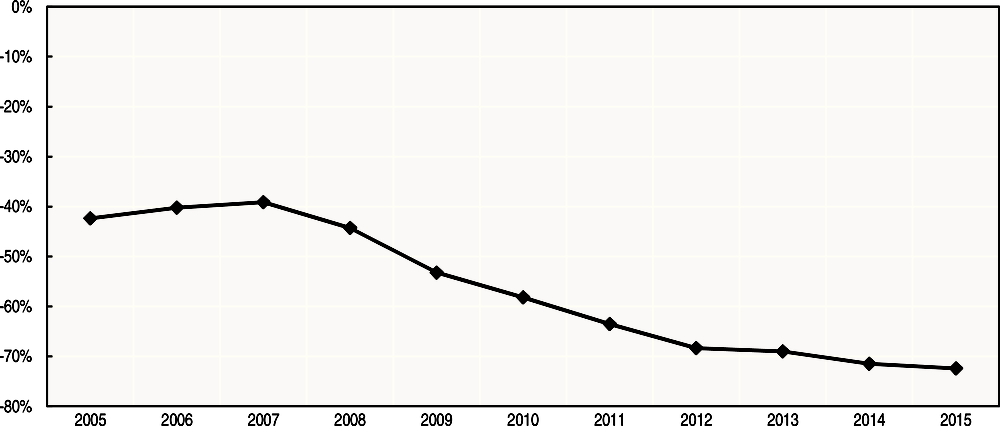
Note : The OECD average is population-weighted and excludes Korea, Mexico, New Zealand and Turkey due to incomplete time series for these countries.
Source : OECD Financial dashboard (database), http://dotstat.oecd.org/Index.aspx?DataSetCode=FIN_IND_FBS.
Further reading:
Lequiller, F. and D. Blades (2014), Understanding National Accounts: Second Edition, OECD Publishing, Paris, https://doi.org/10.1787/9789264214637-en.
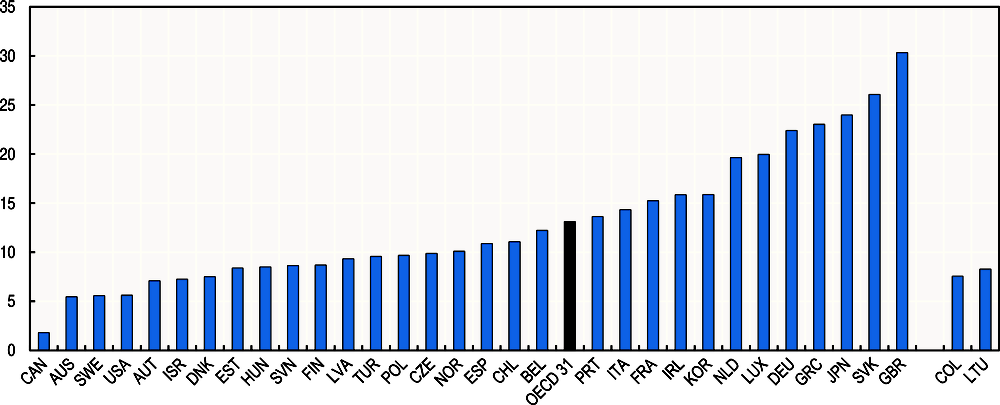
ECONOMIC RESOURCES: Banking sector leverage
Definition
This indicator refers to the ratio between selected financial assets of the banking sector (i.e. loans, currency and deposits, securities other than shares except financial derivatives, as recorded on the asset side of the financial balance sheet) and their own equity (i.e. shares and other equity, except mutual fund shares, as reported on the liability side of the financial balance sheet). The banking sector is defined as the Central Bank (S121) and other depository corporations (S122), as well as other financial intermediaries, with the exception of insurance corporations and pension funds (S123). However, there can be some country variations in this definition: in particular, “other financial intermediaries” can include financial auxiliaries (S124) in Australia, Canada, Iceland, Switzerland, the Slovak Republic and the United Kingdom. The data are non-consolidated for all OECD countries, except Australia and Israel. A high leverage of the banking sector is considered a risk factor, since it can increase exposure to risks and cyclical downturns.
Note : The latest available year is 2015 for Austria, Colombia, Estonia, France, Germany, Ireland, Israel, Italy, Japan, Latvia, Lithuania, Luxembourg, the Slovak Republic, Turkey and the United Kingdom; and 2014 for the Czech Republic. The OECD average is population- weighted and excludes Iceland, Mexico, New Zealand and Switzerland.
Source : OECD Financial dashboard (database), http://dotstat.oecd.org/Index.aspx?DataSetCode=FIN_IND_FBS.
Note : The OECD average is population-weighted; it excludes the Czech Republic, Iceland, Korea, Mexico, New Zealand, Switzerland and Turkey, due to incomplete time-series for these countries.
Source : OECD Financial dashboard (database), http://dotstat.oecd.org/Index.aspx?DataSetCode=FIN_IND_FBS.
Further reading:
Lequiller, F. and D. Blades (2014), Understanding National Accounts: Second Edition, OECD Publishing, Paris, https://doi.org/10.1787/9789264214637-en.
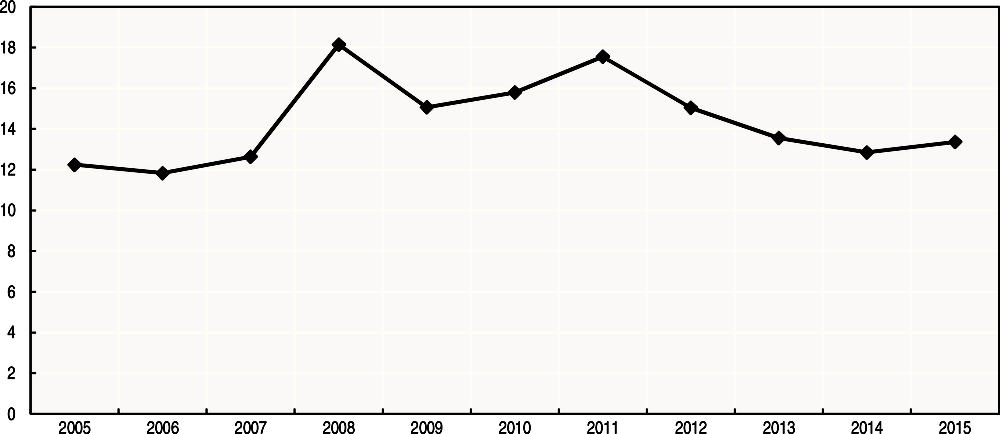
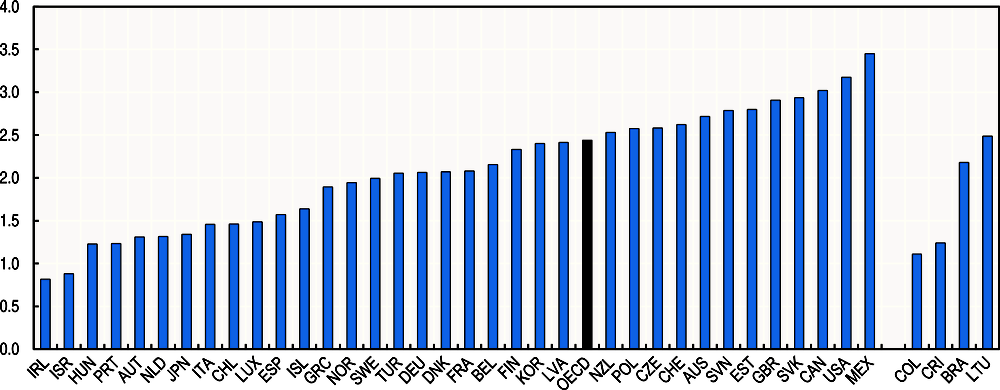
SOCIAL CAPITAL: Trust in others
Definition
Trust in others (also referred to as “interpersonal” or “generalised” trust) captures one of the key aspects of a country’s stock of social capital. This indicator is based on the survey question: “Would you say that most people can be trusted?” Respondents answer using an 11-point scale, ranging from 0 (“You do not trust any other person”) to 10 (“Most people can be trusted”). Data for European countries were collected as part of the EU SILC 2013 ad hoc module on well-being (Eurostat, 2015), and are nationally representative of the population aged 16 years and above. Data for New Zealand have been provided by Statistics New Zealand.
Note : The OECD average is population-weighted; it excludes Australia, Canada, Chile, Israel, Japan, Korea, Mexico and the United States.
Source : European Union Statistics on Income and Living Conditions (EU-SILC), http://appsso.eurostat.ec.europa.eu/nui/show.do?dataset=ilc_pw03&lang=en and Statistics New Zealand, customised report and licensed by Statistics New Zealand for re-use under the Creative Commons Attribution 3.0 New Zealand licence (received on 20 April 2017).
Further reading:
OECD (2017), Guidelines on Measuring Trust, OECD Publishing, Paris, https://doi.org/10.1787/9789264278219-en.
Scrivens, K. and C. Smith (2013), ’’Four Interpretations of Social Capital: An Agenda for Measurement’’, OECD Statistics Working Papers, No. 2013/06, OECD Publishing, Paris, https://doi.org/10.1787/5jzbcx010wmt-en.
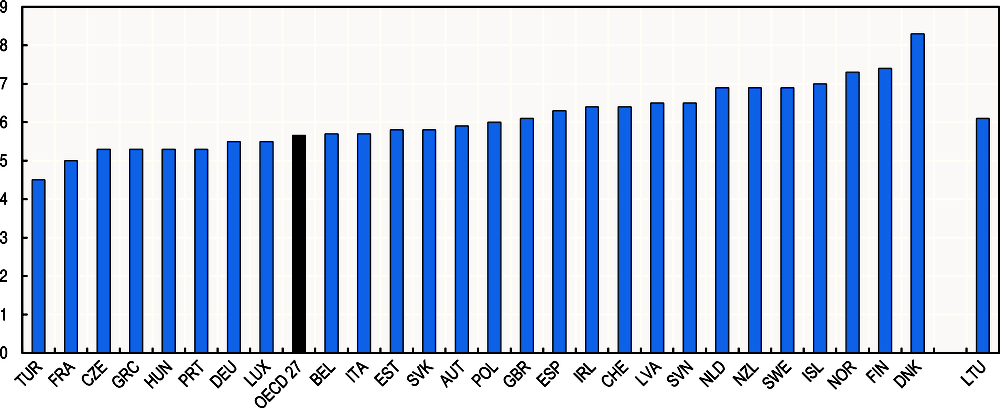
SOCIAL CAPITAL: Trust in the police
Definition
People’s trust in public institutions is also important for people’s willingness to cooperate with each other in the pursuit of collective goals. This indicator is based on the survey question: “How much do you personally trust each of the following national institutions…the police”, which respondents answer using an 11-point scale, ranging from 0 (“No trust at all”) to 10 (“Complete trust”). This indicator is consistent with the recommendations of the OECD Guidelines on Measuring Trust and it refers to one of the three institutions (i.e. the parliament, the police and the civil service) that the OECD Guidelines recommend to be considered when measuring institutional trust. According to the OECD Guidelines on Measuring Trust, measures of trust in public institutions should consider trust in the political system (which includes the government, political parties and the parliament), trust in the judicial system (which includes the police, military, and courts) and trust in non-political public institutions (which includes the civil service). Data for European countries were collected as part of the EU SILC 2013 ad hoc module on well-being (Eurostat, 2015), and are nationally representative of the population aged 16 years and above. Data for New Zealand have been provided by Statistics New Zealand.
Note : The OECD average is population-weighted and excludes Australia, Canada, Chile, Israel, Japan, Korea, Mexico and the United States.
Source : European Union Statistics on Income and Living Conditions (EU-SILC), http://appsso.eurostat.ec.europa.eu/nui/show.do?dataset=ilc_pw03&lang=en and Statistics New Zealand, customised report and licensed by Statistics New Zealand for re-use under the Creative Commons Attribution 3.0 New Zealand licence (received on 20 April 2017).
Further reading:
OECD (2017), Guidelines on Measuring Trust, OECD Publishing, Paris, https://doi.org/10.1787/9789264278219-en.
Scrivens, K. and C. Smith (2013), ’’Four Interpretations of Social Capital: An Agenda for Measurement’’, OECD Statistics Working Papers, No. 2013/06, OECD Publishing, Paris, https://doi.org/10.1787/5jzbcx010wmt-en.
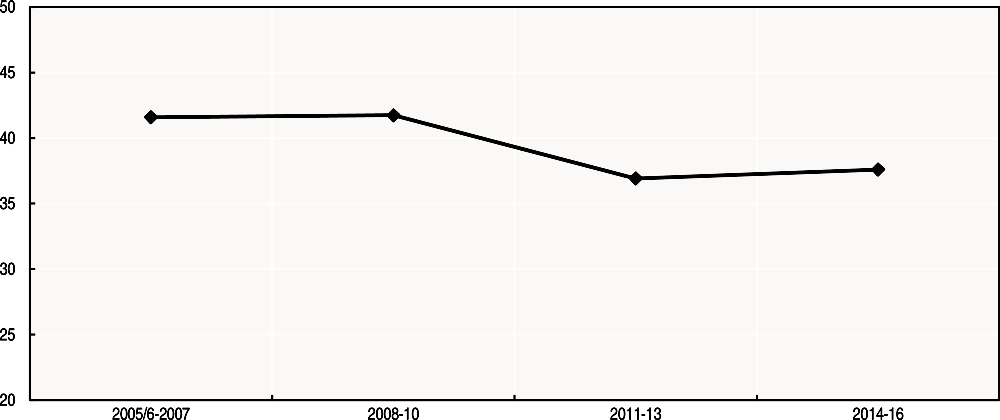
SOCIAL CAPITAL: Trust in the national government
Definition
This indicator is based on the survey question: “In this country, do you have confidence in each of the following, or not? … How about national government?”. The data shown here reflect the percentage of the sample responding “yes” (the other response categories being “no”, and “don’t know”), and are averaged over a three-year period. According to the OECD Guidelines on Measuring Trust, measures of trust in public institutions should consider trust in the political system (which includes the government, political parties and the parliament), trust in the judicial system (which includes the police, military, and courts) and trust in non-political institutions (which includes the civil service). The ideal data set would cover each of these different institutional elements. However, from the data that exist currently, trust in the national government has been selected, as time series are available for all OECD countries. The source for these data is the Gallup World Poll, which samples around 1 000 people per country each year. The sample is ex ante designed to be nationally representative of the population aged 15 and over (including rural areas); sample data are weighted to the population using weights supplied by Gallup.
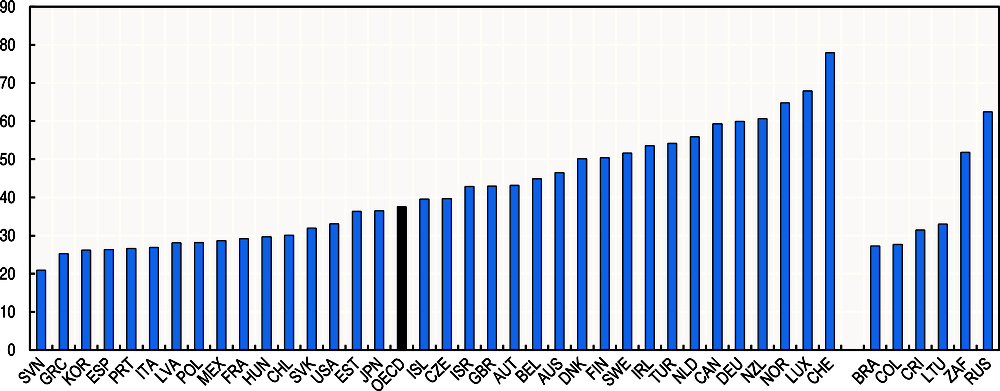
Note : The OECD average is population-weighted.
Source : OECD calculations based on Gallup World Poll, www.gallup.com/services/170945/world-poll.aspx.
Note : The OECD average is population-weighted and excludes Iceland and Luxembourg, due to an incomplete time series for these countries.
Source : OECD calculations based on Gallup World Poll, www.gallup.com/services/170945/world-poll.aspx.
Further reading:
OECD (2017), Guidelines on Measuring Trust, OECD Publishing, Paris, https://doi.org/10.1787/9789264278219-en.
González, S., L. Fleischer and M. Mira d’Ercole (2017), “Governance statistics in OECD countries and beyond: What exists, and what would be required to assess their quality?”, OECD Statistics Working Papers, 2017/03, OECD Publishing, Paris, https://doi.org/10.1787/c0d45b5e-en.
SOCIAL CAPITAL: Government stakeholder engagement
Definition
This indicator describes the extent to which formal stakeholder engagement is built in the development of primary laws and subordinate regulations; it is included as the existence of mechanisms for formal engagement and consultations with stakeholders represents a key lever through which governments can strengthen the legitimacy of public institutions. The indicator is calculated as the simple average of two composite indicators (covering respectively primary laws and subordinate regulations) that measure four aspects of stakeholder engagement , namely: i) systematic adoption of requirements to engage stakeholders; ii) methodology used for consultation; iii) transparency (which relates to principles of open government, such as whether government decisions are made publicly available); and iv) oversight and quality control, which refers to existence of oversight bodies and publicly available information on the results of stakeholder engagement. The maximum score for each of the four dimensions/categories is one and the maximum aggregate score for the composite indicator is four. The stakeholder engagement indicator is computed based on responses to the 2014 OECD’s regulatory indicators survey, where respondents are government officials in OECD countries. The scores for primary laws refer exclusively to processes for developing primary laws initiated by the executive. There is no score for primary laws for the United States, where all primary laws are initiated by Congress, or for Brazil, Costa Rica and Colombia. In the majority of countries, most primary laws are initiated by the Executive, except for Mexico and Korea, where a higher share of primary laws are initiated by Parliament/Congress (respectively 90.6% and 84%).
Note : Data refer to 2016 for Latvia and Lithuania; and to 2015 for Brazil, Colombia and Costa Rica. The OECD average is population-weighted.
Source : OECD Indicators of Regulatory Policy and Governance (iREG), www.oecd.org/gov/regulatory-policy/indicators-regulatory-policy-and-governance.htm.
Further reading:
OECD Indicators of Regulatory Policy and Governance (iREG), www.oecd.org/gov/regulatory-policy/indicators-regulatory-policy-and-governance.htm.
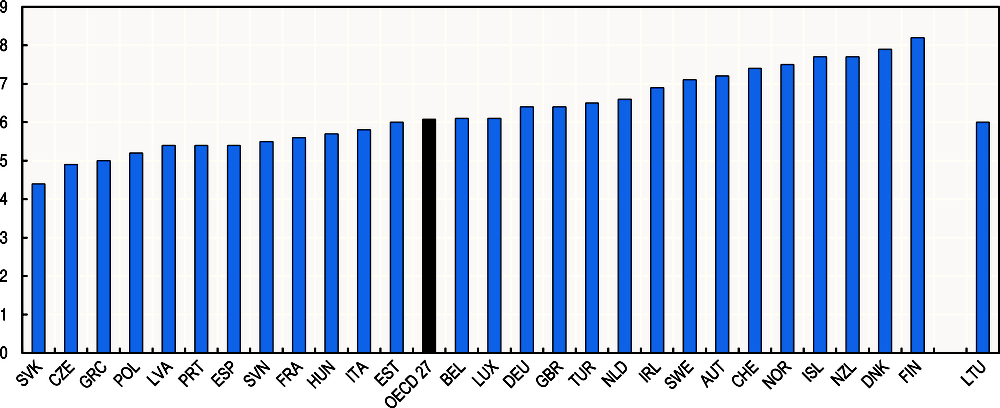
SOCIAL CAPITAL: Volunteering through organisations
Definition
Volunteering represents an investment in social capital. This indicator is based on the question: “In the last 12 months, how often, if at all, did you do voluntary work, including unpaid work for a charity, political party, trade union or other non-profit organisation?” with response categories “never”, “less than once a month”, “less than once a week but at least once a month”, “at least once a week but not every day” and “every day”. The data shown here reflect the percentage of adults aged 16-65 who declared having volunteered through an organisation at least once a month. Data are collected through the OECD Survey of Adult Skills, which is part of the Programme for the International Assessment of Adult Competencies (PIAAC) coordinated by the OECD.
Note : Data refer to 2011-12 for Australia, Austria, Belgium, Canada, the Czech Republic, Denmark, Estonia, Finland, Germany, Ireland, Italy, Japan, Korea, the Netherlands, Poland, the Russian Federation, the Slovak Republic, Spain, Sweden, the United Kingdom and the United States; to 2012 for France; and to 2014-15 for Chile, Greece, Israel, Lithuania, New Zealand, Slovenia and Turkey. Data for Belgium refer to Flanders; those for the United Kingdom refer to England and Northern Ireland; and those for the Russian Federation exclude Moscow municipal area. The OECD average is population-weighted and excludes Hungary, Iceland, Latvia, Luxembourg, Mexico, Portugal and Switzerland.
Source : OECD calculations based on data from OECD Survey of Adult Skills (PIAAC database), www.oecd.org/site/piaac/.
Further reading:
OECD (2016), Skills Matter: Further Results from the Survey of Adult Skills, OECD Skills Studies, OECD Publishing, Paris, https://doi.org/10.1787/9789264258051-en.