Online Data Annex: Current Well-Being
This online-only annex provides detailed information about definitions, levels and (where available) the time series since 2005 for each of the headline indicators of current well-being featured in How’s Life? 2017. Together with the information shown in the Online Data Annex: Resources for Future Well-Being, these measures provide the foundation for the analysis in Chapter 1, and the country profiles presented in Chapter 5.
Throughout this annex, where prior data are not comparable due to a break in the series, non-comparable data are highlighted in grey. Missing data are denoted by “..”. ISO3 codes are used in charts and tables, and when the OECD average cannot be calculated over all OECD countries, the number of countries included is specified next to the OECD labels. All indicators are based on data that were last updated in the week of 24-31 July 2017.
This annex is available at www.oecd-ilibrary.org/economics/how-s-life-2017_how_life-2017-en.
INCOME AND WEALTH: Household income
Definition
This indicator is obtained by summing people’s gross income (earnings, self-employment and capital income, as well as cash transfers received from other sectors) and the social transfers in-kind that households receive from government (such as education and health care services), and then subtracting taxes on income and wealth, as well as the social security contributions paid by households. The measure used here, which is drawn from the OECD National Accounts, also takes into account the depreciation of capital goods consumed by households. Household net adjusted disposable income is shown in per capita terms, and expressed in United States dollars (USD), adjusted using purchasing power parities (PPPs) for actual individual consumption. Time series are expressed in USD at 2010 PPPs, whilst data for the latest available year are in USD at current PPPs.
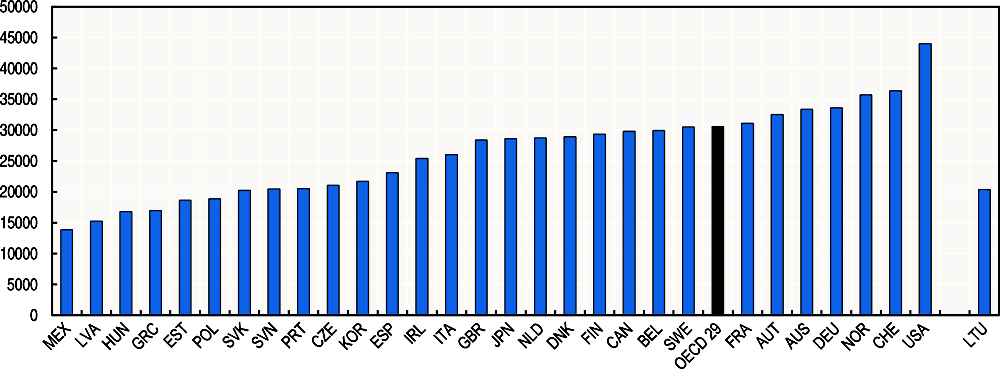
Note : The OECD average is population-weighted and excludes Chile, Iceland, Israel, Luxembourg, New Zealand and Turkey.
Source : OECD calculations based on OECD National Accounts Statistics (database), https://doi.org/10.1787/na-data-en.
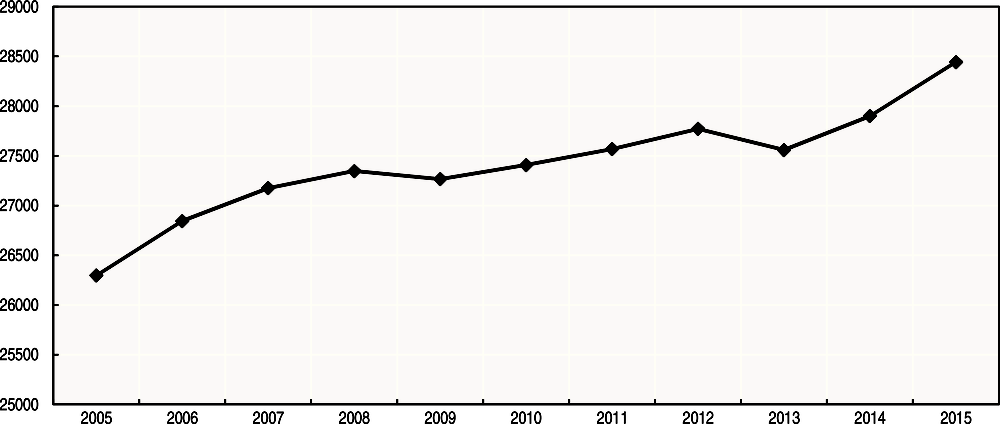
Note : The OECD average is population-weighted and excludes Chile, Iceland, Israel, Korea, Luxembourg, New Zealand and Turkey, due to incomplete time series.
Source : OECD calculations based on OECD National Accounts Statistics (database), https://doi.org/10.1787/na-data-en.
Further reading:
Lequiller, F. and D. Blades (2014), Understanding National Accounts: Second Edition, OECD Publishing, Paris, https://doi.org/10.1787/9789264214637-en.
INCOME AND WEALTH: Household net wealth
Definition
This indicator refers to both the real and financial assets and liabilities held by private households resident in the country, as measured in microdata. Values are expressed in USD at current prices, adjusted using purchasing power parities (PPPs) for household private consumption. The concept of wealth corresponds to the one presented in the OECD Guidelines for Micro Statistics on Household Wealth (OECD, 2013). Data are shown per household (rather than per person or per adult), with no adjustment made to reflect differences in household size. Data are drawn from the OECD Wealth Distribution Database, which includes data supplied by National Statistical Offices and other producers of official statistics (based on household surveys or tax and administrative records), and public use data from the European Central Bank (for 11 countries participating in the Euro-System Household Finance and Consumption Survey). These data exclude pension wealth, the size and distribution of which differs markedly across OECD countries, depending on the characteristics of their retirement systems. There are country differences in the degree to which rich households are oversampled (ranging from no oversampling in Australia, to large oversampling for the United States).
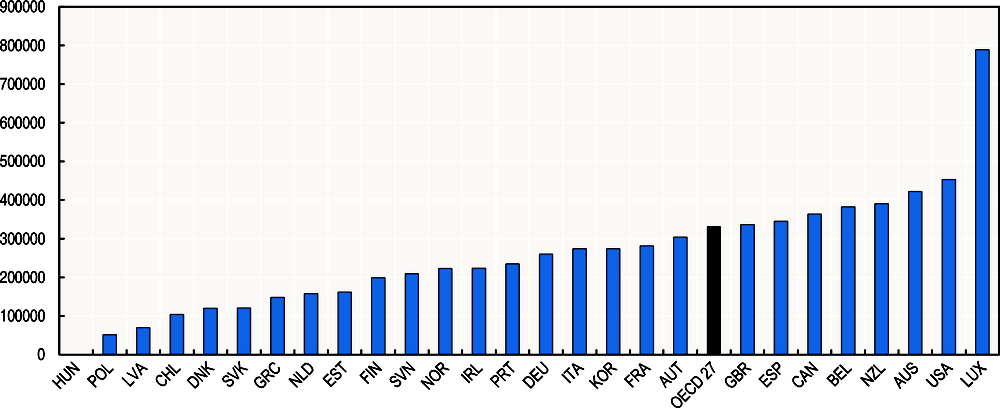
Note : The latest available year is 2015 for Denmark, the Netherlands, New Zealand and Norway; 2013 for Estonia, Finland, Ireland, Korea, Poland, Portugal and the United Kingdom; 2012 for Australia and Canada; 2011 for Spain; 2010 for the United States; and 2014 for the other countries. Purchasing Power Parities (PPPs) are those for private consumption of households. Data for the United Kingdom are limited to Great Britain only. The OECD average is population-weighted and excludes the Czech Republic, Iceland, Israel, Japan, Mexico, Sweden, Switzerland and Turkey.
Source : OECD Wealth Distribution (database), http://stats.oecd.org/Index.aspx?DataSetCode=WEALTH.
Further reading:
OECD (2013), OECD Guidelines for Micro Statistics on Household Wealth, OECD Publishing, Paris, https://doi.org/10.1787/9789264194878-en.
OECD (2015), “How does the concentration of household wealth compare across countries?”, in In It Together: Why Less Inequality Benefits All, OECD Publishing, Paris, https://doi.org/10.1787/9789264235120-en.
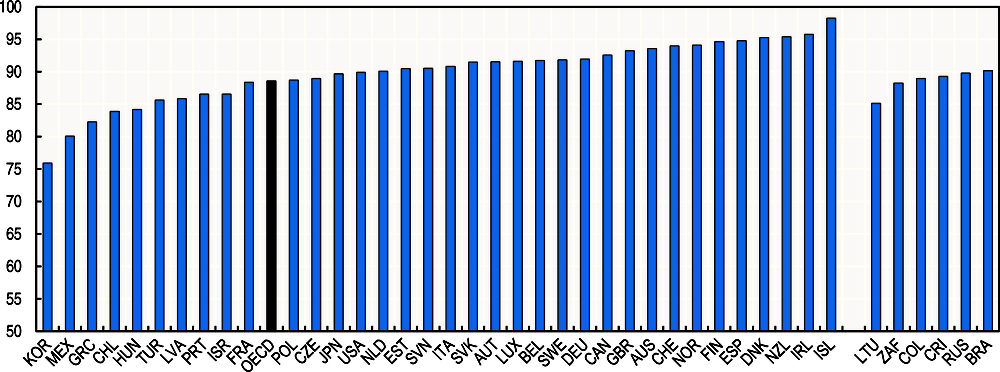
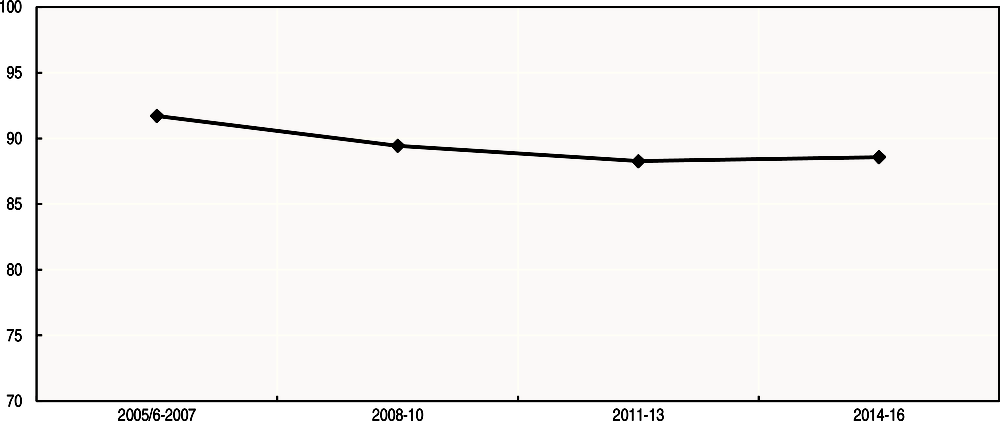
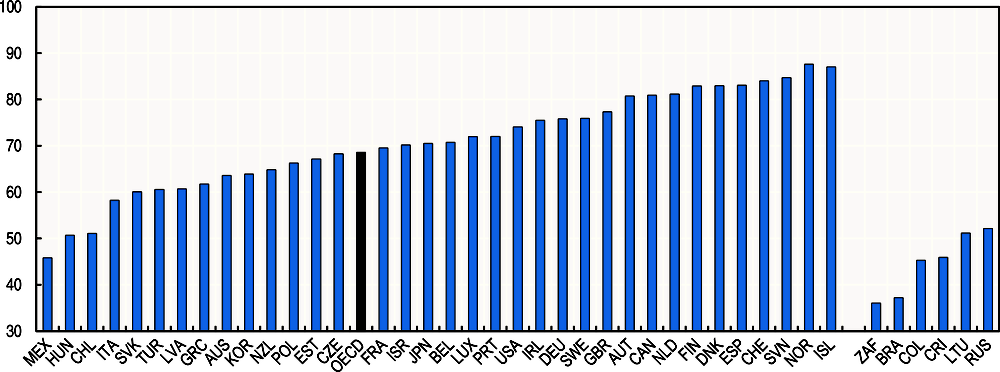
JOB AND EARNINGS: Employment
Definition
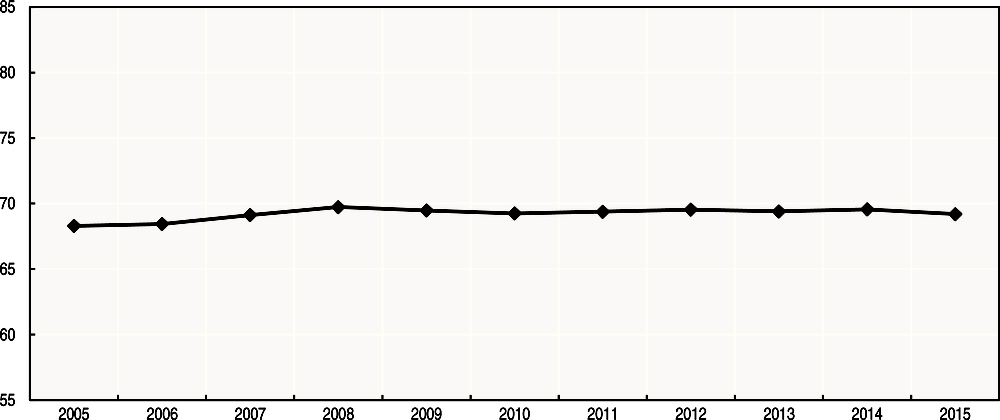
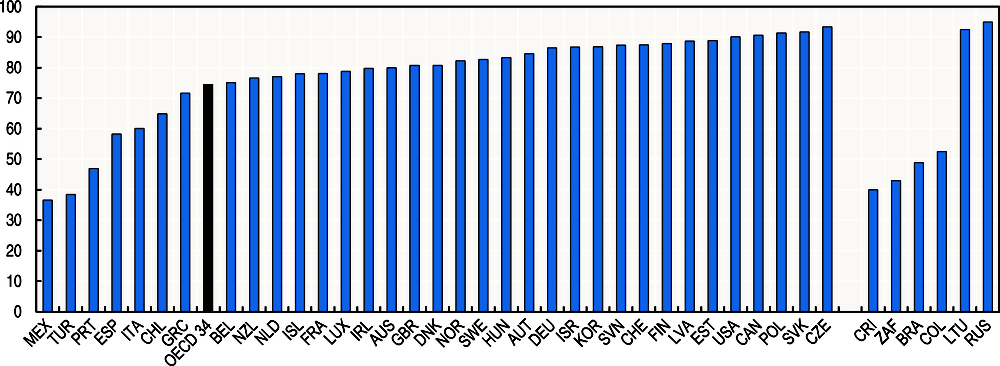
This indicator refers to the share of the working-age population (people aged 15 to 64 in most OECD countries) who declare having worked in gainful employment for at least one hour in the previous week; it also includes persons who, having already worked in their present job, were temporarily absent from work during the reference period while having retained a formal attachment to their job (e.g. due to parental leave, sickness, annual leave). The data come from national Labour Force Surveys (LFSs) as compiled in the OECD Annual Labour Force Statistics (ALFS) Database, and are consistent with the standards set by the International Conference of Labour Statisticians.
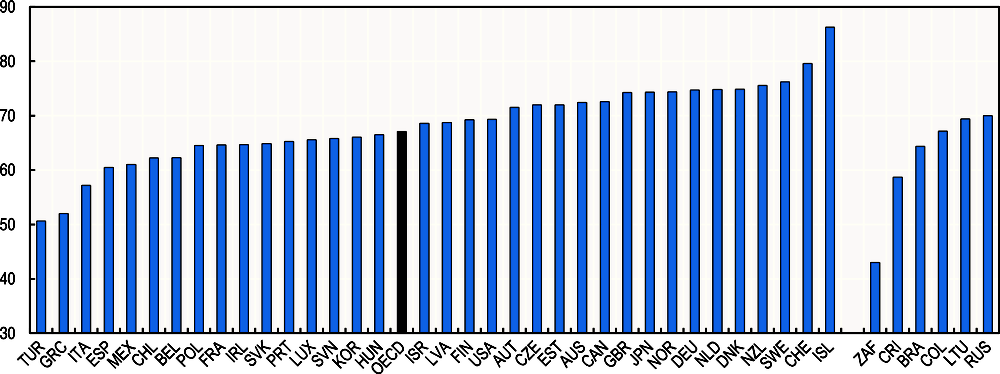
Note : The latest available year is 2015 for Brazil. The OECD average is population-weighted.
Source : “Labour Force Statistics”, OECD Employment and Labour Market Statistics (database), https://doi.org/10.1787/lfs-lfs-data-en.
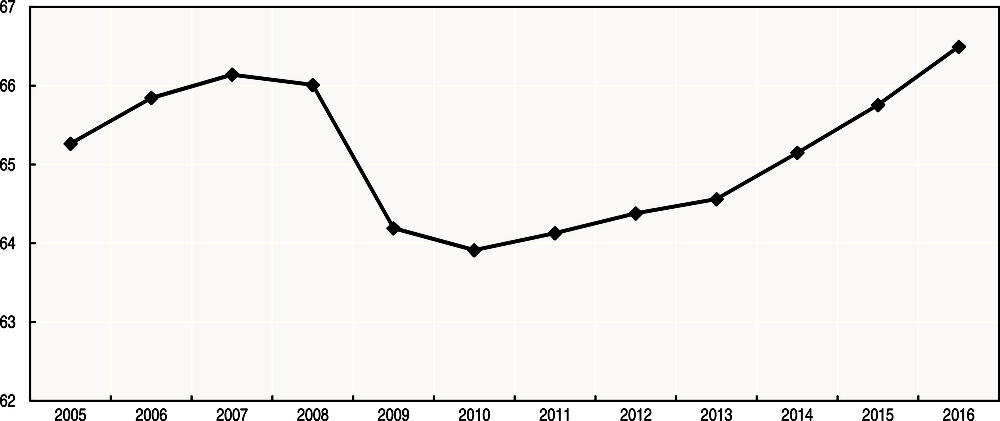
Note : The OECD average is population-weighted and excludes Chile, Germany, New Zealand, Norway, Portugal and Switzerland, due to breaks in the time series.
Source : “Labour Force Statistics”, OECD Employment and Labour Market Statistics (database), https://doi.org/10.1787/lfs-lfs-data-en.
Further reading:
OECD (2017), OECD Employment Outlook 2017, OECD Publishing, Paris, https://doi.org/10.1787/empl_outlook-2017-en.
JOB AND EARNINGS: Earnings
Definition
This indicator refers to the average annual earnings of employees working in all sectors of the economy and in all types of dependent employment; it is expressed in full-time and full-year equivalent terms. The OECD average is weighted by the total number of employees in each country. Earnings include employees’ gross remuneration, i.e. including employers’ social security contributions before any deductions are made by the employer in respect of taxes, workers’ contributions to social security and pension schemes, life insurance premiums, union dues and other employee obligations. The indicator is computed as the total wage bill from National Accounts, divided by the number of full-time equivalent employees in the economy. The number of full-time equivalent employees is obtained by multiplying data on the number of employees by the ratio of hours worked by all employees and by those working full-time, in order to correct for the prevalence of part-time work, which varies considerably across countries. The indicator combines data from the OECD National Accounts Database, the OECD Earnings Distribution Database and the OECD Average Annual Earnings per Full-time and Full-year Equivalent Dependent Employee Database.
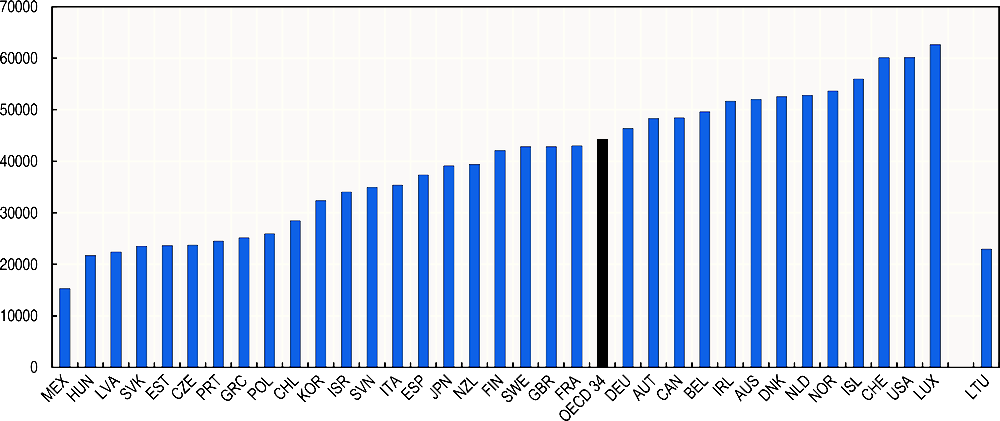
Note : Real compensation per employee (which includes employer’s social contributions in addition to wages and salaries) is considered for Chile, Iceland, Mexico and New Zealand. The OECD average is weighted by the number of employees in each country, and excludes Turkey.
Source : OECD Average annual wages (database), http://stats.oecd.org/Index.aspx?DataSetCode=AV_AN_WAGE.
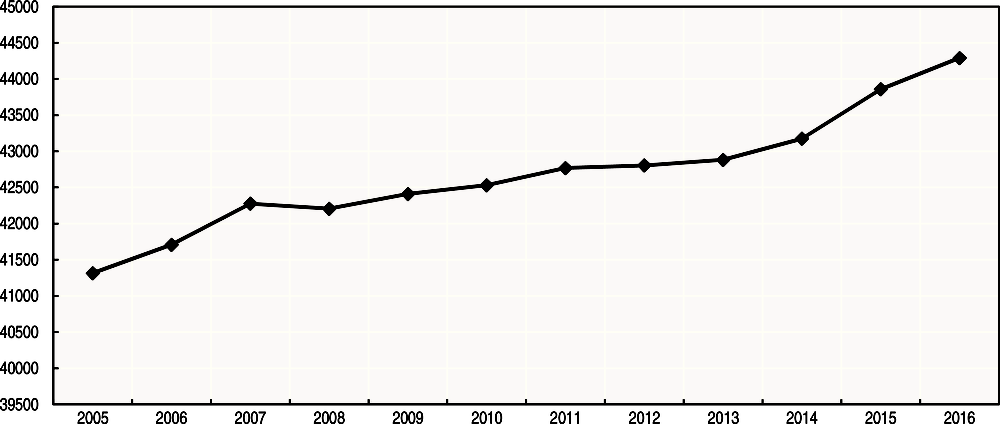
Note : Real compensation per employee (which includes employer’s social contributions in addition to wages and salaries) is considered for Chile, Iceland, Mexico and New Zealand. The OECD average is weighted by the number of employees in each country, and excludes Turkey, due to incomplete time series.
Source : OECD Average annual wages (database), http://stats.oecd.org/Index.aspx?DataSetCode=AV_AN_WAGE.
Further reading:
OECD (2017), OECD Employment Outlook 2017, OECD Publishing, Paris, https://doi.org/10.1787/empl_outlook-2017-en.
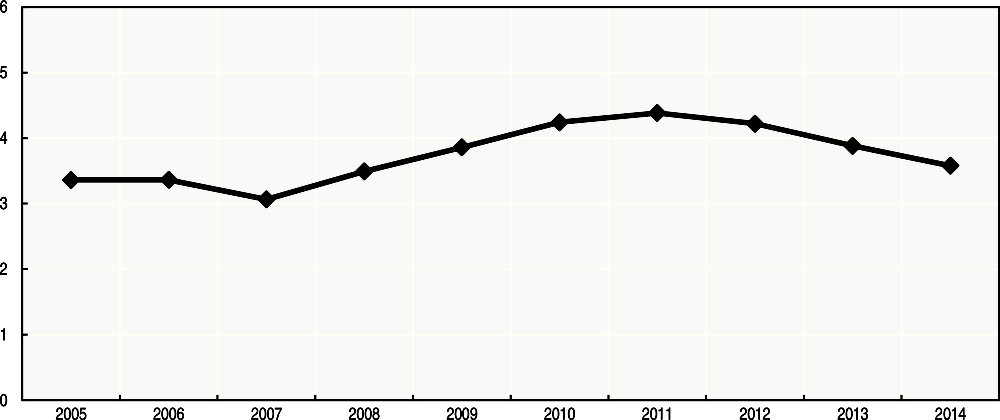
JOB AND EARNINGS: Labour market insecurity
Definition
This indicator is defined as the expected monetary loss that an employed person would incur upon becoming and staying unemployed, and is expressed as a share of previous earnings. This loss depends on the risk of becoming unemployed, the expected duration of unemployment and the degree of mitigation against these losses provided by unemployment benefits (effective insurance). Data on unemployment duration are used to measure the monthly probability for an employed person of becoming unemployed (people who report having been unemployed for 1 month or less are assumed to have been employed in the previous month), as well as the average expected duration of completed unemployment spells in months. The unemployment insurance is calculated as the product of the coverage of the unemployment insurance/assistance and of the replacement rates of public transfers received by the recipients of unemployment insurance/assistance. The average replacement rates for recipients of unemployment insurance and unemployment assistance take into account social assistance benefits. The indicator combines data from the OECD Unemployment Duration Database, the OECD Benefit Recipients Database, the OECD Labour Market Programmes Database and the OECD Taxes and Benefits Database.
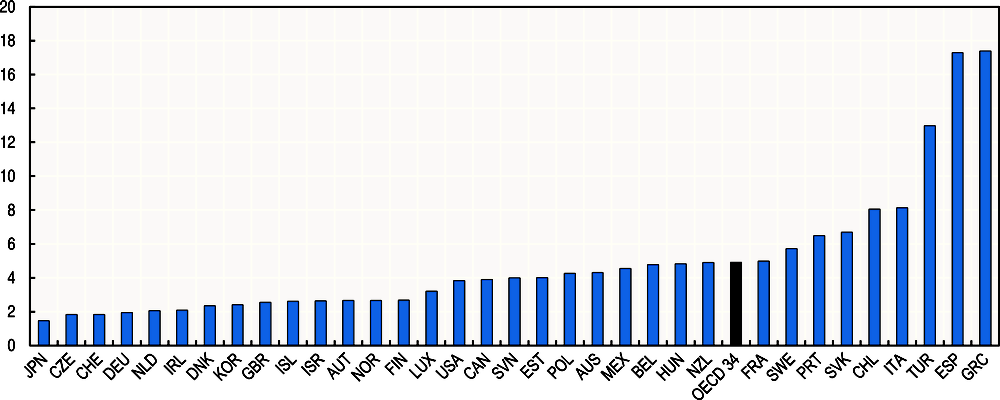
Note : The latest available year is 2011 for Chile. The OECD average is population-weighted and excludes Latvia.
Source : OECD Job quality (database), http://dotstat.oecd.org/Index.aspx?DataSetCode=JOBQ.
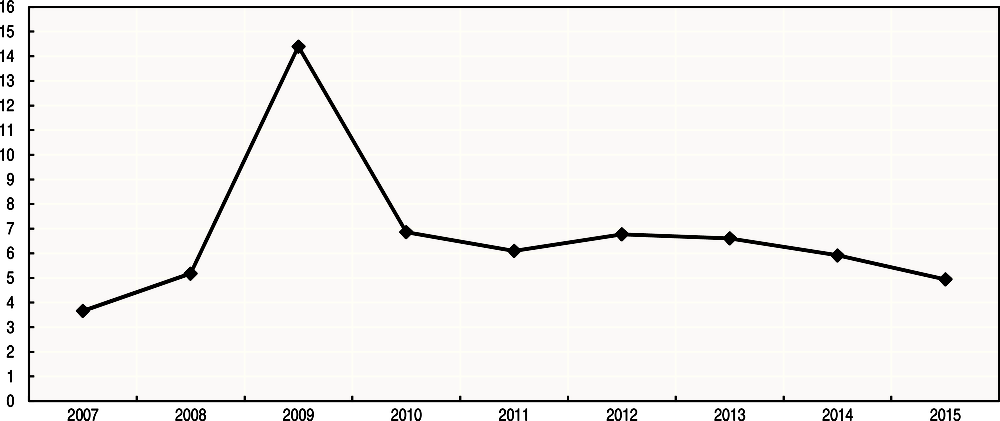
Note : The OECD average is population-weighted and excludes Chile, Korea, Latvia, Portugal, the Slovak Republic and Sweden, due to incomplete time series.
Source : OECD Job quality (database), http://dotstat.oecd.org/Index.aspx?DataSetCode=JOBQ.
Further reading:
Cazes, S., A. Hijzen and A. Saint-Martin (2015),“Measuring and Assessing Job Quality: The OECD Job Quality Framework”,OECD Social, Employment and Migration Working Papers, No. 174, OECD Publishing, Paris, https://doi.org/10.1787/5jrp02kjw1mr-en.
JOB AND EARNINGS: Job strain
Definition
This indicator considers the incidence of job strain among employees. Job strain is defined as a situation in which job demands reported by employees (e.g. time pressure, and exposure to physical health risks) exceed their job resources (e.g. work autonomy, opportunities for learning, and good workplace relationships). Following the Guidelines for Measuring the Quality of the Working Environment (OECD, 2017) four types of job demands are identified: i) physical demands related to hard physical work (e.g. carrying and moving heavy loads); ii) work intensity, which relates to longer-than-average working hours; iii) working time inflexibility; and iv) perceived job insecurity, which imposes a psychological burden upon workers. Similarly, four types of job resources are considered, namely: i) work autonomy, which include workers’ freedom to choose and change their work tasks and methods; ii)training and learning opportunities, which include formal (i.e. training) and informal learning opportunities at work; iii) perceived opportunity for career advancement, which is linked to workers’ motivation at work; and iv) intrinsic rewards of the job, which captures satisfaction with the purpose of the job (e.g. feeling of doing a useful job, helping other people in the job). Job strain refers to instances where people report more job demands than job resources. As no single data source covers all OECD countries, the job strain index is obtained by combining data from the European Working Conditions Survey (EWCS) and the Work Orientations modules of the International Social Survey Program (ISSP).The data included in this annex are provisional estimates prepared in September 2017 for the OECD Job quality database, http://dotstat.oecd.org/Index.aspx?DataSetCode=JOBQ.
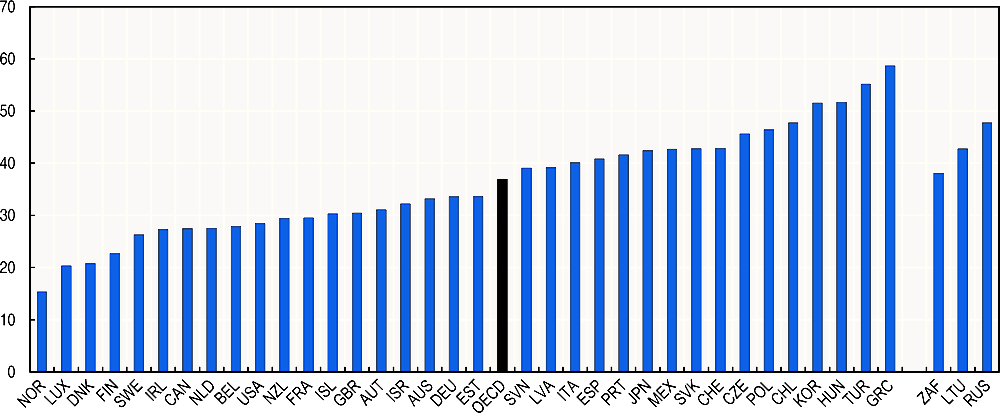
Note : The latest available year is 2005 for Canada and Korea. The OECD average is population-weighted.
Source : Provisional estimates prepared in September 2017 for inclusion in the OECD Job quality (database), http://dotstat.oecd.org/Index.aspx?DataSetCode=JOBQ.
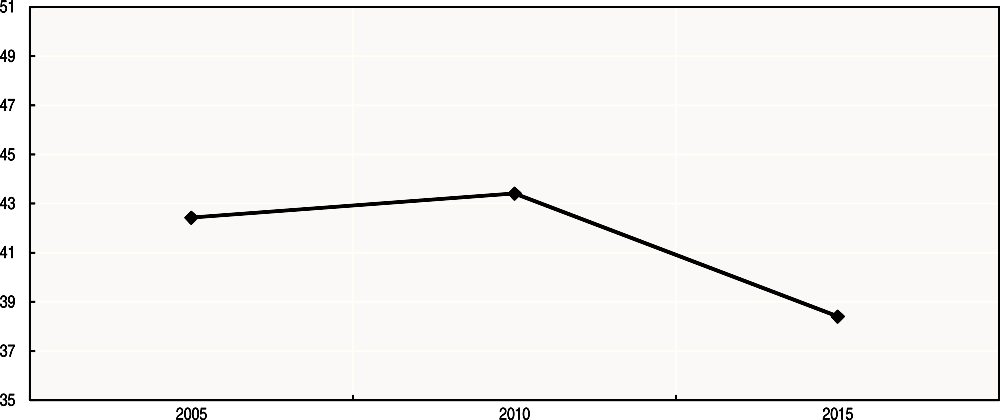
Note : The OECD average is population-weighted and excludes Australia, Canada, Chile, Iceland, Israel, Japan, Korea, Mexico, New Zealand, Switzerland and the United States, due to an incomplete time series.
Source : OECD calculations based in provisional estimates prepared in September 2017 for inclusion in the OECD Job quality (database), http://dotstat.oecd.org/Index.aspx?DataSetCode=JOBQ.
Further reading:
Murtin, F., M. Fadic and C. Le Thi (2017), “Measuring Job Strain Among OECD Countries: The 2017 Revision”, OECD Statistics Directorate Working Paper, forthcoming.
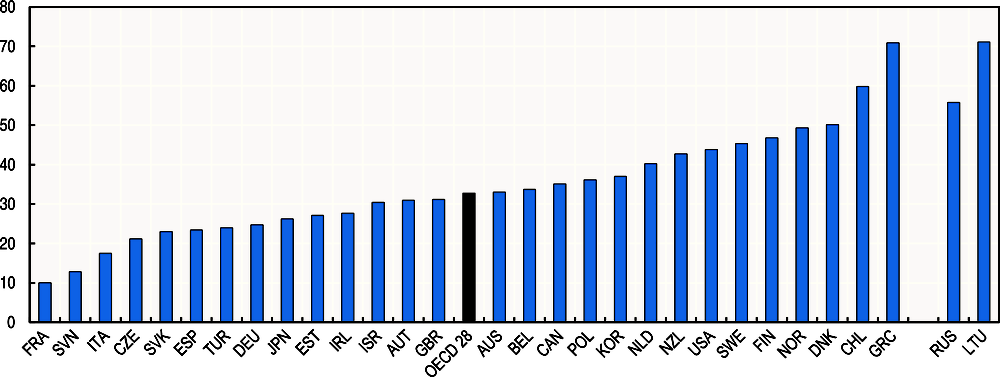
JOB AND EARNINGS: Long-term unemployment
Definition
This indicator refers to the number of people who have been unemployed for one year or more, as a percentage of the labour force (i.e. the sum of employed and unemployed persons). Unemployed persons are defined as those who did not perform any work in the survey reference week but are willing to do so and actively searching for work. The data are drawn from national Labour Force Surveys as available in the OECD Employment Outlook Database.
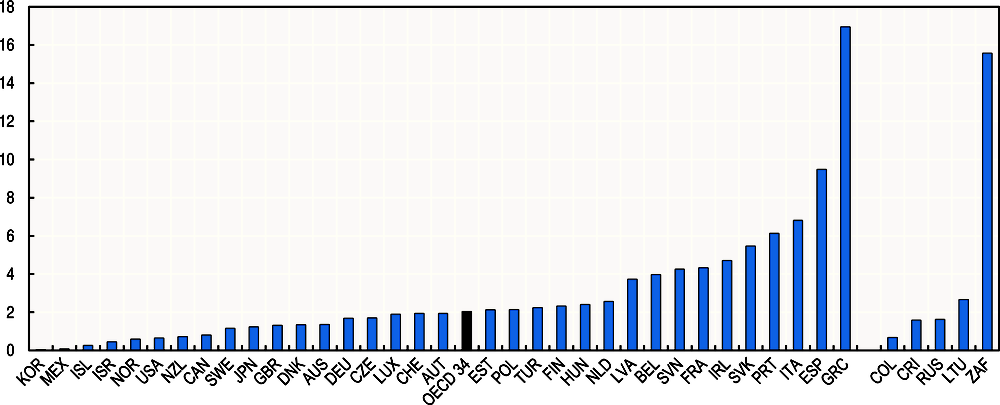
Note : The latest available year is 2015 for Luxembourg. The OECD average is population-weighted and excludes Chile.
Source : “Labour Force Statistics”, OECD Employment and Labour Market Statistics (database), https://doi.org/10.1787/lfs-lfs-data-en.
Note : The OECD average is population-weighted and excludes Chile, Germany, Israel, Luxembourg, New Zealand, Norway, Portugal, Sweden and Switzerland, due to breaks and/or incomplete data for these countries.
Source : “Labour Force Statistics”, OECD Employment and Labour Market Statistics (database), https://doi.org/10.1787/lfs-lfs-data-en.
Further reading:
OECD (2017), OECD Employment Outlook 2017, OECD Publishing, Paris, https://doi.org/10.1787/empl_outlook-2017-en.
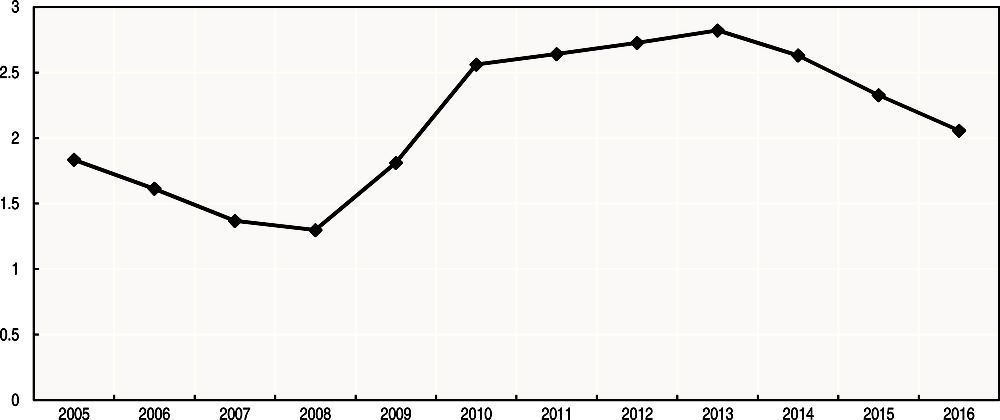
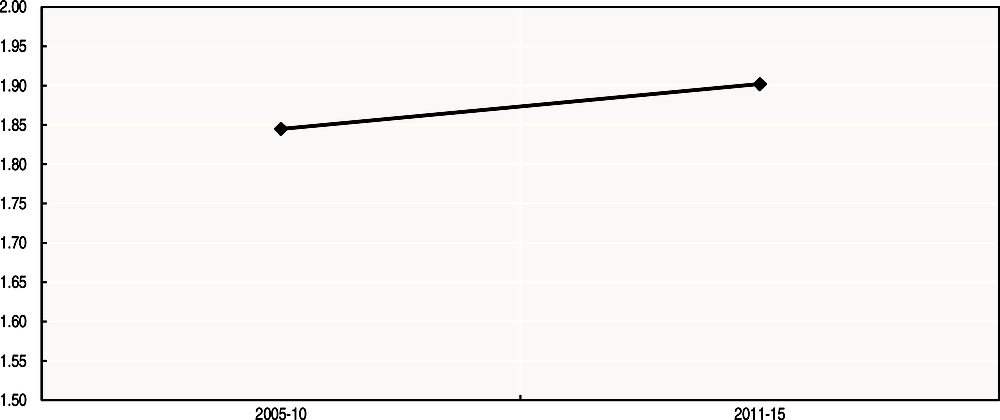
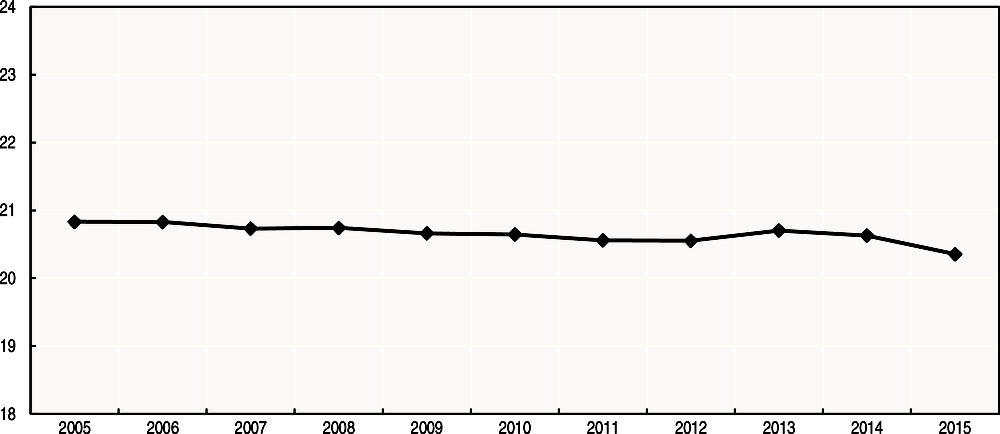
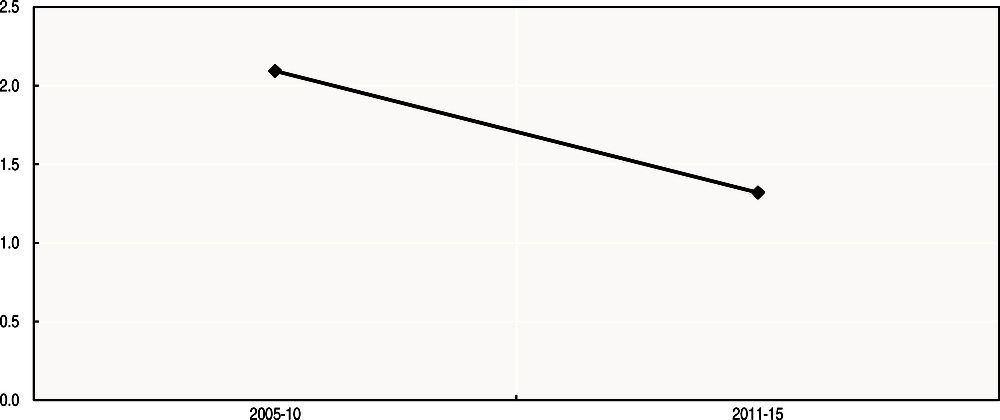
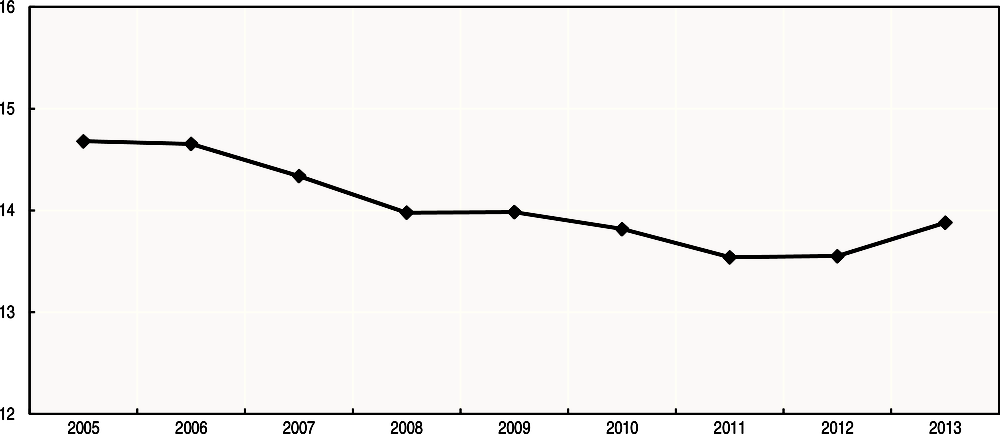
HOUSING: Rooms per person
Definition
This indicator is a measure of whether people are living in crowded conditions. It is measured as the number of rooms in a dwelling, divided by the number of persons living in the dwelling. It excludes rooms such as a kitchenette, scullery/utility room, bathroom, toilet, garage, consulting rooms, office or shop. The data sources are detailed in the figure note. Figure A.14 and Table A.8 show average values over the years 2005-10 and 2011-15 due to an incomplete time series in several countries.
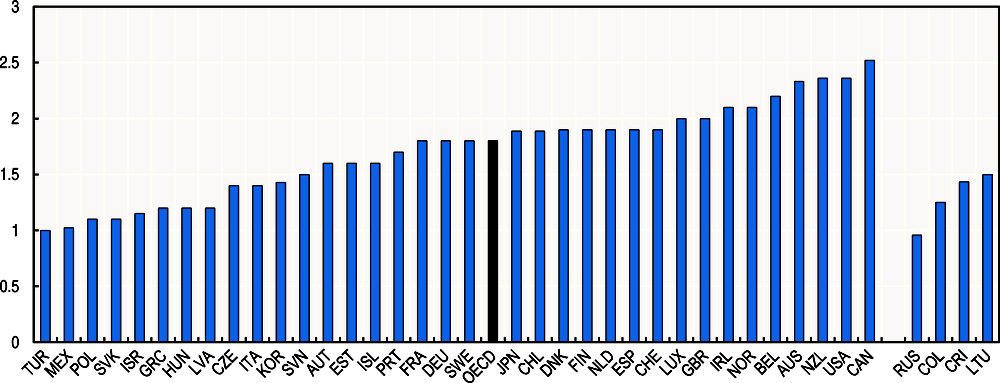
Note : The latest available year is 2016 for Colombia, Costa Rica, Finland, Hungary, Latvia and Lithuania; 2014 for Israel and Switzerland; 2013 for Japan, New Zealand, Turkey; 2011 for Australia, Canada; and 2010 for Korea. Values for Australia, Canada, Chile, Israel, Mexico, New Zealand and the United States are OECD calculations based on national data. The OECD average is population-weighted.
Source : European Union Statistics on Income and Living Conditions (EU-SILC), http://ec.europa.eu/eurostat/web/incomeand-living-conditions/overview for EU countries, Norway, Switzerland and Turkey; ABS Census of Population and Housing for Australia; Canadian National Household Survey for Canada; INE Census for Chile; Household and Multiple Purpose Survey of Costa Rica for data before 2010 and National Household Survey from 2010; Israeli Household Expenditure Survey for Israel; Housing and Land Survey for Japan; Population and Housing Census for Korea; INEGI Censo de Población y Vivienda and Encuesta Intercensal 2015 for Mexico; Census of New Zealand for New Zealand; ROSSTAT Income, Expenditure and Consumption of Households statistical report for the Russian Federation; and American Community Survey for the United States.
Note : The OECD average is population-weighted; it excludes Chile, Korea, Slovenia, Spain and the United Kingdom, due to incomplete time series for these countries.
Source : European Union Statistics on Income and Living Conditions (EU-SILC) for EU countries, Norway, Switzerland and Turkey; ABS Census of Population and Housing for Australia; Canadian National Household Survey for Canada; INE Census for Chile; Israeli Household Expenditure Survey for Israel; Housing and Land Survey for Japan; Population and Housing Census for Korea; INEGI Censo de Población y Vivienda and Encuesta Intercensal 2015 for Mexico; Census for New Zealand; American Community Survey for the United States.
Further reading:
Balestra, C. and J. Sultan (2013), “Home Sweet Home: The Determinants of Residential Satisfaction and its Relation with Well-being”, OECD Statistics Working Papers, No. 2013/05, OECD Publishing, Paris, https://doi.org/10.1787/5jzbcx0czc0x-en.
HOUSING: Housing affordability
Definition
This indicator refers to the share of household gross adjusted disposable income spent on housing and maintenance of the house, as defined in the System of National Accounts (SNA). It includes actual and imputed rentals for housing, expenditure on maintenance and repair of the dwelling (including miscellaneous services), on water supply, electricity, gas and other fuels, as well as the expenditure on furniture, furnishings, household equipment and goods and services for routine home maintenance. Expenditure is expressed as a percentage of the household gross adjusted disposable income. This measure of housing costs excludes household payments for interest and principal on housing mortgages. The data refer to the sum of households and non-profit institutions serving households and are sourced from the OECD National Accounts Database.
Note : The latest available year is 2016 for Canada, Denmark and the United Kingdom; 2014 for Costa Rica, Iceland, Italy, New Zealand, Norway, the Russian Federation and South Africa; and 2013 for Switzerland. The OECD average is population-weighted and excludes Israel and Luxembourg.
Source : OECD calculations based on OECD National Accounts Statistics (database), https://doi.org/10.1787/na-data-en.
Note : The OECD average is population-weighted and excludes Chile, Iceland, Israel, Italy, Luxembourg, New Zealand, Norway, Switzerland and Turkey, due to incomplete time series for these countries.
Source : OECD calculations based on OECD National Accounts Statistics (database), https://doi.org/10.1787/na-data-en.
Further reading:
OECD (2011b), “Housing conditions”, in OECD, How’s Life? Measuring Well-being, OECD Publishing, Paris, https://doi.org/10.1787/9789264121164-6-en.
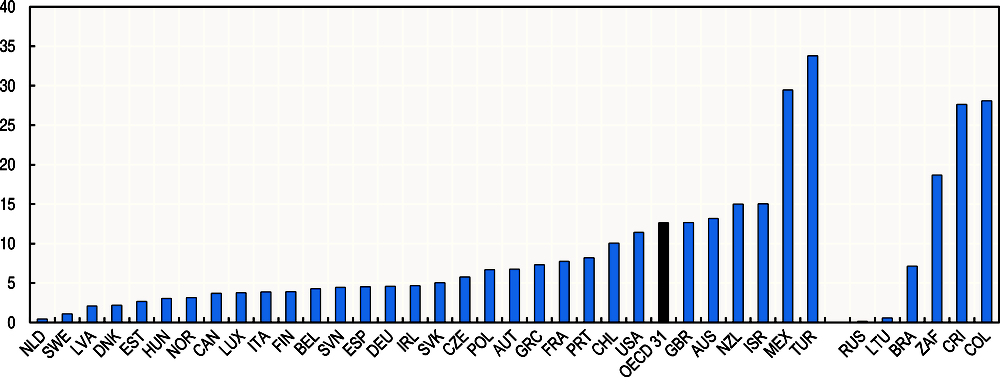
HOUSING: Basic Sanitation
Definition
This indicator refers to the percentage of the population living in a dwelling without an indoor flushing toilet for the sole use of the household. Flushing toilets outside the dwelling are not considered, but flushing toilets in a room where there is also a shower unit or a bath are included. The data sources are detailed in the figure note. Figure A.18 and Table A.10 show average values over the years 2005-10 and 2011-15, due to an incomplete time series in several countries.

Note : The latest available year is 2016 for Costa Rica, Finland, Hungary, Latvia, Lithuania and South Africa; 2014 for the Russian Federation; 2013 for the United States; 2010 for Korea and Mexico; 2001 for Chile; and 1997 for Canada. The OECD average is population-weighted and excludes Australia, Israel and New Zealand.
Source : European Union Statistics on Income and Living Conditions (EU-SILC) http://epp.eurostat.ec.europa.eu/portal/page/portal/microdata/eu_silc for EU countries, Norway, Switzerland and Turkey; Universo do Censo Demográfico 2010 for Brazil; Canadian Household Facilities and Equipment Survey for Canada; INE Censo 2002 for Chile; Household and Multiple Purpose Survey of Costa Rica for data before 2010 and National Household Survey from 2010; Housing and Land Survey of Japan for Japan; Population and Housing Census for Korea; INEGI Censo de Población y Vivienda 2010 for Mexico; ROSSTAT Income, Expenditure and Consumption of Households statistical report for the Russian Federation; and American Housing Survey for the United States.
Note : The OECD average is population-weighted; it excludes Australia, Canada, Chile, Israel, Japan, Korea, Mexico, New Zealand and the United Kingdom, due to incomplete time series for these countries.
Source : European Union Statistics on Income and Living Conditions (EU-SILC) http://epp.eurostat.ec.europa.eu/portal/page/portal/microdata/eu_silc for EU countries, Norway, Switzerland and Turkey; Canadian Household Facilities and Equipment Survey for Canada; INE Censo 2002 for Chile; Housing and Land Survey for Japan; Population and Housing Census for Korea; INEGI Censo de Población y Vivienda 2010 for Mexico; and American Housing Survey for the United States.
Further reading:
Balestra, C. and J. Sultan (2013), “Home Sweet Home: The Determinants of Residential Satisfaction and its Relation with Well-being”, OECD Statistics Working Papers, No. 2013/05, OECD Publishing, Paris, https://doi.org/10.1787/5jzbcx0czc0x-en.
OECD (2011b), “Housing conditions”, in OECD, How’s Life? Measuring Well-being, OECD Publishing, Paris, https://doi.org/10.1787/9789264121164-6-en.
WORK AND LIFE BALANCE: Working hours
Definition
This indicator refers to the number of employees whose usual working hours are 50 hours or more per week, expressed as a percentage of the total number of employees of all ages. The indicator excludes self-employed workers. The threshold is set at 50 hours because, after commuting, unpaid work and basic needs (such as sleeping and eating) are taken into account, workers routinely working more than 50 hours per week are likely to be left with very few hours (one or two per day) for other activities. Moreover, in countries where there is a regulation on maximum working time, this is generally limited to 48 hours per week. Data come from National Labour Force Surveys and are broadly comparable across countries.
Note : Data refer to the percentage of all employees usually working 50 hours or more per week, except for the Russian Federation for which data refer to people who worked 51 hours or more. The jobs covered are the main job for Canada, Chile, Colombia, Costa Rica, the Czech Republic, Finland, Hungary, Latvia, Mexico, Portugal, the Slovak Republic, Sweden and Turkey; and all jobs for all the other countries. Employees whose weekly usual hours worked vary from one week to another are excluded. Extra hours worked are not included in Canada, Chile, Hungary and Norway if they are not contractual; while they are included only if regular in Australia, Mexico, New Zealand, the Russian Federation, Sweden, Switzerland, Turkey and the United States. The main meal break is excluded for Austria, Belgium, Denmark, Estonia, France, Germany, Greece, Ireland, Italy, Luxembourg, the Netherlands, Portugal, the Slovak Republic, Slovenia, Spain and the United Kingdom. Details are not available for Brazil. The latest available year is 2015 for Brazil. The OECD average is population weighted and excludes Iceland, Japan, Korea and Switzerland.
Source : OECD calculations based on “Labour Force Statistics”, OECD Employment and Labour Market Statistics (database), https://doi.org/10.1787/lfs-lfs-data-en.
Note : Data refer to the percentage of all employees usually working 50 hours or more per week, except for the Russian Federation for which data refer to people who worked 51 hours or more. The jobs covered are the main job for Canada, Chile, the Czech Republic, Finland, Hungary, Latvia, Mexico, Portugal, the Slovak Republic, Sweden and Turkey; and all jobs for all the other countries. Employees whose usual hours worked vary from one week to another are excluded. Extra hours worked are not included in Canada, Chile, Hungary and Norway if they are not contractual; they are included only if regular in Australia, Mexico, New Zealand, the Russian Federation, Sweden, Switzerland, Turkey and the United States. The main meal break is excluded for Austria, Belgium, Denmark, Estonia, France, Germany, Greece, Ireland, Italy, Luxembourg, the Netherlands, Portugal, the Slovak Republic, Slovenia, Spain and the United Kingdom. Details are not available for Brazil. The OECD average is population-weighted; it excludes Chile, Germany, Iceland, Israel, Japan, Korea, New Zealand, Norway, Portugal, Switzerland and Turkey due to an incomplete time series and/or breaks in the data for these countries.
Source : OECD calculations based on “Labour Force Statistics”, OECD Employment and Labour Market Statistics (database), https://doi.org/10.1787/lfs-lfs-data-en.
WORK AND LIFE BALANCE: Time off
Definition
This indicator refers to the number of hours that people in full-time employment devote to leisure and personal care. The values shown refer to a typical day and to full-time employed people only, in order to improve comparability across countries where employment rates differ. The information is collected through national Time Use Surveys, which require participants keeping a diary of their activities over one or several representative days for a given period. Activities considered under the definition of “time devoted to leisure and personal care” include sleep, eating, hygiene, exercise, time spent with friends and family, and travel time devoted to leisure and personal care. For some countries and some specific types of activities, the comparability of these surveys is limited. The data shown here have been harmonised ex post by the OECD. Data are sourced from the Harmonised European Time Use Survey, the Eurostat time use database, public-use time use survey micro-data, and tabulations from National Statistical Offices.
Note : Data refer to 2016 for the United States; 2014-15 for the United Kingdom; 2011 for Japan; 2010 for Canada, Norway and South Africa; 2009-10 for Estonia, Finland, France, New Zealand, Spain; 2009 for Korea; 2008-09 for Austria and Italy; 2006 for Australia; 2005 for Belgium; 2003-04 for Poland; 2001-02 for Germany; 2001 for Denmark; and 2000-01 for Slovenia and Sweden. Data have been normalised to 1 440 minutes per day: in other words, for those countries for which the time use did not sum up to 1440 minutes, the missing or extra minutes (around 30-40 minutes usually) were proportionally distributed across all activities. Data for Hungary, Ireland, Portugal, Turkey and South Africa were excluded as they also include part-time workers. Survey samples include people aged 12 or more in New Zealand; 15 or more in Austria, Canada, Denmark, Finland, France, Italy, Japan, Spain and the United States; 20 to 74 years old in Belgium, Germany, Norway, Poland, Slovenia, Sweden; and 20 or more in Korea. As there is no specific question in the survey to identify full-time employed people in Canada, Japan, Korea and the United States, they have been defined on the basis of the minimum number of hours worked per week, which is set at 30, 35, 36 and 35 respectively. The OECD average is population-weighted; it excludes Chile, the Czech Republic, Greece, Hungary, Iceland, Ireland, Israel, Luxembourg, Mexico, the Netherlands, Portugal, the Slovak Republic, Switzerland and Turkey.
Source : OECD calculations based on the Harmonised European Time Use Survey web application for European countries (www.tus.scb.se); Eurostat database, http://appsso.eurostat.ec.europa.eu/nui/show.do?dataset=tus_00selfstat&lang=en; and public-use time use survey micro-data and tabulations from National Statistical Offices for non-European countries.
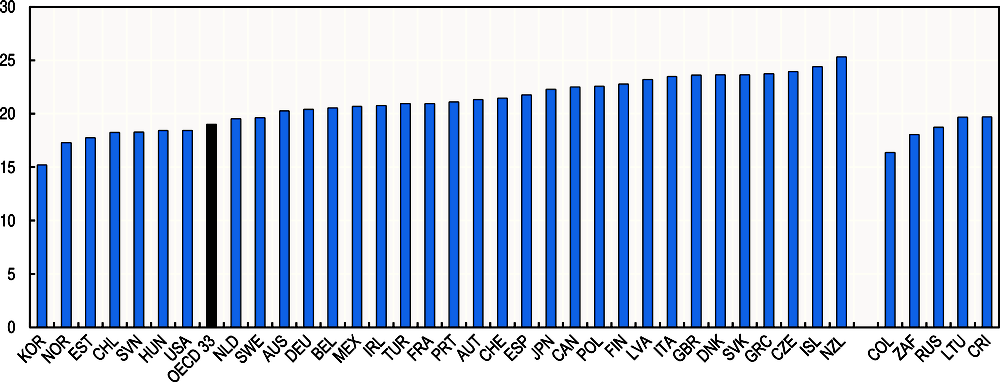
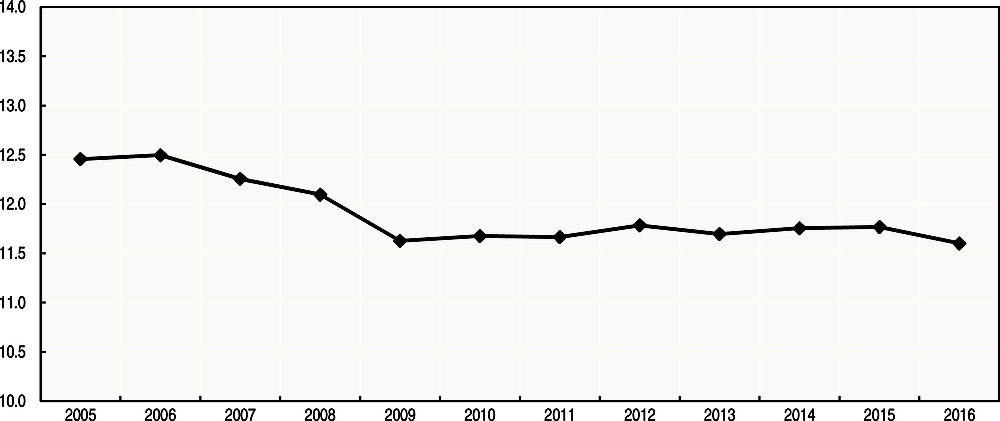
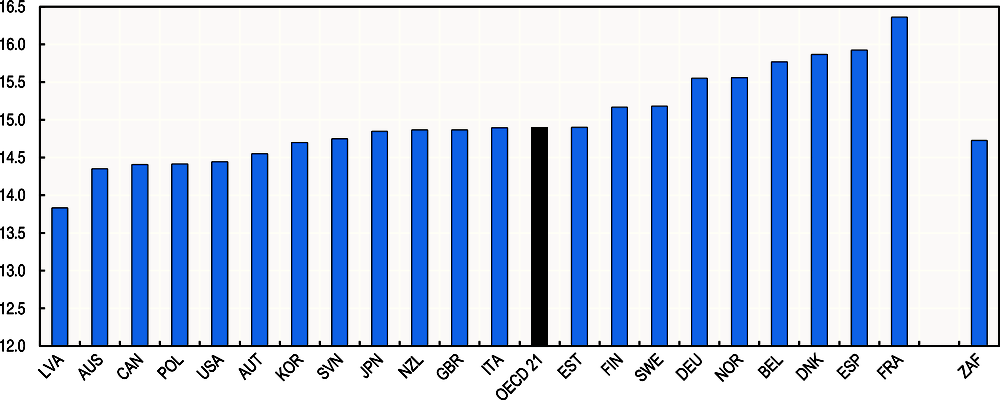
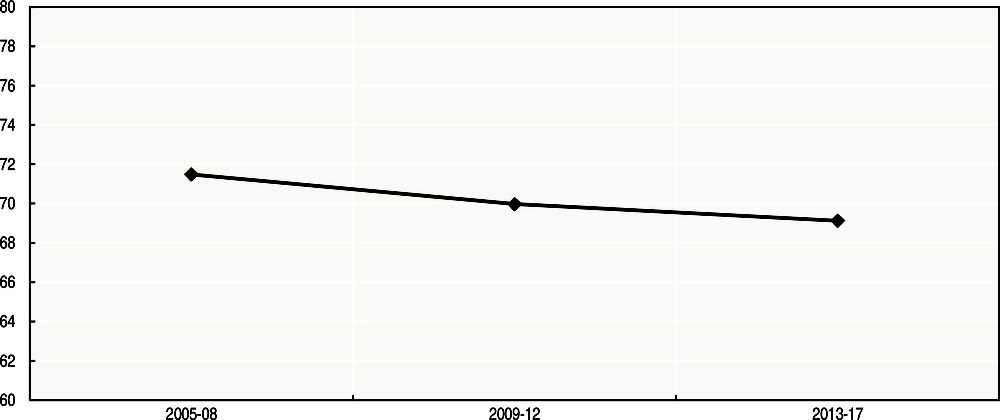
HEALTH STATUS: Life expectancy
Definition
This indicator measures the average number of years that people born today could expect to live, based on currently prevailing age-specific death rates. Life expectancy at birth for the population as a whole is computed as a weighted average of life expectancy for men and women. The data are based on official national statistics and calculations by Eurostat, compiled by the OECD and available in the OECD Health Statistics Database.
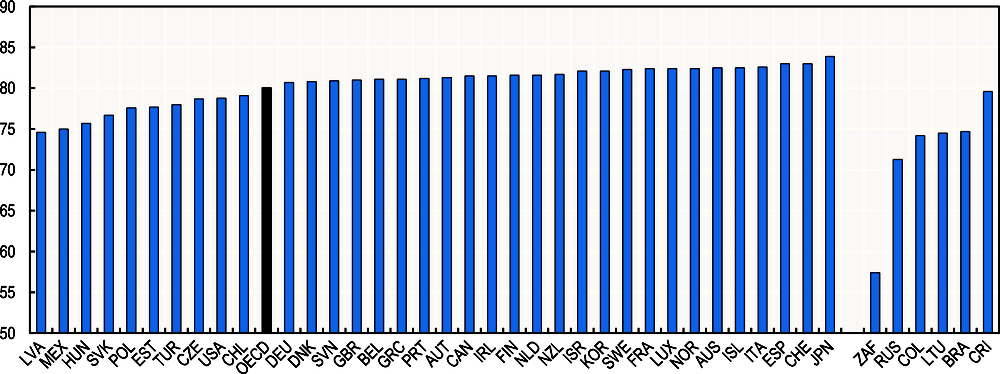
Note : The latest available year is 2012 for Canada. The OECD average is population-weighted.
Source : “Health status”, OECD Health Statistics (database), http://stats.oecd.org/Index.aspx?DataSetCode=HEALTH_STAT.
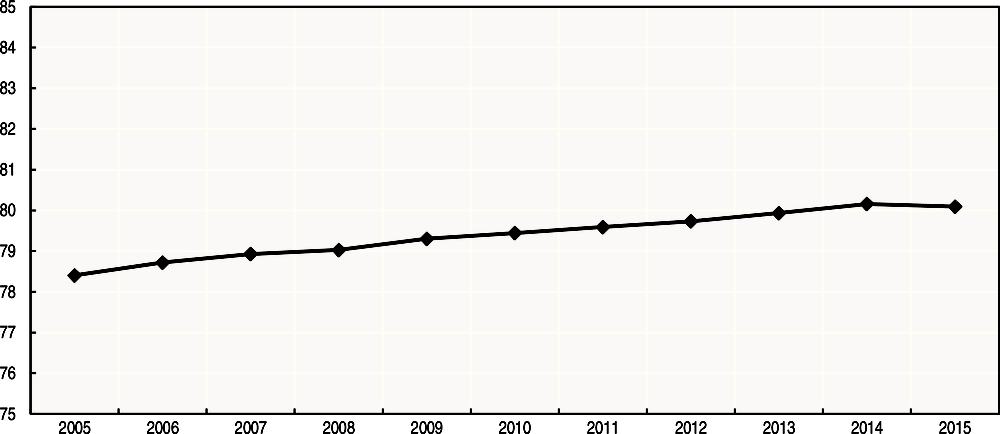
Note : The OECD average is population-weighted; it excludes Belgium, Canada, Hungary, Israel, Luxembourg, Poland, Slovenia and Turkey, due to incomplete time series for these countries.
Source : “Health status”, OECD Health Statistics (database), http://stats.oecd.org/Index.aspx?DataSetCode=HEALTH_STAT.
Further reading:
OECD (2017), Health at a Glance 2017: OECD Indicators, OECD Publishing, Paris, https://doi.org/10.1787/health_glance-2017-en.
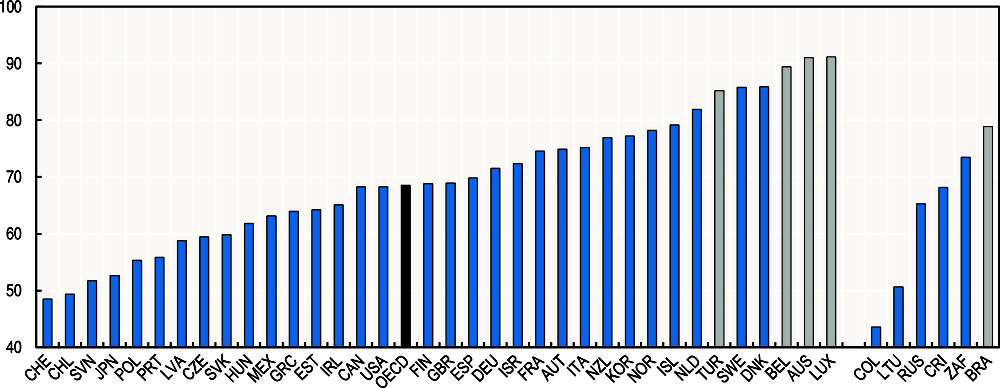
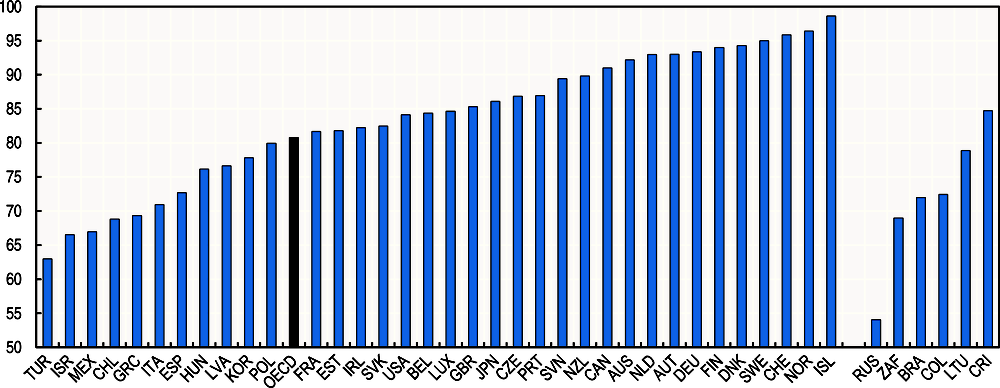
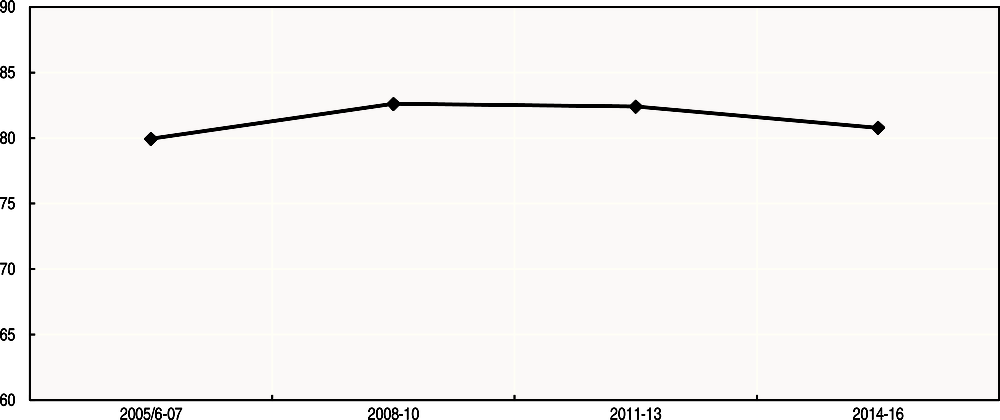
HEALTH STATUS: Perceived health
Definition
This indicator refers to the percentage of the population aged 16 and over who report being in “good” or “very good” health. The indicator is based on the following question: “How is your health in general?” with, in most countries, response categories of the type, “very good/ good/ fair/ bad/ very bad”. Some cross-country differences in the measurement methodology (for example, the use of different response scales) can limit comparability across countries, as explained in the note for Figure A.25. Data are compiled as part of the OECD Health Statistics Database, and are drawn from European Union Statistics on Income and Living Conditions (EU-SILC), general household surveys or more detailed health interviews undertaken as part of national official surveys in various countries.
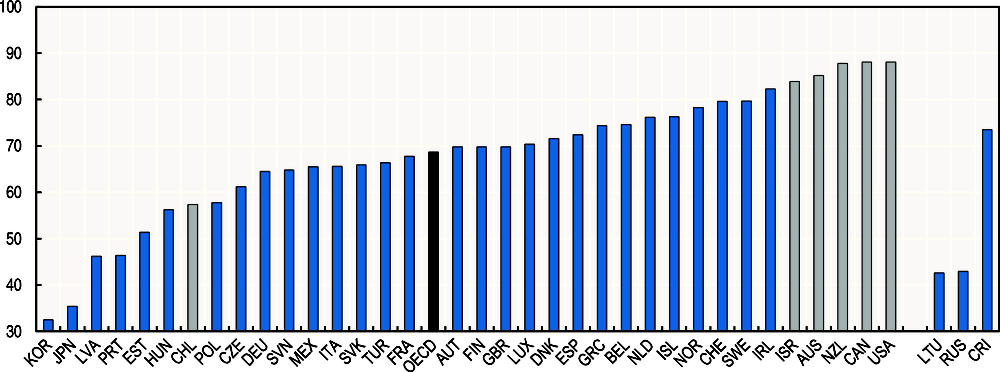
Note : Adults are generally defined as people aged 16 years and over. Data for Australia, Canada, Costa Rica, Chile, Japan, Korea, Lithuania, Mexico, New Zealand, the Russian Federation, Turkey and the United States refer to people aged 15 years and over; and data for Israel refer to people aged 20 years and over. The latest available year is 2016 for New Zealand; 2014 for Australia, Canada; 2013 for Japan; and 2006 for Mexico. Data for Australia, Canada, Chile, Israel, New Zealand and the United States (shown in grey) are not directly comparable with those for other countries, due to a difference in the reporting scales used, which may lead to an upward bias in the reported estimates. The OECD average is population-weighted.
Source : OECD calculations based on “Health status”, OECD Health Statistics (database), http://stats.oecd.org/Index.aspx?DataSetCode= HEALTH_STAT and INEC calculations based on the National Health Survey for Costa Rica.
Note : Adults are generally defined as people aged 16 years and over. Data for Australia, Canada, Costa Rica, Chile, Japan, Korea, Lithuania, Mexico, New Zealand, the Russian Federation, Turkey and the United States refer to people aged 15 years and over; and data for Israel refer to people aged 20 years and over. The OECD average time series has been estimated by interpolating missing data points in the time series for some countries; in these cases, missing data have been replaced by the average of the closest preceding and following year. Countries have only been included in the OECD average if the times series contains at least 3 data points, and at least one of them refers to 2014 or 2013. The OECD average is population-weighted and excludes Chile and Switzerland (due to a break in the time series), and Mexico (for which only two data points are available).
Source : OECD calculations based on “Health status”, OECD Health Statistics (database), http://stats.oecd.org/Index.aspx?DataSetCode= HEALTH_STAT.
Further reading:
OECD (2017), Health at a Glance 2017: OECD Indicators, OECD Publishing, Paris, https://doi.org/10.1787/health_ glance-2017-en.
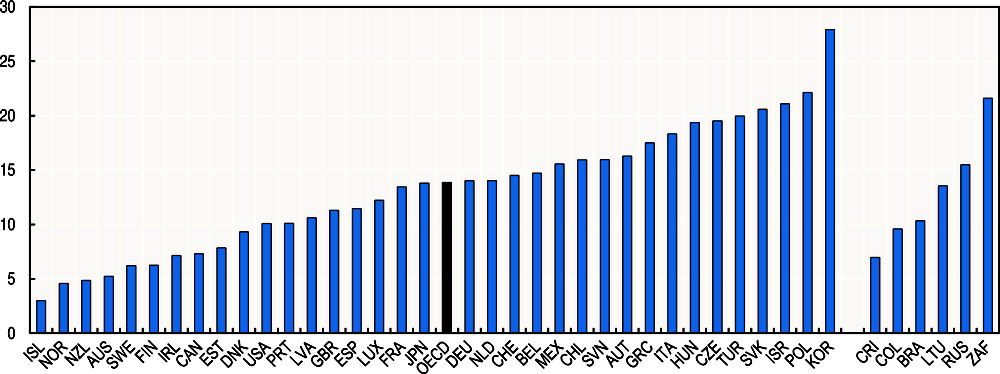
EDUCATION AND SKILLS: Educational attainment
Definition
This indicator refers to the number of adults aged 25 to 64 having completed at least an upper secondary education, over the total population of the same age. The definition of “at least upper secondary education” corresponds to the International Standard Classification of Education (ISCED 2011) levels 3 and above and includes both: i) programmes defined as “general”, which are often designed for preparing students for further education; and ii) programmes geared towards vocational education and training (VET). The data underlying this indicator are collected through the annual OECD questionnaire on National Educational Attainment Categories (NEAC) and are based on national Labour Force Survey data.
Note : Data are compiled following the ISCED 2011 classification for all countries, except for South Africa, where they are based on the ISCED-97 classification. The latest available year is 2015 for Brazil, Chile, Ireland, the Russian Federation and South Africa. The OECD average is population-weighted and excludes Japan.
Source : “Educational attainment and labour force status”, OECD Education at a glance (database), http://stats.oecd.org/Index.aspx?DataSet Code=EAG_NEAC.
Further reading:
OECD (2017), Education at a Glance 2017: OECD Indicators, OECD Publishing, Paris, https://doi.org/10.187/eag-2017-en.
EDUCATION AND SKILLS: Cognitive skills at 15
Definition
This indicator refers to the mean score of students aged 15 in reading, mathematics and science. The indicator is based on data collected through the Programme on International Student Assessment (PISA) coordinated by the OECD. Skills in reading, mathematics and science are each assessed separately, and measured on a scale which is normalised such that a value of 500 represents the OECD average. The summary shown here represents the average score across the three assessments.
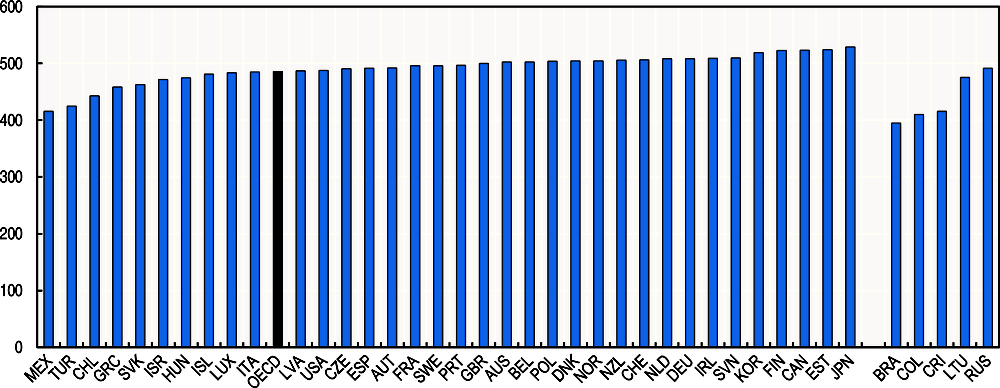
Note : The PISA scores on reading, mathematics and science are each measured on a scale which is normalised to be 500 for the OECD average. The OECD average is population-weighted.
Source : OECD calculations based on “PISA 2015 Results (Volume I): Excellence and Equity in Education”, PISA, OECD Publishing, Paris, https://doi.org/10.1787/9789264266490-en.
Further reading:
OECD (2016), PISA 2015 Results (Volume I): Excellence and Equity in Education, PISA, OECD Publishing, Paris, https://doi.org/10.1787/9789264266490-en.
EDUCATION AND SKILLS: Adult skills
Definition
This indicator refers to the mean proficiency of adults in literacy and numeracy. It is based on data collected through the OECD Survey of Adult Skills, which is part of the Programme for the International Assessment of Adult Competencies (PIAAC) coordinated by the OECD. The indicator refers to adults aged 16-65. A major component of the PIAAC is the direct assessment of key information-processing skills: literacy, numeracy and problem-solving in the context of technology-rich environments. In each of the domains assessed, proficiency is considered as a continuum of ability involving the mastery of information-processing tasks of increasing complexity. The country scores are measured on a scale which is normalised such that a value of 500 represents the OECD average in each domain.
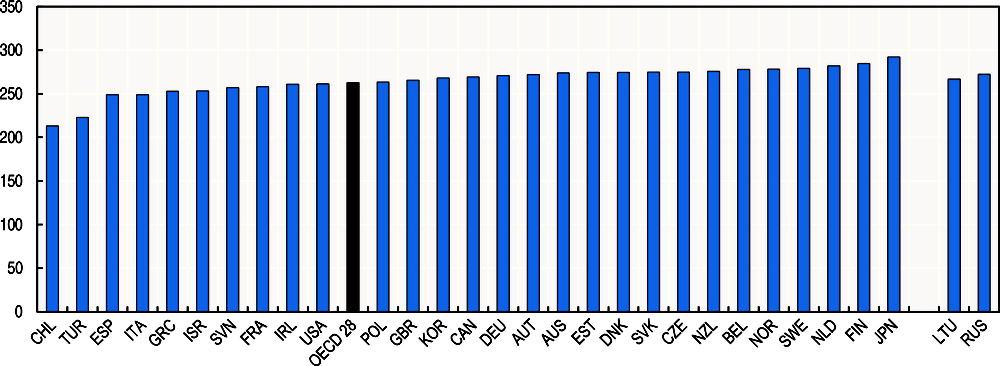
Note : Data refer to 2011-12 for Australia, Austria, Belgium, Canada, the Czech Republic, Denmark, Estonia, Finland, Germany, Ireland, Italy, Japan, Korea, the Netherlands, Poland, the Russian Federation, the Slovak Republic, Spain, Sweden, the United Kingdom and the United States; 2012 for France; and 2014-15 for Chile, Greece, Israel, Lithuania, New Zealand, Slovenia and Turkey. Data for Belgium refer to Flanders; those for the United Kingdom refer to England and Northern Ireland; and those for the Russian Federation exclude the Moscow municipal area. In each domain, the results are represented on a 500-point scale. The OECD average is population-weighted and excludes Hungary, Iceland, Latvia, Luxembourg, Mexico, Portugal and Switzerland.
Source : OECD calculations based on “Skills Matter: Further Results from the Survey of Adult Skills”, OECD Skills Studies, OECD Publishing, Paris, https://doi.org/10.1787/9789264258051-en.
Further reading:
OECD (2016), Skills Matter: Further Results from the Survey of Adult Skills, OECD Skills Studies, OECD Publishing, Paris, https://doi.org/10.1787/9789264258051-en.
SOCIAL CONNECTIONS: Social support
Definition
This indicator refers to the share of people reporting that they have friends or relatives whom they can count on to help in case of need. It is based on the survey question: “If you were in trouble, do you have relatives or friends you can count on to help you whenever you need them, or not?” and presents the percentage of the sample responding “yes”. Data are averaged over a three-year period. The source for these data is the Gallup World Poll, which samples around 1 000 people per country, per year. The sample is ex ante designed to be nationally representative of the population aged 15 and over (including rural areas); the sample data are weighted to the population using weights supplied by Gallup.
Note : The OECD average is population-weighted.
Source : OECD calculations based on Gallup World Poll, www.gallup.com/services/170945/world-poll.aspx.
Note : The OECD average is population-weighted and excludes Iceland and Luxembourg, due to incomplete time series for these countries.
Source : OECD calculations based on Gallup World Poll, www.gallup.com/services/170945/world-poll.aspx.
Further reading:
Scrivens, K. and C. Smith (2013), “Four Interpretations of Social Capital: An Agenda for Measurement”, OECD Statistics Working Papers, No. 2013/06, OECD Publishing, Paris, https://doi.org/10.1787/5jzbcx010wmt-en.
CIVIC ENGAGEMENT AND GOVERNANCE: Having a say in government
Definition
This indicator is a measure of people’s beliefs in the responsiveness of political bodies to citizens’ demands. It considers the percentage of adults aged 16-65 who disagree or strongly disagree with the statement: “People like me don’t have any say in what the government does”, answered through a five point labelled scale (with responses ranging from 1 for “strongly agree”, to 5 for “strongly disagree”). Data are collected through the OECD Survey of Adult Skills, which is part of the Programme for the International Assessment of Adult Competencies (PIAAC) coordinated by the OECD.
Note : Data refer to 2011-12 for Australia, Austria, Belgium, Canada, the Czech Republic, Denmark, Estonia, Finland, Germany, Ireland, Italy, Japan, Korea, the Netherlands, Poland, the Russian Federation, the Slovak Republic, Spain, Sweden, the United Kingdom and the United States; to 2012 for France; and to 2014-15 for Chile, Greece, Israel, Lithuania, New Zealand, Slovenia and Turkey. Data for Belgium refer to Flanders; those for the United Kingdom refer to England and Northern Ireland; and those for the Russian Federation exclude the Moscow municipal area. The OECD average is population-weighted and excludes Hungary, Iceland, Latvia, Luxembourg, Mexico, Portugal and Switzerland.
Source : OECD calculations based on data from “OECD Survey of Adult Skills” (PIAAC database), www.oecd.org/site/piaac/.
Further reading:
OECD (2016), Skills Matter: Further Results from the Survey of Adult Skills, OECD Skills Studies, OECD Publishing, Paris, https://doi.org/10.1787/9789264258051-en.
CIVIC ENGAGEMENT AND GOVERNANCE: Voter turnout
Definition
This indicator presents the number of individuals who cast a ballot in a national election, as a percentage of the population registered to vote. As institutional features of voting systems vary across countries and by types of elections, the measures shown here refer to the national elections (either parliamentary or presidential), which attract the largest proportions of voters in each country. Australia, Belgium, Brazil, Luxembourg and Turkey enforce compulsory voting. The registered population refers to the population listed on the electoral register. Data on voter turnout are gathered by National Statistical Offices and National Electoral Management Bodies, and are compiled by the International Institute for Democracy and Electoral Assistance (IDEA).
Note : National elections refer to parliamentary elections, with the exceptions of Brazil, Finland, France, Korea, Mexico, Poland, the Russian Federation and the United States, where presidential elections are considered. Australia, Belgium, Brazil and Luxembourg and Turkey, shown in grey on the figure, enforce compulsory voting. The latest available year is 2017 for France, Korea, the Netherlands and the United Kingdom; 2016 for Australia, Iceland, Ireland, Lithuania, the Slovak Republic, Spain and the United States; 2015 for Canada, Denmark, Estonia, Greece, Israel, Poland, Portugal, Switzerland and Turkey; 2014 for Belgium, Brazil, Colombia, Costa Rica, Hungary, Japan, Latvia, New Zealand, Slovenia, South Africa, Sweden; 2013 for Austria, Chile, the Czech Republic, Germany, Italy, Luxembourg, Norway; and 2012 for Finland, Mexico and the Russian Federation. The OECD average is population-weighted.
Source : International Institute for Democracy and Electoral Assistance (IDEA) (2017), www.idea.int; the register of the Supreme Electoral Tribunal for Costa Rica and the Federal Statistical Office (FSO) for Switzerland.
Note : National elections refer to parliamentary elections, with the exceptions of Brazil, Finland, France, Korea, Mexico, Poland, the Russian Federation and the United States, where presidential elections are considered. Since elections rarely occur on an annual basis, the OECD average has been calculated across four-year periods. This required excluding Austria, Finland, Italy, Luxembourg and Mexico from the OECD average calculation. Chile is also excluded since compulsory voting was dropped in 2012, introducing a break in the series.
Source : International Institute for Democracy and Electoral Assistance (IDEA) (2017), www.idea.int; the register of the Supreme Electoral Tribunal for Costa Rica and the Federal Statistical Office (FSO) for Switzerland.
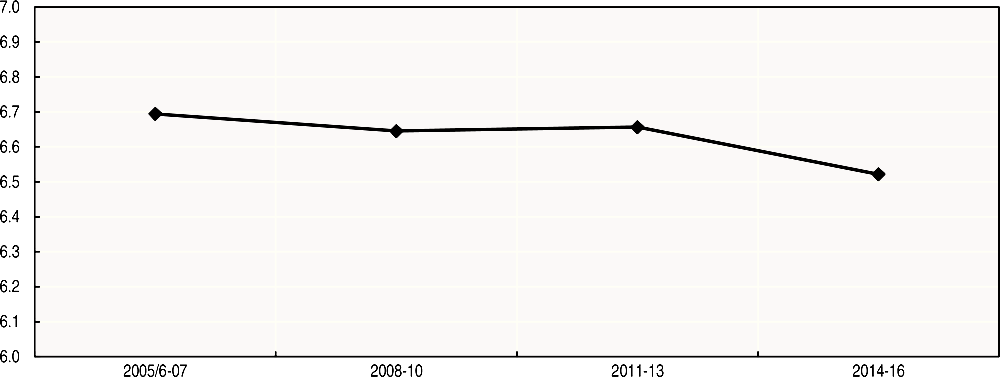
ENVIRONMENTAL QUALITY: Water quality
Definition
This indicator captures people’s perceptions about the quality of water in their local area. It is based on the question: “In the city or area where you live, are you satisfied or dissatisfied with the quality of water?”, and it considers the share of people who declared being satisfied. Data are averaged over a three-year period. Data come from the Gallup World Poll, which samples around 1 000 people per country, per year. The sample is ex ante designed to be nationally representative of the population aged 15 and over, including rural areas; sample data are weighted to the population using weights supplied by Gallup.
Note : The OECD average is population-weighted.
Source : OECD calculations based on Gallup World Poll, www.gallup.com/services/170945/world-poll.aspx.
Note : The OECD average is population-weighted and excludes Iceland and Luxembourg, due to incomplete time series for these countries.
Source : OECD calculations based on Gallup World Poll, www.gallup.com/services/170945/world-poll.aspx.
ENVIRONMENTAL QUALITY: Air quality
Definition
This indicator refers to the population-wide average exposure to outdoor air pollution by fine particulate matter that is less than 2.5 microns in diameter (PM2.5). The data are averaged over a three-year period. The underlying PM2.5 concentrations estimates are taken from van Donkelaar et al. (2016), and are based on satellite observations and a chemical transport model, calibrated to global ground-based measurements using Geographically Weighted Regression at 0.01° resolution. This hybrid approach has the advantage of being available for areas that lack a sufficient density of ground-based air monitoring stations and it is also more comparable between different areas than estimates derived from ground-based measurements stations alone. While satellite observations are less precise than in situ monitoring, the two data sources are complementary. The estimates include particulates originating from both natural and anthropogenic sources. Population exposure is calculated by weighting concentrations with population in each cell of the gridded concentration data, with the possibility of over/under-estimating exposure in certain locations. The underlying population data, Gridded Population of the World, version 4 (GPWv4) are taken from the Socioeconomic Data and Applications Center (SEDAC) at the NASA. The underlying boundary geometries are taken from the Global Administrative Unit Layers (GAUL) developed by the FAO, and the OECD Territorial Classification, when available.
Note : The 2013 moving averages are interpolated from 2012, 2013 and 2015, as estimates for 2014 are not available. The OECD average is population-weighted.
Source : OECD calculations based on “OECD Exposure to air pollution” (database), http://dotstat.oecd.org/Index.aspx?DataSet Code=EXP_PM2_5.
Note : Values are 3-year moving averages. 2013 values are interpolated from 2012, 2013 and 2015, as estimates for 2014 are not available. The OECD average is population-weighted.
Source : OECD calculations based on “OECD Exposure to air pollution” (database), http://dotstat.oecd.org/Index.aspx?DataSetCode= EXP_PM2_5.
Further reading:
Mackie, A., I. Haščič and M. Cárdenas Rodríguez (2016), Population Exposure to Fine Particles: Methodology and Results for OECD and G20 Countries, OECD Green Growth Papers, No. 2016/02, OECD Publishing, Paris, https://doi.org/10.1787/5jlsqs8g1t9r-en.
OECD (2017), Green Growth Indicators 2017, OECD Green Growth Studies, OECD Publishing, Paris, https://doi.org/10.1787/9789264268586-en.
PERSONAL SECURITY: Homicides
Definition
This indicator refers to cases in which assault is registered as the cause of death in official death registers (ICD-10 code: X85-Y09, Y87.1). It is shown as an age-standardised rate to ensure that the data are comparable across countries with different population age structures, and is expressed per 100000 people. Data are averaged over a three or four-year period because data are not available annually in all OECD countries. Cause-of-death statistics come from country civil registration systems, compiled by national authorities and collated by the World Health Organisation (WHO). Only medically certified causes of death are included. The data shown here are available in the OECD Causes of Mortality Database.
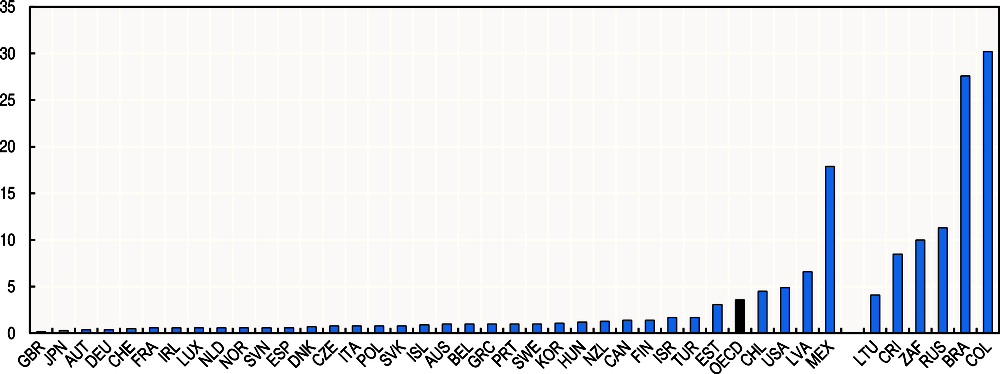
Note : The latest available year is 2015 for the Czech Republic, Hungary, Iceland, Lithuania, the Netherlands, Slovenia, Sweden; 2013 for Colombia, France, Ireland, Korea, Switzerland, Turkey, the United Kingdom; 2012 for Canada, Italy, New Zealand; and 2011 for the Russian Federation. The OECD average is population-weighted.
Source : OECD calculations based on “OECD Health Data: Causes of Mortality”, OECD Health Statistics (database), http://stats.oecd.org/Index.aspx?DataSetCode=HEALTH_STAT.
Note : The OECD average time series has been estimated by interpolating missing data points in the time series. For each country, missing data have been replaced by the average of the closest preceding and following year. The OECD average is population-weighted and excludes Ireland, due to a break in the series for this country.
Source : OECD calculations based on “OECD Health Data: Causes of Mortality”, OECD Health Statistics (database), http://stats.oecd.org/Index.aspx?DataSetCode=HEALTH_STAT.
Further reading:
United Nations Office on Drugs and Crime (UNODC) (2013), Report of the National Institute of Statistics and Geography of Mexico and the United Nations Office on Drugs and Crime, http://unstats.un.org/unsd/statcom/doc13/2013-11-CrimeStats-E.pdf.
PERSONAL SECURITY: Feeling safe at night
Definition
This indicator is based on the survey question: “Do you feel safe walking alone at night in the city or area where you live?”, and the data shown here reflect the percentage of all respondents who replied “yes”. Data are averaged over a three-year period, and are sourced from the Gallup World Poll, which samples around 1 000 people per country, per year. The sample is ex ante designed to be nationally representative of the population aged 15 and over (including rural areas); the sample data are weighted to the population using weights supplied by Gallup.
Note : The OECD average is population-weighted.
Source : OECD calculations based on Gallup World Poll, www.gallup.com/services/170945/world-poll.aspx.
Note : The OECD average is population-weighted and excludes Iceland and Luxembourg, due to incomplete time series for these countries.
Source : OECD calculations based on Gallup World Poll, www.gallup.com/services/170945/world-poll.aspx.
Further reading:
OECD (2011d), “Personal security”, in OECD, How’s Life?: Measuring Well-being, OECD Publishing, Paris, https://doi.org/10.1787/9789264121164-13-en.
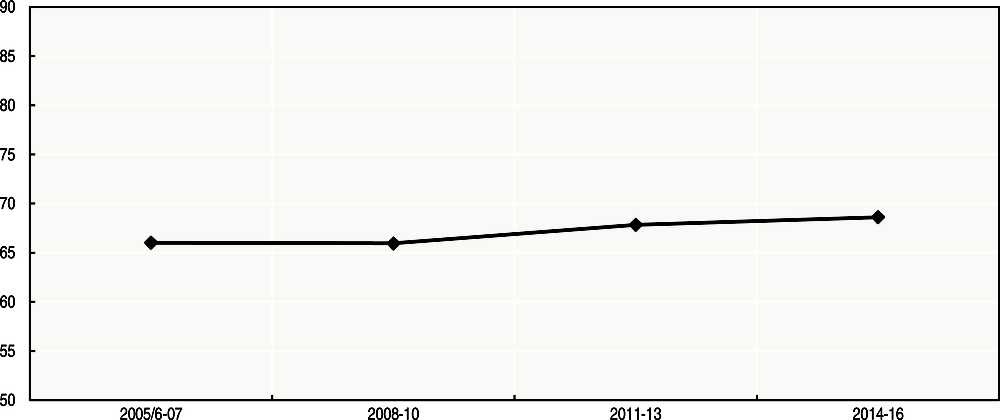
SUBJECTIVE WELL-BEING: Life satisfaction
Special note: for this indicator, information about current levels (Figure A.43) is based on estimates provided by National Statistics Offices, based on national surveys that rely on broadly comparable questions. Information on changes over time (Figure A.44) is based on the Gallup World Poll, since this source enables a longer time series and wider range of countries to be assessed on a comparable basis. Please see the definitions provided below for further details.
Current levels
Definition
This indicator refers to the mean average score on an 11-point scale. It is based on survey questions that broadly follow the format recommended by the OECD Guidelines on Measuring Subjective Well-Being (OECD, 2013): “Overall, how satisfied are you with life as a whole these days?”, with responses ranging from 0 (“not at all satisfied”) to 10 (“completely satisfied”). The European data come from the European Union Statistics on Income and Living Conditions (EU-SILC) ad hoc module on well-being, conducted in 2013, except for Austria, Hungary, Poland, Slovenia and Switzerland for which the National SILC is considered and except for Denmark, France and Italy for which the national social survey is considered, due to an higher survey frequency. EU-SILC is a nationally representative survey with large samples (from around 4 000 individuals in the smallest member states, to around 16 000 in the largest) covering all members of private households aged 16 or older. Data for Australia are based on the Australian Bureau of Statistics’ General Social Survey; those for Canada on Statistics Canada’s Canadian Community Health Survey; those for Italy on ISTAT’s Multipurpose survey on households; those for Mexico on INEGI’s National Survey of Household Expenditure; those for New Zealand on Statistics New Zealand’s General Social Survey; and those for the United Kingdom on ONS Annual Population Survey. Data for Australia, Canada, Denmark, France, Hungary, Korea, New Zealand and the Netherlands refer to the population aged 15 and over; data for Mexico refer to people aged 18-70 years old.
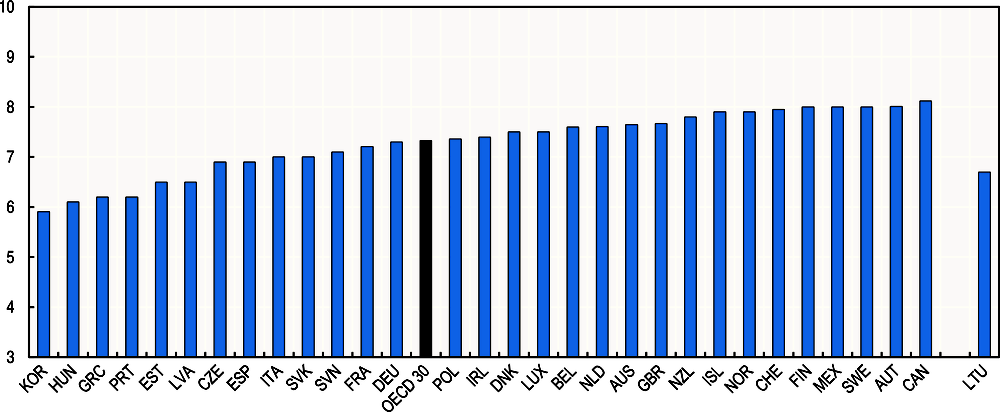
Note : Data refer to 2016 for Austria, Hungary, Italy, Korea, the Netherlands, New Zealand, Slovenia and the United Kingdom; to 2015 for Canada, Denmark, France, Poland and Switzerland; and to 2014 for Australia and Mexico. The OECD average is population-weighted and excludes Chile, Israel, Japan, Turkey and the United States.
Source : European Union Statistics on Income and Living Conditions (EU-SILC), http://ec.europa.eu/eurostat/web/incomeand-living-conditions/overview for EU countries, except for Austria, Hungary, Poland, Slovenia and Switzerland for which the National SILC is considered and except for Denmark, France and Italy for which the national social survey is considered, due to an higher survey frequency; Australian Bureau of Statistics, 2014 General Social Survey, www.abs.gov.au/ausstats/[email protected]/mf/4159.0#Anchor3 for Australia; Statistics Austria; Statistics Canada, Canadian Community Health Survey 2015, www23.statcan.gc.ca/imdb/p2SV.pl?Function=getSurvey&SDDS=3226 for Canada; Danmark Statistik, http://dst.dk/en/Statistik/dokumentation/documentationofstatistics/quality-of-life-indicators; INSEE, Statistiques sur les resources et conditions de vie, www.insee.fr/fr/metadonnees/source/s1220#consulter; ISTAT, Multipurpose survey on households 2016; INEGI, the National Survey of Household Expenditure (BIARE-ENGASTO) 2014, www.inegi.org.mx/inegi/contenidos/investigacion/Experimentales/Bienestar/default.aspx for Mexico; Statistics New Zealand, 2016 General Social Survey, www.stats.govt.nz/browse_for_stats/people_and_communities/Households/nzgss_HOTP2014/Tables.aspx; and ONS Annual Population Survey 2016 for the United Kingdom.
Changes over time
Definition
This section considers the mean score of life satisfaction based on the “Cantril ladder” sourced from the Gallup World Poll. In the survey, respondents are asked to imagine a ladder with rungs from 0 to 10, where 10 is the best possible life for them and 0 the worst possible life (i.e. the “Cantril ladder”) and then indicate whereabouts on the ladder they see themselves. The Gallup World Poll samples around 1 000 people per country each year, and data are shown averaged over a three-year period. The sample is ex ante designed to be nationally representative of the population aged 15 and over (including rural areas); the sample data are weighted to the population using weights supplied by Gallup.
Note : The OECD average is population-weighted and excludes Iceland and Luxembourg, due to incomplete time series for these countries.
Source : OECD calculations based on Gallup World Poll, www.gallup.com/services/170945/world-poll.aspx.
Further reading:
OECD (2013), Guidelines on Measuring Subjective Well-Being, www.oecd.org/statistics/guidelines-on-measuring subjective-well-being.htm.